👨🔧 Factor-Factor Relation
Learn about Factor Factor Product Relation
- This relationship deals with the resource combination and resource substitution.
- Cost minimization is the goal of factor-factor relationship.
- Under factor-factor relationship, output is kept constant, input is varied in quantity.
- This relationship guides the producer in deciding
How to produce. - This relationship is explained by the Principle of Factor Substitution or Principle of Substitution between Inputs.
- Factor-Factor relationship is concerned with the determination of least cost combination of resources.
- The choice indicators are substitution ratio and price ratio.
- Algebraically, it is expressed as
Y = f(X1, X2 / X3, X4 ….. Xn)
- In the production, inputs are substitutable. Capital can be substituted for labour and vice versa, grain can be substituted for fodder and vice versa. The producer has to choose that input or inputs, practice or practices which produce a given output with minimum cost. The producer aims at cost minimization i.e., choice of inputs and their combinations.
Isoquants
- The relationship between two factors and output cannot be presented with two-dimensional graph. This involves three variables and can be presented in three-dimensional diagram giving a production surface.
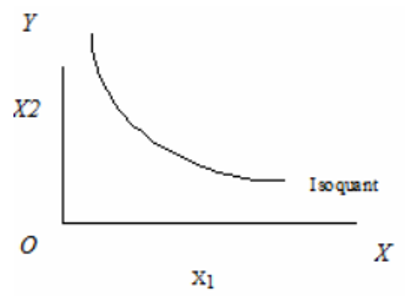
- An isoquant is a convenient method for compressing three-dimensional picture of production into two dimensions.
Definition
An isoquant represents all possible combinations of two resources (X1 and X2) physically capable of producing the same quantity of output. Isoquants are also known as
iso-product curvesorequal product curvesorproduct indifference curves.
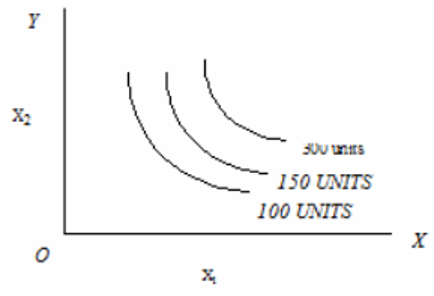
Isoquant Map or Iso Product Contour
- If number of isoquants are drawn on one graph, it is known as isoquant map. Isoquant map indicates the shape of production surface which in turn indicates the output response to the inputs.
Characteristics of Isoquants
- Slope downwards from left to right or negatively sloped.
- Convex to the origin.
- Non-intersecting
- Isoquants lying above and to the right of another represents higher level of output.
- The slope of isoquant denotes the Marginal Rate of Technical Substitution (MRTS).
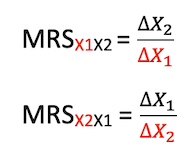
Marginal Rate of Technical Substitution (MRTS)
- It refers to the amount by which one resource is reduced as another resource is increased by one unit.
- Marginal Rate of Technical Substitution = (Number of units of
replacedresource )/(Number of units ofaddedresource) - The rate of exchange between some units of X1 and X2 which are equally preferred.
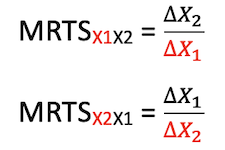
- The slope of Isoquant indicates MRTS.
Substitutes
- A range of input combinations which will produce a given level of output. When one factor is reduced in quantity, a second factor must always be increased MRTS is always less than zero. (
negative)
Perfect Substitutes
- When two resources are completely interchangeable, they are called perfect substitutes.
- The isoquants for perfect substitutes are negatively sloped straight lines. The MRTS is constant.
- Ex: Family labour and hired labour, Farm produced and purchased seed etc.
Complements
- Two resources which are used together are called complements.
- In the case of complements reduction in one factor cannot be replaced by an increase in another factor. MRTS is
zero.
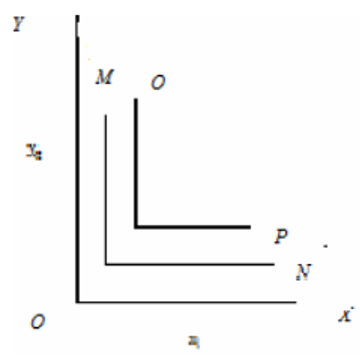
Perfect Complements
- Two resources which are used together in
fixed proportionare called perfect complements. - It means that only one exact combination of inputs will produce a particular level of output.
- The isoquant in this case is of a
right angle. - Ex: Tractor and driver, Pair of bullocks and labourer
Types of factor substitution
- The shape of isoquant and production surface will depend up on the manner in which the variable inputs are combined to produce a particular level of output.
- There can be three such categories of input combinations. They are:
Fixed Proportion combination of inputs
- To produce a given level of output, inputs are combined together in fixed proportion. Isoquants are ‘L’ shaped.
- It is difficult to find examples of inputs which combine only in fixed proportions in agriculture.
- An approximation to this situation is provided by tractor and driver combination. To operate another tractor, normally we need another driver.
Constant rate of Substitution
- For each one-unit gain in one factor, a constant quantity of another factor must be sacrificed.
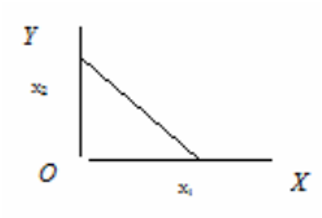
- When factors substitute at constant rate, isoquants are
linear,negatively sloped.
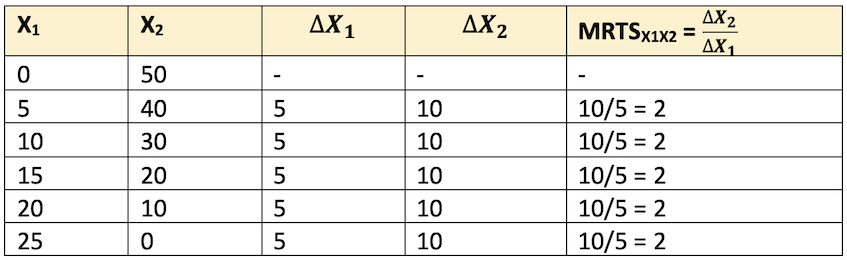
- The above table shows that the six combinations of resources X1 and X2 can be used in producing a given level of output. As X1 input is increased from 0 to 5 units, 10 units of X2 are replaced. Similarly, addition of another 5 units of X1 replaces another 10 units. The MRS of X1 for X2 is 2. That means if we want to obtain one unit of X1, we have to forego 2 units of X2.
- Ex: family labour and hired labour
- When inputs substitute at constant rate, it is economical to use only one resource, and which one to use depends up on relative prices.
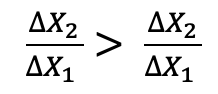
- Algebraically, constant rate of factor substitution is expressed as
Decreasing Rate of substitution
- Every subsequent increase in the use of one factor replaces less and less of other factor. In other words, each one unit increase in one factor requires smaller and smaller sacrifice in another factor.
- Ex: Capital and labour, concentrates and green fodder, organic and inorganic fertilizers etc.
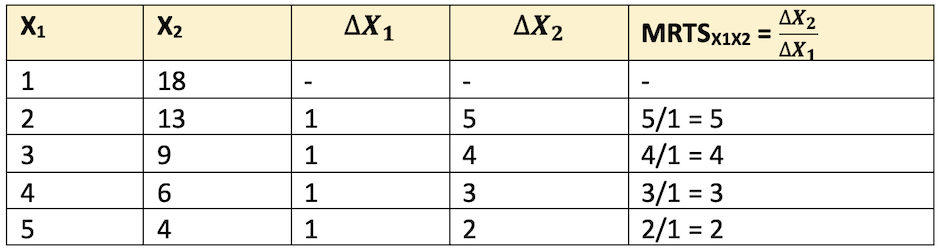
- The MRS of X1 for X2 becomes smaller and smaller as X1 replaces X2
- Isoquants are
convexto the origin when inputs substitute at decreasing rate.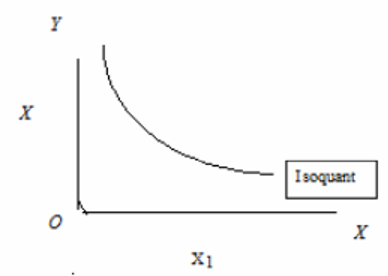
- Algebraically, decreasing rate of substitution is expressed as
- Decreasing rate of factor substitution is
more common in agricultural production.
Iso-cost Line
- Iso-cost line defines all possible combinations of two resources (X1 and X2) which can be purchased with a given outlay of funds.
- Iso-cost line is also known
price line,budget line,iso outlay line,factor cost line.
Characteristics of Iso-cost line
- As the total outlay increases, the iso-cost line moves farther away from the origin.
- Iso-cost line is a straight line because input prices do not change with the quantity purchased.
- The slope of iso-cost line indicates the
ratio of factor prices.
Least Cost Combination of inputs
- There are innumerable possible combinations of factors which can be used to produce a particular level of output. The problem is to find out a combination of inputs which should cost the least, a cost minimization problem.
- There are three methods to find out the least cost combination of inputs. They are:
1. Simple Arithmetical calculations
- One possible way to determine the least cost combination is to compute the cost of all possible combinations of inputs and then select one combination with minimum cost. This method is suitable where only a few combinations produce a particular level of output.
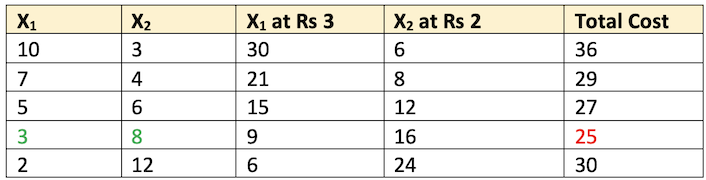
- The above table shows five combinations of inputs which can produce a given level of output. The price per unit of X1 is Rs. 3/- and of X2 is Rs. 2/-. The total cost of each combination of inputs is computed. Out of five combination, 3 units of X1 and 8 units of X2 is the least cost combination of inputs i.e., Rs.25/-
2. Algebraic method
a) Compute Marginal Rate of technical substitution
MRS = (Number of units of replaced resource)/(Number of units of
addedresource )
b) Compute Price Ratio (PR)
MRS = (Price per unit of
addedresource)/(Price per unit of replaced resource )
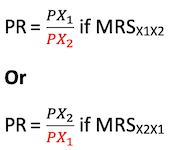
c) Workout least cost combination by equating MRS and PR
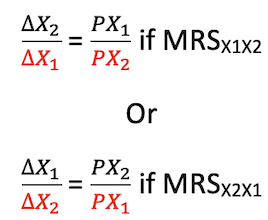
- The same can be expressed as
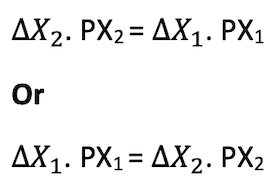
- The least cost combination is obtained when Marginal Rate of substitution is equal to Price Ratio.
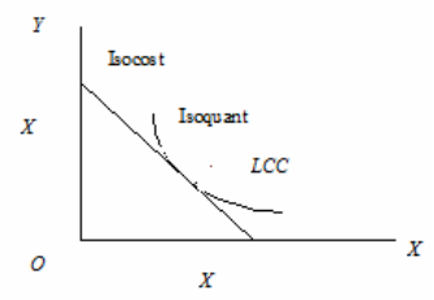
3. Graphical Method
- Since the slope of isoquant indicates MRTS and the slope of iso-cost line indicates factor price ratio, minimum cost for given output will be indicated by the tangency of these isoclines. For this purpose, iso-cost line and isoquant are drawn on the same graph for different levels of production. The least cost combination will be at the point where iso-cost line is tangent to the isoquant i.e., slope of isoquant = slope of iso-cost line i.e., MRS = PR.
Iso-Cline
- There can be number of possible output levels as shown in the figure and the least cost combination can be found out for these various output levels.
- A line or curve connecting the
least cost combination of inputsfor all output levels is called isocline.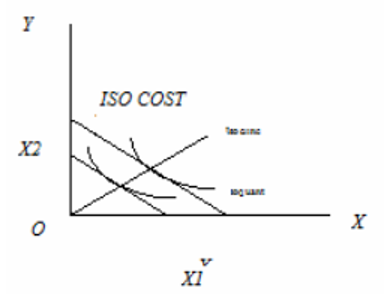
- The isocline passes through all the isoquants at points where they have the
same slope. Isoclines can be drawn at different sets of price ratio. All isoclines of course converge at the point of maximum output. Though all the points on isocline represent least cost combination, only one point represents the maximum profit output.
Expansion Path
- Of many isoclines, the isocline which is considered to be the
most appropriateover a production period is known as expansion path or scale line. - At any particular time, only one expansion path is possible.
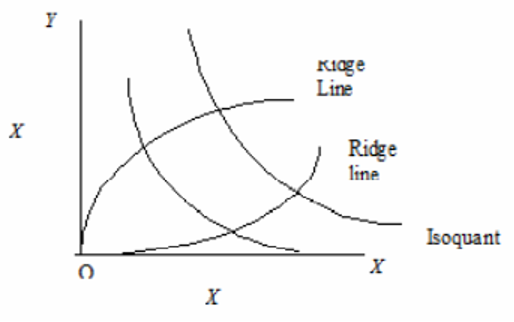
Ridge lines or Border or Boundary lines
- Ridge lines represent the points of maximum output from each input, given a fixed amount of another input. Also, they represent limits of substitution. Ridge lines reflect the limits of economic relevance, the boundaries beyond which isoquant map ceases to have economic meaning.
- The portions of isoquants which lie between the lines are suited for economic production (Where MPP of both inputs are positive but decreasing and isoquants are negatively sloped). Portions of iso-quants outside the ridge lines are not suitable for production in economic terms (outside the ridge lines, MPP of both factors are negative and methods of production are inefficient).
- This relationship deals with the resource combination and resource substitution.
- Cost minimization is the goal of factor-factor relationship.
- Under factor-factor relationship, output is kept constant, input is varied in quantity.
- This relationship guides the producer in deciding
How to produce. - This relationship is explained by the Principle of Factor Substitution or Principle of Substitution between Inputs.
- Factor-Factor relationship is concerned with the determination of least cost combination of resources.
- The choice indicators are substitution ratio and price ratio.
- Algebraically, it is expressed as
Y = f(X1, X2 / X3, X4 ….. Xn)
- In the production, inputs are substitutable. Capital can be substituted for labour and vice versa, grain can be substituted for fodder and vice versa. The …
Become Successful With AgriDots
Learn the essential skills for getting a seat in the Exam with
🦄 You are a pro member!
Only use this page if purchasing a gift or enterprise account
Plan
- Unlimited access to PRO courses
- Quizzes with hand-picked meme prizes
- Invite to private Discord chat
- Free Sticker emailed
Lifetime
- All PRO-tier benefits
- Single payment, lifetime access
- 4,200 bonus xp points
- Next Level
T-shirt shipped worldwide

Yo! You just found a 20% discount using 👉 EASTEREGG

High-quality fitted cotton shirt produced by Next Level Apparel