👨🏻💻 Product Product Relation
Learn about Product Product Relation
- Product-Product relation deals with resource allocation among competing enterprises.
- The goal of Product-Product relationship is
profit maximization. - Under Product-Product relationship,
inputs are kept constantwhile products (outputs) are varied. - This relationship guides the producer in deciding
What to produce. - This relationship is explained by the
principle of product substitutionandlaw of equi-marginal returns. - This relationship is concerned with the determination of optimum combination of products (enterprises).
- The choice indicators are
substitution ratioandprice ratio. - Algebraically it is expressed as
Y1 = f (Y2, Y3, ……. Yn)
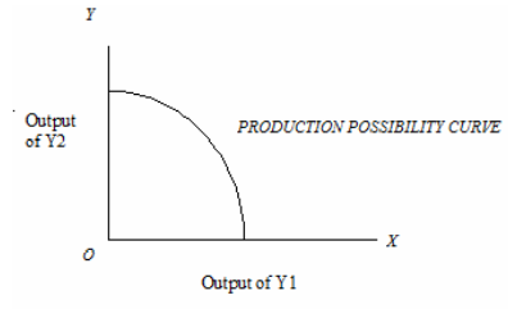
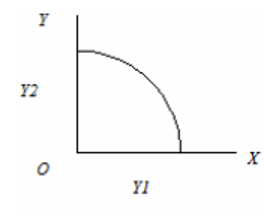
Production Possibility Curve (PPC)
- Production Possibility Curve is a convenient device for depicting two production functions on a single graph.
- Production Possibility Curve represents all possible combinations of two products that could be produced with same amounts of inputs.
- When PPC is a straight line then it is called production possibility line (PPL).
- Production Possibility Curve is known as
Opportunity Curvebecause it represents all production possibilities or opportunities available with limited resources. - It is called
Iso-resource CurveorIso-factor Curvebecause each output combination on this curve has the same resource requirement. - It is also called
Transformation Curveas it indicates the rate of transformation of one product into another.
Iso-revenue curve/Iso–return curve/ Iso-income curve
- The amount of land that can be used to produce Cotton (Y1) depends upon the amount of land used to produce Maize (Y2).
- Therefore, Y1 = f (Y2)
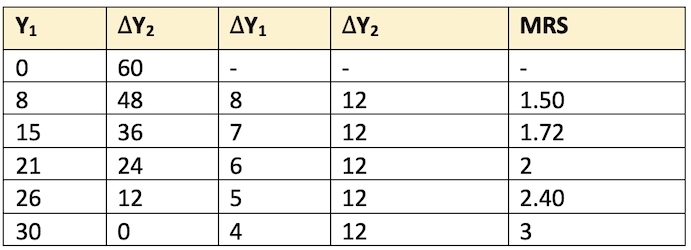
- The allocation of land resource between the two products and the output from different doses of land input are presented below:
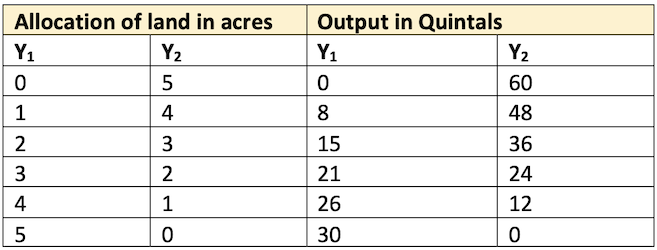
- As evident from the above data, if all 5 acres of land are used in the production of Y2 we obtain 60 quintals of Y2 and do not get any Y1. On the other hand, if all the five acres of land are used in the production of Y1 we can obtain 30 quintals of Y1 and do not get any Y2. But these are the two extreme production possibilities. In between these two, there will be many other production possibilities. Plotting these two points on a graph, we get the Production Possibility Curve.
Types of Product-Product Relationships or Enterprise Relationship
👉🏻 Farm commodities bear several physical relationships to one another. These basic product relationships can be:
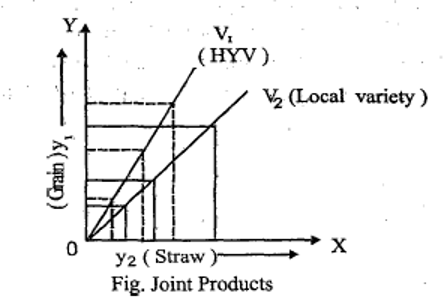
Joint Products
- These are produced through single production process. As a rule, the two are combined products. Production of one (main product) without the other (by-product) is not possible. The level of production of one decides the level of production of another.
- All farm commodities are mostly joint products.
- Ex: Wheat and Straw, paddy and straw, groundnut and hulms, cotton seed and lint, cattle and manure, butter and buttermilk, beef and hides, mutton and wool etc.
Complimentary Relationship
- Complementarity between two enterprises exists when with a change in the level of production of one, the other also changes in the same direction. That is when increase in output of one product, with resources held constant, also results in an increase in the output of the other product.
- The two enterprises do not compete for resources but contribute to the mutual production by providing an element of production required by each other.
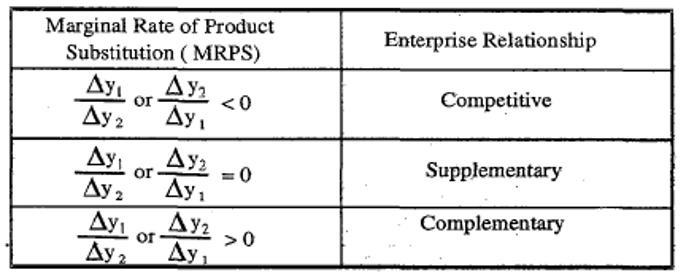
- The marginal rate of product substitution is
positive(> 0). - Ex: Cereals and pulses, Crops and livestock enterprises.
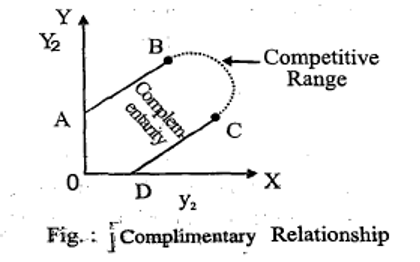
- As shown in the figure, range of complementarities is from point A to point B when production of Y1 expands beyond zero level. On the other end of the curve, the products again are complementary as production of Y2 expands beyond zero. This means Y1 must be produced up to B and Y2 up to point C, up to these points increase in one product increases the production of other.
- All complementary relationships should be taken advantage by producing both products up to the point where the products become competitive.
Supplementary Relationship
- The increase or decrease in the production level of one product does not affect the production level of the other product. Such type of relationship between product and product is called supplementary relationship.
- Here one enterprise is subsidiary enterprise and its contribution is 10% to the total Farm income. Subsidiary enterprises utilize the byproducts and the surplus labour.
- The marginal rate of product substitution is
zero. - For example, small poultry or dairy or piggery enterprise is supplementary on the farm.
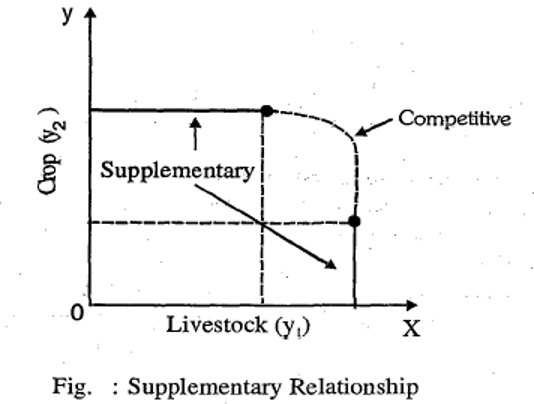
- All supplementary relationships should be taken advantage by producing both products up to the point where the products become competitive. Production of Y1 can be increased without affecting the production of Y2 in the range AB. From C to D, production of Y2 can be increased without affecting the production of Y1.
Competitive Relationship
- This relationship exists when increase or decrease in the production of one product affect the production of other product inversely.
- That is when increase in output of one product, with resources held constant, results in the decrease of output of other product.
- Competitive enterprises compete for the same resources.
- Two enterprises are competitive in the use of given resources if output of one can be increased only through sacrifice in the production of another.
- The marginal rate of product substitution is
negative(< 0).
Antagonistic products
- Two products may be detrimental to each other because of disease or similar factors. When this is true, only one of the products should be produced.
- Eg: Aqua culture and paddy cultivation.
- The above relationships are summarized below
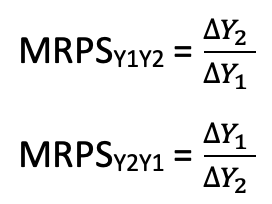
Marginal rate of product substitution (MRPS)
- The term marginal rate of product substitution has the same meaning under the product-product relationship as under the factor-factor relationship.
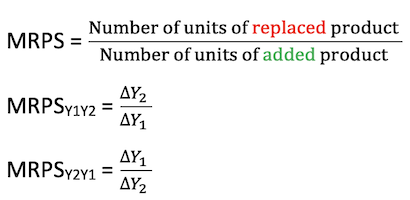
- Marginal rate of the product substitution refers to the absolute change in one product associated with a change of one unit in competing product.
- The quantity of one product to be sacrificed so as to gain another product by one unit is called MRPS.
- MRPS = (Number of units of
replacedproduct )/(Number of units ofaddedproduct )
Types of Product Substitution
- When two products are competitive, they substitute either at constant rate, or increasing rate or at decreasing rate.
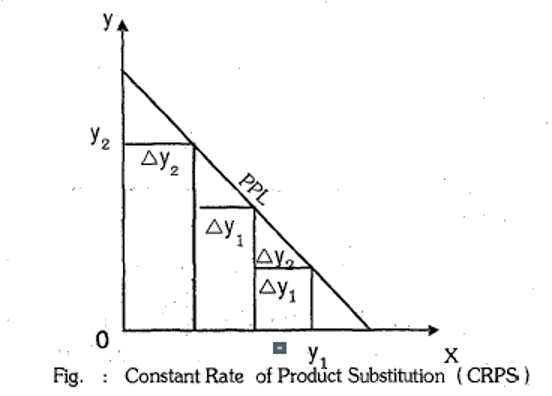
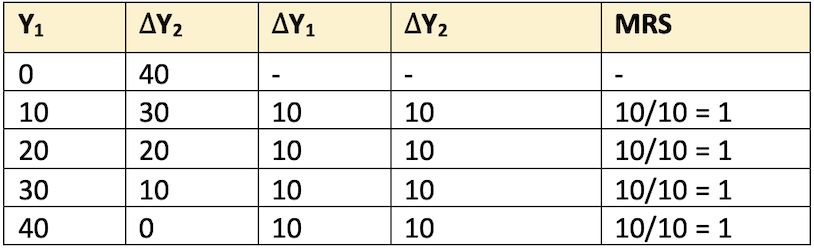
Constant Rate of Product Substitution (CRPS)
- For each one-unit increase or gain in one product, a constant quantity of another product must be decreased or sacrificed.
- When products substitute at constant rate, the Production Possibility Curve is linear negatively sloped.
- One of the production functions has an elasticity greater than one (increasing returns), the other has an elasticity of less than one (decreasing returns) Or
- Both the production functions have stages of increasing and decreasing returns.
- For example, Gram and Wheat substitute for land at constant rate.
- The Production Possibility Curve is linear when products substitute at constant rate. When two products substitute at constant rate, only one of the two products will be economical to produce depending on their relative prices. This is to say that
specializationis the general pattern of production under constant rate of product substitution.
- This relationship can be expressed as
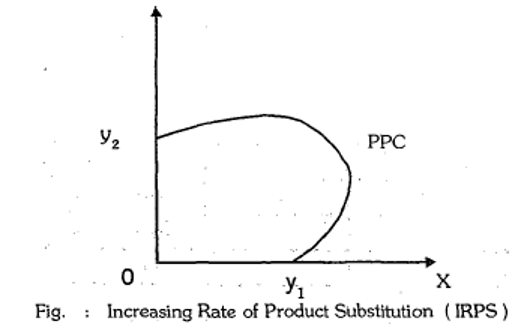
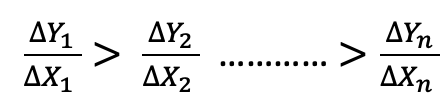
Increasing Rate of Product Substitution (IRPS)
- Each unit increase in the output of one product is accompanied by larger and larger sacrifice (decrease) in the level of production of other product.
- Increasing rates of substitution holds true when the production for each independent commodity is one of decreasing resource productivity (decreasing returns) and non-homogeneity in quality of limited resource.
- The production Possibility Curve is concave to the origin when product substitutes at the increasing rate. Increasing rate of the product substitution is common in agricultural production. The general pattern of production is diversification i.e., profits are maximized by producing both the products.
- (∆Y_1)/(∆X_1 )< (∆Y_2)/(∆X_2 ) ………… <(∆Y_n)/(∆X_n )
- E.g. the substitution between Rice & Maize.
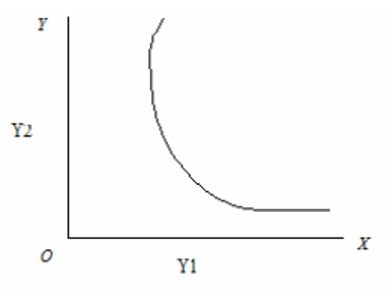
Decreasing Rate of Product Substitution (DRPS)
- Each unit increase in the output of one product is accompanied lesser and lesser decrease in the production of another product.
- This type of product substitution holds good under conditions of increasing returns.
- Production Possibility Curve is convex to the origin when products substitute at decreasing rate.
Iso - Revenue Line
- It represents all possible combination of two products which would yield an equal (same)
revenue or income. - Iso-revenue line is also called iso-return line or iso-income line. This line is to be drawn on the basis of Py2 /Py1.
- Py2/Py1 is a price line but here price indicates the price of the product/output. Therefore, it is called iso-revenue line.
Characteristics
- Iso-revenue line is a straight line because product prices do not change with quantity sold.
- As the total revenue increases, the iso-revenue line moves away from the origin since the total revenue determines the distance of it from the origin.
- The slope indicates ratio of product (output) prices. As long as product prices remaining constant, the iso-revenue line showing different total revenues are parallel. But change in either price will change the slope.
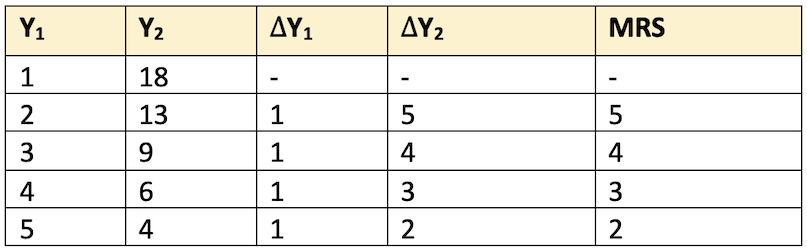
There are three methods to get optimum combination of the two products viz. tabular, arithmetic calculation method and graphic method.
i) Tabular Method
Py1 = Rs 7/- per kg for Y1; Py2 = Rs 10/- per kg for Y2
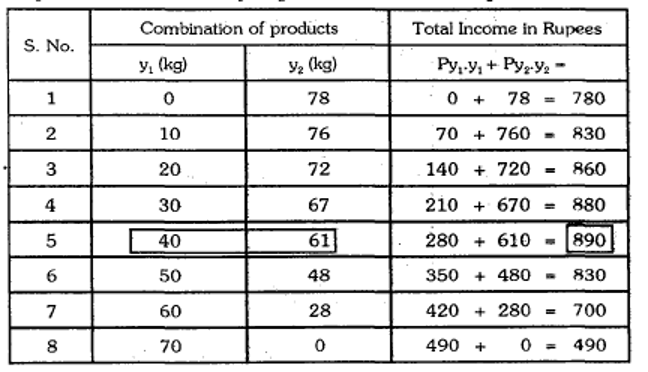
From the above table, it is obvious that 5th combination is the optimum to get highest retum/income.
ii) Algebraic Method
There are three steps to determine the optimum product combination through algebraic method.
a) Compute Marginal Rate of Product Substitution
- MRPS = (Number of units of replaced product )/(Number of units of
addedproduct )
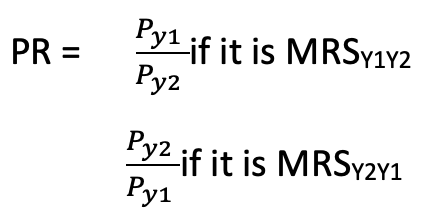
b) Workout price ratio (PR)
- Price Ratio (PR) = (Price per unit of
addedproduct )/(Price per unit ofreplacedproduct )
c) Optimum combination of enterprises is at where MRS = PR

- ⭐️ For profit maximization, a rational producer should operate in the range where two products are competitive and within the range, the choice of products should depend upon the MRS and PR.
iii) Graphic method:
- Draw production possibility curve and iso-revenue line on one graph.
- Slope of production possibility curve indicates MRPS and the slope of iso-revenue line indicates price ratio of products.
- The point of optimum combination of products is at where the iso-revenue line is tangent to the production possibility curve. At this point, slope of the iso-revenue line and the slope of the production possibility curve will be the same.
- In other words, the
MRPS = PR.
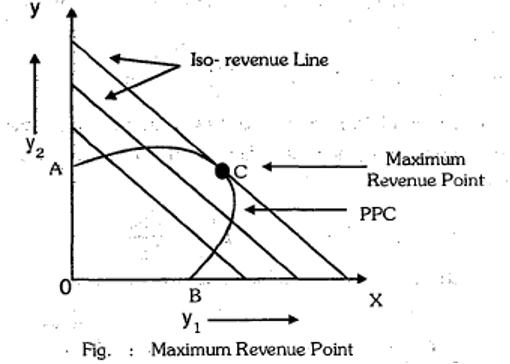
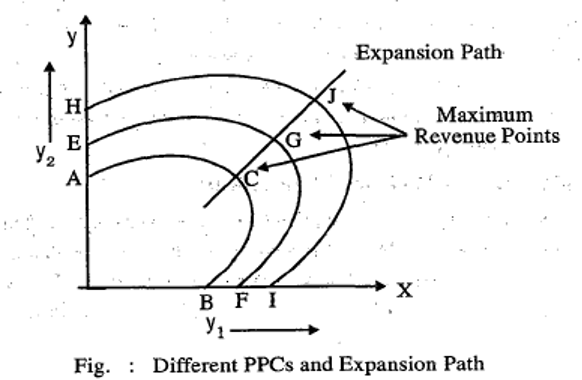
- In the graph, point ‘C’ is the maximum revenue point where Iso-revenue line is lastly tangent to PPC, just opposite to find out least cost point.
- Here Expansion path is the path or locus passing through the different maximum revenue points of the different production possibility curves. The points of tangency specify the most profitable enterprise combination for different possibility curves with the prices indicated by iso-revenue line.
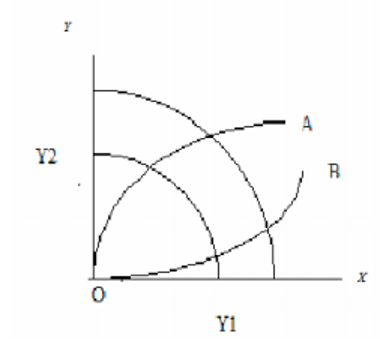
- Ridge lines or border lines Line OA intersects each production possibility curve where the production possibility curve is horizontal. Line OB intersects each production possibility curve where it is vertical.
- The portions of production possibility curve falling within the ridge lines have negative slope indicating competition (MRS < 0).
- Portions of production possibility curve outside ridge line have positive slope indicating Complementarity (MRS > 0).
- On the ridge lines MRS is zero. Therefore, ridge lines are used to separate ranges of product competition from ranges of product complementarity.
👉🏻 When the price of the product is increased, the farmer has to produce the product Y1 more in place of Y2. There may be three forms or conditions on the basis of marginal rate of product substitution (MRPS):
ΔY1 . Py1 > ΔY PY2or
- ΔY1/ΔY2 > Px2/Px1
- In such condition, the farmer has to produce the product Y1 more in place of Y2.
ΔY1 . Py1 < ΔY PY2or
- ΔY1/ΔY2 < Px2/Px1
- In such condition, the farmer has to shift on to produce the product Y2 more in place of Y1 because after producing Y2 more he will get more revenue.
ΔY1 . Py1 = ΔY PY2or
- ΔY1/ΔY2 = Px2/Px1
- In such condition, to produce both the products is equally profitable. It means the farmer may either produce Y1 or Y2 which gives equal return.
- Product-Product relation deals with resource allocation among competing enterprises.
- The goal of Product-Product relationship is
profit maximization. - Under Product-Product relationship,
inputs are kept constantwhile products (outputs) are varied. - This relationship guides the producer in deciding
What to produce. - This relationship is explained by the
principle of product substitutionandlaw of equi-marginal returns. - This relationship is concerned with the determination of optimum combination of products (enterprises).
- The choice indicators are
substitution ratioandprice ratio. - Algebraically it is expressed as
Y1 = f (Y2, Y3, ……. Yn)
Production Possibility Curve (PPC)
- Production Possibility Curve is a convenient device for depicting two production functions on a single graph. …
Become Successful With AgriDots
Learn the essential skills for getting a seat in the Exam with
🦄 You are a pro member!
Only use this page if purchasing a gift or enterprise account
Plan
- Unlimited access to PRO courses
- Quizzes with hand-picked meme prizes
- Invite to private Discord chat
- Free Sticker emailed
Lifetime
- All PRO-tier benefits
- Single payment, lifetime access
- 4,200 bonus xp points
- Next Level
T-shirt shipped worldwide

Yo! You just found a 20% discount using 👉 EASTEREGG

High-quality fitted cotton shirt produced by Next Level Apparel