🙋🏼 Demand Concepts
Learn Basics of Demand
Demand
Meaning of Demand
- Demand in economics means a desire to possess a good supported by willingness and ability to pay for it. If you have a desire to buy a certain commodity, say, a tractor, but do not have the adequate means to pay for it, it will simply be a wish, a desire or a want and not demand. Demand is an effective desire, i.e., a desire which is backed by willingness and ability to pay for a commodity in order to obtain it.
- In the words, “Demand means the various quantities of a good that would be purchased per unit of time at different prices in a given market”.
- There are thus three main characteristics of demand in economics.
- Willingness and ability to pay. Demand is the amount of a commodity for which a consumer has the willingness and also the ability to buy.
- Demand is always at a price. If we talk of demand without reference to price, it will be meaningless. The consumer must know both the price and the commodity. He will then be able to tell the quantity demanded by him.
- Demand is always per unit of time. The time may be a day, a week, a month, or a year.
Individual’s Demand for a Commodity
- The individual’s demand for a commodity is the amount of a commodity which the consumer is willing to purchase at any given price over a specified period of time.
- The individual’s demand for a commodity varies inversely with price ceteris paribus.
- As the price of a good rises, other things remaining the same, the quantity demanded decreases and as the price falls, the quantity demanded increases.
- Price (p) is here an independent variable and quantity (q) dependent variable.
The Market Demand for a Commodity
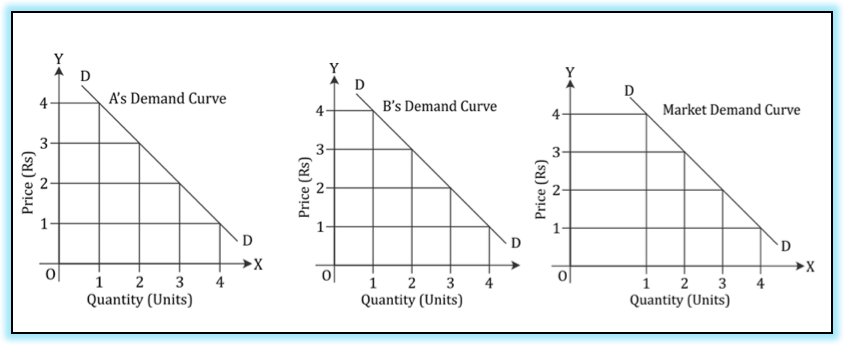
- The market demand for a commodity is obtained by adding up the total quantity demanded at various prices by all the individuals over a specified period of time in the market. It is described as the horizontal summation of the individuals’ demand for a commodity at various possible prices in market.
- In a market, there are a number of buyers for a commodity at each price. In order to avoid a lengthy addition process, we assume here that there are only four buyers for a commodity who purchase different amounts of the commodity at each price. The horizontal summation of individuals’ demand for a commodity will be the market demand for a commodity as is illustrated in the following schedule:
Demand Schedule
Demand schedule is a tabular representation of the quantity demanded of a commodity at various prices. For instance, there are four buyers of apples in the market, namely A, B, C and D.
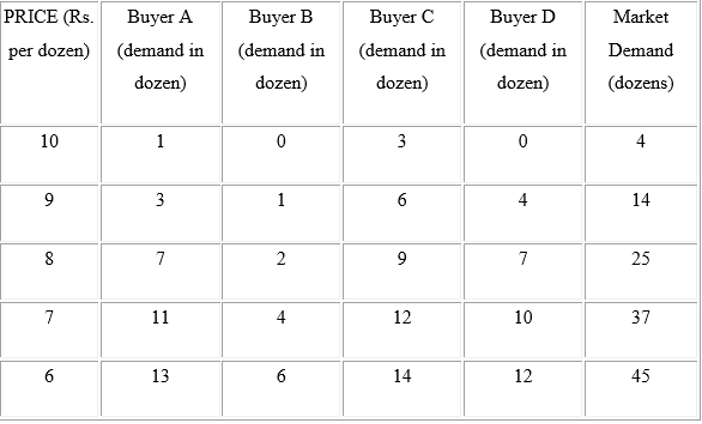
The demand by buyers A, B, C and D are individual demands. Total demand by the four buyers is market demand. Therefore, the total market demand is derived by summing up the quantity demanded of a commodity by all buyers at each price.
Demand Curve
Demand curve is a diagrammatic representation of demand schedule. It is a graphical representation of price-quantity relationship. Individual demand curve shows the highest price which an individual is willing to pay for different quantities of the commodity. While, each point on the market demand curve depicts the maximum quantity of the commodity which all consumers taken together would be willing to buy at each level of price, under given demand conditions.
Derived demand
Derived demand refers to demand for goods which are needed for further production. It is the demand for producer’s goods like industrial raw material, machine tools and equipment.
Autonomous demand
Autonomous demand is independent of the other product or main product. It’s not linked or tie-up with the other goods or commodity. Eg: food articles, clothes.
Price Demand
It refers to various quantities of a good or service that a consumer would be willing to purchase at all possible prices in a given market at a given point in time, ceteris paribus.
Income Demand
It refers to various quantities of a good or service that a consumer would be willing to purchase at different levels of income, ceteris paribus.
Cross Demand
- It refers to various quantities of a good or service that a consumer would be willing to purchase not due to changes in the price of the commodity under consideration but due to changes in the price of related commodity.
- For example: Demand for tea is more not because price of tea has fallen but because price of coffee has risen. Thus, demand for substitutes take the form of cross demand.
Law of Demand
- The law of demand states that as price increases (decreases) consumers will purchase less (more) of the specific commodity.
- Demand varies inversely with price.
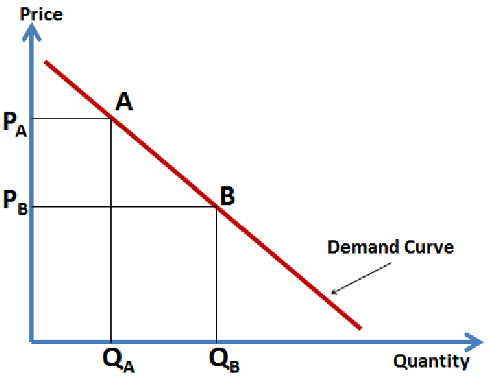
- As price falls from PA to PB the quantity demanded increases from QA to QB. This is a negative relation between price and quantity, hence the negative slope of the demand schedule; as predicted by the law of demand.
- Demand curve has a negative slope, i.e. it slopes downwards from left to right depicting that with increase in price, quantity demanded falls and vice versa.
- The reasons for a downward sloping demand curve can be explained as follows:
Income effect
With the fall in price of a commodity, the purchasing power of consumer increases. Thus, he can buy same quantity of commodity with less money or he can purchase greater quantities of same commodity with same money. Similarly, if the price of a commodity rises, it is equivalent to decrease in income of the consumer as now he has to spend more for buying the same quantity as before. This change in purchasing power due to price change is known as income effect.
Substitution effect
When price of a commodity falls, it becomes relatively cheaper compared to other commodities whose prices have not changed. Thus, the consumers tend to consume more of the commodity whose price has fallen, i.e. they tend to substitute that commodity for other commodities which have now become relatively dear.
Law of diminishing marginal utility
It is the basic cause of the law of demand. The law of diminishing marginal utility states that as an individual consumes more and more units of a commodity, the utility derived from it goes on decreasing. So as to get maximum satisfaction, an individual purchases in such a manner that the marginal utility of the commodity is equal to the price of the commodity. When the price of commodity falls, a rational consumer purchases more so as to equate the marginal utility and the price level. Thus, if a consumer wants to purchase larger quantities, then the price must be lowered. This is what the law of demand also states.
Changes in demand for a Commodity
- Movement along the demand curve (Extension and Contraction) and
- Shifts of the demand curve (Increase and Decrease)
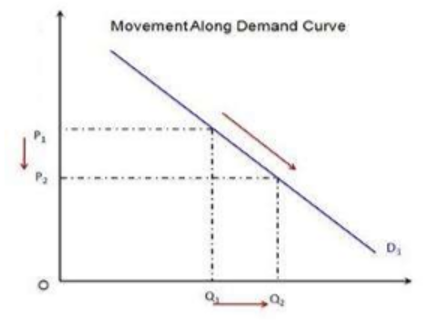
Movement along the Demand Curve
Demand is a multivariable function. If income and other determinants of demand such as tastes of the consumers, changes in prices of related goods, income distribution etc. remain constant and there is a change only in price of the commodity, then we move along the same demand curve. In this case, the demand curve remains unchanged. When, as a result of change in price, the quantity demanded increases or decreases, it is technically called extension and contraction in demand. A movement along a demand curve is defined as a change in the quantity demanded due to changes in the price of a good will result in a movement along the demand curve. For instance, a fall in the price of apples from P1 to P2 causes an increase in the quantity demanded from Q1 to Q2.
Shifts in the demand curve
- A shift of the demand curve is referred to as a change in demand due any factor
other than price. A demand curve will shift if any of these occurs:- Change in the price of other goods (complements and substitutes); leading to increase / decrease of real income
- Change in the income level
- Change in consumers’ tastes and preferences
- Each of these factors tends the demand curve to shift downwards to the left or upwards to the right. While downward shift signifies decrease in demand, an upward shift of the demand curve shows an increase in the demand. As shown in the figure the demand curve will shift to D2 from D1 and accordingly the price and quantity demanded will change.
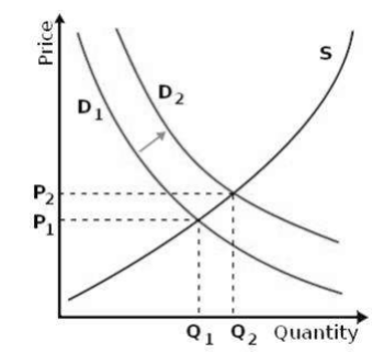
⭐️ Movements along a demand curve is the result of increase or decrease of the price of the goods, while the demand curve shifts when any demand determinant other than price changes.
Determinants of demand
👉🏻 Various factors affect the quantity demanded by a consumer of a good or service. The key determinants of demand are as follows:
- Price of the good: This is the most important determinant of demand. The relationship between price of the good and quantity demanded is generally inverse as we will see later while studying law of demand.
- Price of related goods:
- Substitutes: If the price of a substitute goes down than the quantity demanded of the good also goes down and vice versa.
- Complementary goods: If the price of gasoline goes up the quantity demanded of automobiles will go down. Thus, the price of complements has an inverse relationship with the demand of a good.
- Income: Higher the income of the consumer the more will be quantity demanded of the good. The only exception to this will be
inferior goodswhose demand decreases with an increase in income level. - Individual tastes and preferences: a preference for a particular good may affect the consumer’s choice and he / she may continue to demand the same even in rising prices scenario.
- Expectations about future prices & income: If the consumer expects prices to rise in future, he / she may continue to demand higher quantities even in a rising price scenario and vice versa.
Exceptions to the law of demand
Unlike other laws, law of demand also has few exceptions i.e. there is no inverse relationship between price and quantity demanded for these goods. Few of them are as follows:
Giffen goods: These are those inferior goods whose quantity demanded decreases with decrease in price of the good. This can be explained using the concept of income effect and substitution effect.Giffen’s paradox: This refers to a commodity whose demand varies directly with price.- Commodities which are regarded as status symbols: Expensive commodities like jewelry, AC, cars, etc., are used to define status and to display one’s wealth. These goods don’t follow the law of demand and quantity demanded increases with price rise as more expensive these goods become; more will be their worth as a status symbol.
- Expectation of change in the price of the goods in future: if a consumer expects the price of a good to increase in future, it may start accumulating greater amount of the goods for future consumption even at the presently increased price. The same holds true vice versa.
Elasticity of Demand
The elasticity of demand measures the responsiveness of quantity demanded to a change in any one of the above factors by keeping other factors constant.
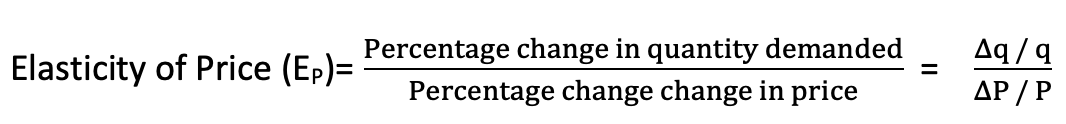
Price Elasticity of Demand
- The concept of price elasticity of demand is commonly used in economic literature. Price elasticity of demand is the degree of responsiveness of quantity demanded of a good to a
change in its price. - Precisely, it is defined as the ratio of proportionate change in the quantity demanded of a good caused by a given proportionate change in price. The formula for measuring price elasticity of demand is:
Income Elasticity of Demand
Income elasticity of demand can be defined as the ratio of percentage change in the quantity of a good purchased, per unit of time to a percentage change in the income of a consumer.
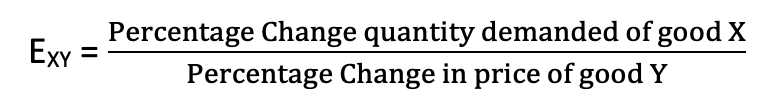
Cross Elasticity of Demand
Cross elasticity of demand is defined as the percentage change in the demand of one good as a result of the percentage change in the price of another good. The formula for measuring cross elasticity of demand is:
Methods of Estimation of Elasticity
Point elasticity
- When elasticity is computed at a particular point on the demand curve then it is known as point elasticity.
Arc elasticity
- When elasticity is computed between two points on demand curve than it is called Arc elasticity.
Degrees of Price Elasticity Demand
Perfectly inelastic demand
- When the quantity demanded of a good does not change at all to whatever change in price, the demand is said to be perfectly inelastic or the elasticity of demand is zero i.e.
E = 0. - Demand curve is
vertical line.
Perfectly elastic demand
- A perfectly elastic demand curve is a
horizontal linewhich indicates that the quantity demanded is extremely (infinitely) responsive to price. Even a slight rise in price drops the quantity demanded of a good to zero. - This elasticity of demand as such is equal to infinity i.e.
E = ∞.
Unitary elastic demand
- When the quantity demanded of a good change by exactly the same percentage as price, the demand is said to be unitary elastic i.e.
E = 1.
Relatively elastic demand
- If a given proportionate change in price causes
relatively a greater proportionate changein quantity demanded of a good, the demand is said to be relatively elastic. - The elasticity of a good here is more than 1 or more than unity i.e.
E > 1.
Relatively Inelastic demand
- When a given proportionate change in price causes a
relatively less proportionate changein quantity demand, demand is said to be inelastic. - The elasticity of a good here is less than 1 or less than unity i.e.
0 < E < 1.
Factors Determining Price Elasticity of Demand
- Degree of necessity: If the consumption of the commodity or commodities is essential and necessary, the demand for those commodities is said to be relatively inelastic. In developing countries of the world, the per capita income of the people is generally low. They spend a greater amount of their income on the purchase of necessaries of life such as wheat, milk, cloth etc. They have to purchase these commodities whatever be their price. The demand for goods of necessities is, therefore, less elastic or inelastic. The demand for luxury goods, on the other hand is greatly elastic whose consumption can be postponed. For example, refrigerators, televisions etc.
- Availability of substitutes. If a good has greater number of close substitutes available in the market, the demand for the good will be greatly elastic. For examples, if the price of Coca Cola rises in the market, people will switch over to the consumption of Pepsi Cola which is its close cheaper substitute. So, the demand for Coca Cola is elastic.
- Proportion of the income spent on the good: If the proportion of income spent on the purchase of a good is very small, the demand for such a good will be
inelastic. For example, if the price of a box of matches or salt rises by 50%, it will not affect the consumers’ demand for these goods. The demand for salt, match box therefore will be inelastic. On the other hand, if the price of a car rises from Rs.6 lakh to Rs.9 lakh and it takes a greater portion of the income of the consumers, its demand would fall. The demand for car is, therefore, elastic. - Time: The period of time plays an important role in shaping the demand curve. In the short run, when the consumption of a good cannot be postponed, its demand will be less elastic. In the long run if the rise price persists, people will find out methods to reduce the consumption of goods. For example: if the price of electricity goes up, it is very difficult to cut back its consumption in the short run than in the long run by adoption of available alternatives.
- Number of uses of a good. If a good can be put to a number of uses, its demand is
more elastic(Ep > 1). For example, if the price of coal falls, its quantity demanded will rise considerably because demand will be coming from households, industries, railways etc.
Practical Importance of Elasticity of Demand
- Importance in taxation policy: The concept has immense importance in the sphere of government finance. When a finance minister levies a tax on a certain commodity, he has to see whether the demand for that commodity is elastic or inelastic. If the demand is inelastic, he can increase the tax and thus can collect larger revenue. Ex. Tobacco etc.
- Price discrimination by monopolist: If the monopolist finds that the demand for his commodities is inelastic, he will at once fix the price at a higher level in order to maximize his net profit. In case of elastic demand, he will lower the price in order to increase, his sales and derive the maximum net profit.
- Importance to businessmen: When the demand of a good is elastic, they increase sale by lowering its price. In case the demand is inelastic, they charge higher price for a commodity.
- Help to trade unions. The trade unions can raise the wages of the labor in an industry where the demand of the product is relatively inelastic. Ex. Strike of Doctors. On the other hand, if the demand, for product is relatively elastic, the trade unions cannot press for higher wages.
- Use in international trade: The terms of trade between two countries are based on the elasticity of demand of the traded goods.
- Determination of rate of foreign exchange: The rate of foreign exchange is also considered on the elasticity of imports and exports of a country.
- Guideline to the producers: The concept of elasticity provides a guideline to the producers for the amount to be spent on advertisement. If the demand for a commodity is
elastic, the producers shall have to spend large sums of money on advertisements for increasing the sales. - Use in factor pricing: The factors of production which have inelastic demand can obtain a higher price in the market then those which have elastic demand. This concept explains the reason of variation in factor pricing.
Supply
Meaning of Supply
- It is the amount of a commodity that sellers are able and willing to offer for sale at different prices per unit of time.
- In the words of Meyer “Supply is a schedule of the amount of a good that would be offered for sale at all possible prices at any period of time; e.g., a day, a week, and so on”.
Difference/Distinction between Supply and Stock
Supplyrefers to that quantity of the commodity which is actually brought into the market for sale at a given price per unit of time.- While
Stockis meant the total quantity of a commodity this exists in a market and can be offered for sale at a short notice. - The supply and stock of a commodity in the market may or may not be equal. If the commodity is
perishable,like vegetables, fruits, fish, etc. then the supply and stock are generally thesame. - But in case if a producer finds that the price of his product is low as compared to its cost of production, he tries to withhold the entire or a part of a stock. In case of a favorable price, the producer may dispose of large quantities or the entire stock of his commodity; it will all depend upon his own valuation of the commodity at that particular time.
Market Supply
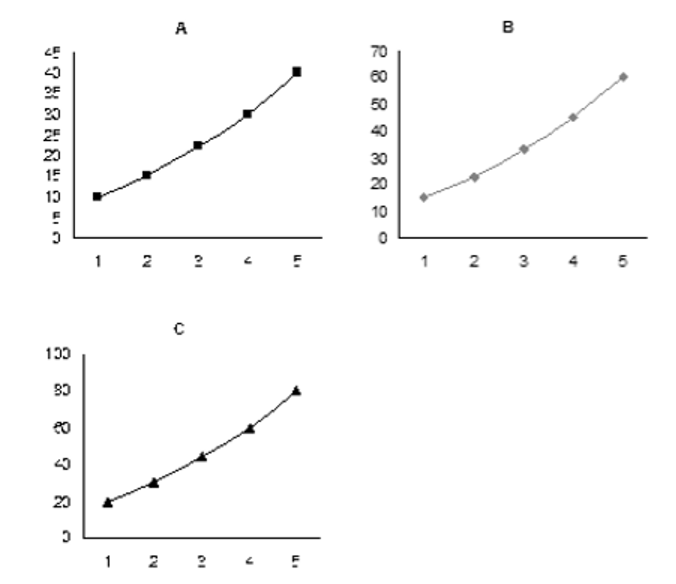
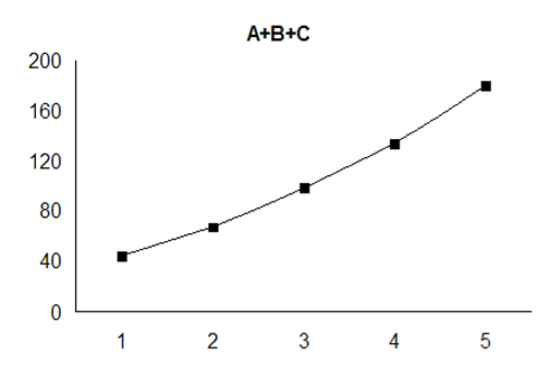
Consider the supply schedule below:
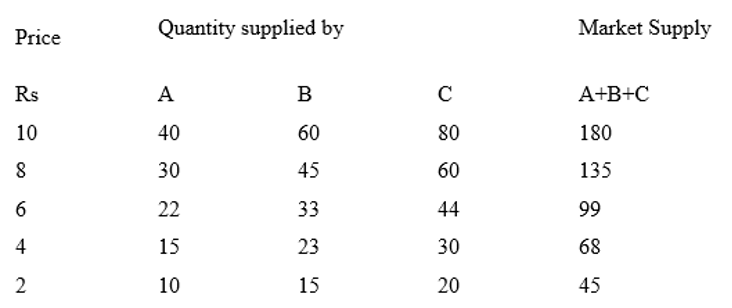
We can see in the above table, the supply schedule of three producers A, B and C for various price levels. As seen in the table above the supply of goods decreases as the price of the goods fall. Now consider that the market consists of only these three suppliers, so the market supply will be the sum of the goods supplied at various price levels all other things remaining same. The same is depicted using the charts below. The first three charts show the individual supply curve of A, B and C as per the supply schedule above, while the chart below that depicts the market supply curve i.e. the aggregate supply of A, B and C.
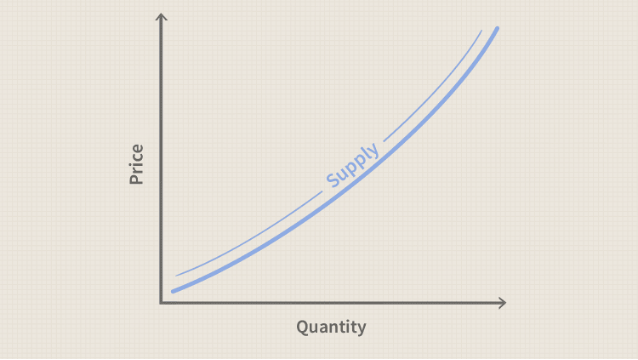
Law of Supply
- The law of supply states that the quantity of a good offered or willing to offer by the producer/owners for sale
increase with the increase in the market priceof the good and falls if the market price decreases, all other things remaining unchanged. - An increase in price will increase the incentive to supply which means that supply curves will
slope upwards from left to right. Supply curves can be curves or straight lines. - Consider the supply of labour as in the figure below:
Determinants of Supply
Price of the product
- Since the producer always aims for maximising his returns/profit, so the quantity supplied changes with increase or decrease in the price of the good.
Technological changes
- Advanced technology can yield more quantity and at lesser costs. This may result in the producer to be willing to supply more quantity of the goods.
Resource supplies and production costs
- Changes in production costs like wage costs, raw material cost and energy costs might impact the producers’ production and eventually the supply.
- An increase in such cost might result in lesser quantities produced and thus lesser quantities supplied and vice versa.
Tax or subsidy
- Since the producer aims to minimize costs and expand profit, an increase in tax will increase the total cost, thereby decreasing the supply. Similarly, a subsidy might incentivize the producer to supply more of that goods in order to maximize his profits.
- Tax and subsidy are two important tools used by central government to control supplies of certain goods.
- For example, an increase in tax can be used to reduce the supply of cigarettes, while increase in subsidy can be used to increase the supply of fertilizers.
Expectations of prices in future
- An expectation that the prices of goods will fall in future might lead to lessen the production by the producer and thereby decrease the supply and vice-versa.
Price of other goods
- A producer might have several options to produce. Since the money to invest is limited with the producer he would decide to produce the good which offers him the maximum profit.
- Thus, if the producer is currently producing good A and the price of good B increases than he might switch to producing good B as this would result in better returns for him.
Number of producers in the market
- This is a very important factor or determinant of supply. If there are large number of producers or sellers in the market willing to sell goods then the supply of good will increase and vice versa.
Movement along the Supply curve (Extension and contraction)
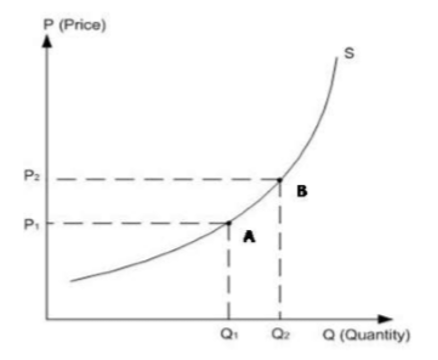
- Movement along the supply curve happens due to
change in the price of the goodand resulting change in the quantity supplied at that price. - For instance, an increase in the price of the good from P1 to P2 in the figure below results in an increase of quantity supplied of the good from Q1 to Q2. This movement from point A to point B on the supply curve S due to change in price of the good all other factors of supply remaining unchanged is called movement along the supply curve.
Shifts in the Supply curve
- Shift in the supply curve is also sometimes referred as a
change in supply. This happens due to changes in factors of supply other than that of price of the good. - For example, if the price of a factor or of a related good increase the supply curve shifts. Similarly changes in technology and government tools like tax and subsidy tends to shift supply curve.
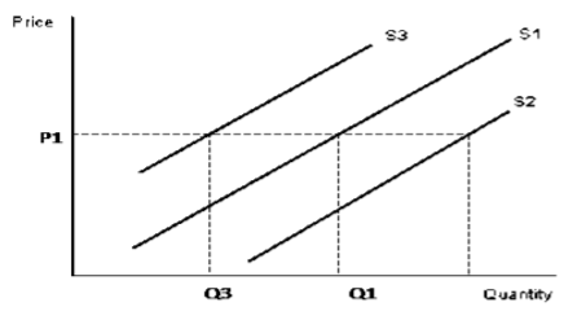
The supply curve can shift to the right or left as shown in the figure. A shift towards the right i.e. from S1 to S2 curve denotes an increase in supply of the good. Similarly, a shift in the supply curve from S1 to S3 denotes a decrease in supply of the good. As seen in the figure above a rightward shift in the supply curve from S1 to S2 increases supply from Q1 to Q2 while the price of the good remains same at P1. Similarly, a leftward shift from S1 to S3 decreases supply from Q1 to Q3 whilst the price remaining unchanged at P1.
Factors affecting changes in Supply
- Changes in Factor Prices: If the prices of the various factors of production fall down, it will result in lowering the cost of production and so an increase in the supply on varying prices.
- Changes in Technique: If an improvement in technique takes place in a particular industry, it will help in reducing its cost of production. This will result in greater production and so an increase in the supply of the commodity. The supply curve will shift to the right of the original supply curve.
- Improvement in the Means of Transport: The supply of the commodity may also increase due to improvement in the means of communication and transport. If the means of transport are cheap and fast, then supply of the commodity can be increased at a short notice at lower price.
- Climatic Changes in case of Agricultural Products: The supply of agricultural products is directly affected by the weather conditions and the use of the better methods of production. If rain is timely, plentiful, well-distributed and improved methods of cultivation are employed then other things remaining the same, there will be bumper crop. It would then be possible to increase the supply of the agricultural products.
- Political Changes: The increase or decrease in supply may also take place due to political disturbances in a country. If country wages wars against another country or some kind of political disturbances take place just as we had at the time of partition, then the channels of production are disorganized. It results in the decrease of certain goods the supply curve shifts to the left of originals curve.
- Taxation Policy: If a government levies heavy taxes on the import of particular commodities, then the supply of these commodities is reduced at each price. The supply curve shifts to the left, conversely, if the taxes on output in the country are low and government encourages the import of foreign commodities, then the supply can be increased easily. The supply curve shifts to the right of original supply curve.
- Goals of firms. If the firms expect higher profits in the future, they will take the risk and produce goods on large scale resulting in larger supply of the commodities. The supply curve shifts to the right.
Determinants of Price Elasticity of Supply
- Time period. Time is the most significant factor which affects the elasticity of supply. If the price of a commodity rises and the producers have enough time to make adjustment in the level of output, the elasticity of supply will be
more elastic. If the time period is short and the supply cannot be expanded after a price increase, the supply is relatively inelastic. - Ability to store output. The goods which can be safely stored have relatively elastic supply over the goods which are perishable and do not have storage facilities.
- Factor mobility. If the factors of production can be easily moved from one use to another, it will affect elasticity of supply. The higher the mobility of factors, the
greater is the elasticityof supply of the good and vice versa. - Changes in marginal cost of production. If with the expansion of output, marginal cost increases and marginal return declines, the price elasticity of supply will be less elastic to that extent.
- Excess supply. When there is excess capacity and the producer can increase output easily to take advantage of the rising prices, the supply is more elastic. In case the production is already up to the maximum from the existing resources, the rising prices will not affect supply in the short period. The supply will be more inelastic.
- Availability of infrastructure facilities. If infrastructure facilities are available for expanding output of a particular good in response to the rise in prices, the elasticity of supply will be relatively more elastic.
- Agricultural or industrial products. In agriculture, time is required to increase output in response to rise in prices of goods. The supply of agricultural goods is
fairly inelastic. As regards the supply of manufactured consumer goods, it is comparatively easy to increase production in a short period. Therefore, the supply of consumer goods is fairly more elastic; In case of supply of aero planes or any other heavy machinery, the supply isrelatively inelasticas it takes time to manufacture heavy machinery.
Demand
Meaning of Demand
- Demand in economics means a desire to possess a good supported by willingness and ability to pay for it. If you have a desire to buy a certain commodity, say, a tractor, but do not have the adequate means to pay for it, it will simply be a wish, a desire or a want and not demand. Demand is an effective desire, i.e., a desire which is backed by willingness and ability to pay for a commodity in order to obtain it.
- In the words, “Demand means the various quantities of a good that would be purchased per unit of time at different prices in a given market”.
- There are thus three main characteristics of demand in economics.
- Willingness and ability to pay. Demand is the amount of a commodity for which a consumer has the willingness and also the ability to buy. …
Become Successful With AgriDots
Learn the essential skills for getting a seat in the Exam with
🦄 You are a pro member!
Only use this page if purchasing a gift or enterprise account
Plan
- Unlimited access to PRO courses
- Quizzes with hand-picked meme prizes
- Invite to private Discord chat
- Free Sticker emailed
Lifetime
- All PRO-tier benefits
- Single payment, lifetime access
- 4,200 bonus xp points
- Next Level
T-shirt shipped worldwide

Yo! You just found a 20% discount using 👉 EASTEREGG

High-quality fitted cotton shirt produced by Next Level Apparel