📊 Production Scenario
Current Agricultural Scenario of India & World, Data related to Area, Production, Productivity of Filed Crops
Agricultural Scenario of India
- India has
2.4 %of worlds’ geographical area, 18 % population, 15% livestock population, 2% forest and 1% rain of the world. - India has arable land approximately
52 %of total land area. - Per capita arable land availability is less than 0.3 ha (
0.12 haWorld Bank 2016). - Agriculture plays a vital role in India’s economy.
54.6 %of the total workforce is engaged in agricultural and allied sector activities (Census 2011) and accounts for17.8 %of the country’s Gross Value Added (GVA) for the year 2019-20 (at current prices). - As per Land Use Statistics 2016-17, India’s total geographical area is
328.7 million hectares, of which139.4 million hectaresis net sown area (42.4 %of the total geographical area) and200.2 million hectaresis the gross cropped area with a cropping intensity of143.6 %. {CI = GCA/NCA *100} - Out 139.4 million ha,
68.6 Mhais irrigated(~ 49 %)and rest70.8 Mhais under rainfed conditions(~51 %). Indian agriculture is characterized byLarge scattered land holdings and Orthodox technology.
Agriculture Gross Value Added (GVA)
- As per the provisional estimates of Annual National Income released by
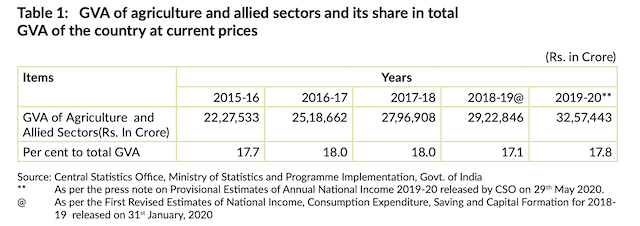
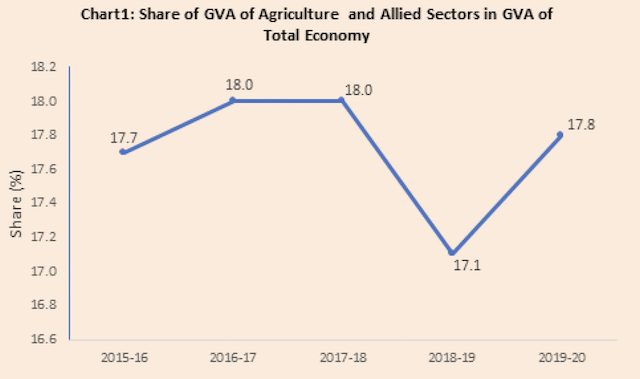
Central Statistics Office (CSO), Ministry of Statistics & Programme Implementation (MoSPI), the agriculture and allied sectors contributed approximately17.8%of India’s GVA at current prices during2019-20, marginally higher than 17.7% in 2015-16. GVA of agriculture and allied sectors and its share in total GVA of the country at current prices during the last 5 years is given in Table.
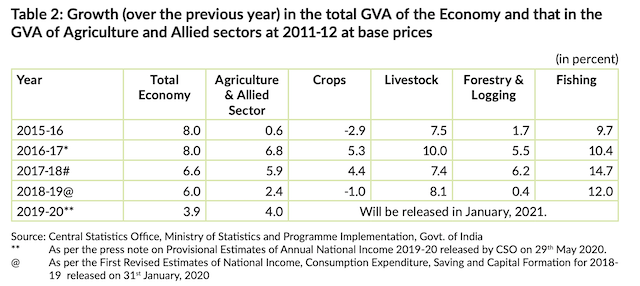
- The Agriculture and Allied Sector witnessed marginal growth of 0.6 per cent in 2015-16 followed by a substantial recovery of 6.8 per cent in 2016-17 that fell by almost a per cent to 5.9 per cent in the following year, 2017-18. 2018-19 witnessed a sharp fall to 2.4 per cent that has since recovered to
4 %in 2019-20 at 2011-12 base price. (Table-2)
- The share of agriculture and allied sectors in GVA of the country has declined from 18.2 per cent in 2014-15 to 17.8 per cent in 2019-20 (Table 3), an inevitable outcome of a development process in which the relative performance of non-agricultural sectors becomes more dominant.
- Within the agriculture sector, the share of crops has fallen from 11.2 per cent in 2014-15 to 9.4 per cent in 2018-19. The decline in the share of crops has been made up by an increase in the share of livestock and fisheries sectors.
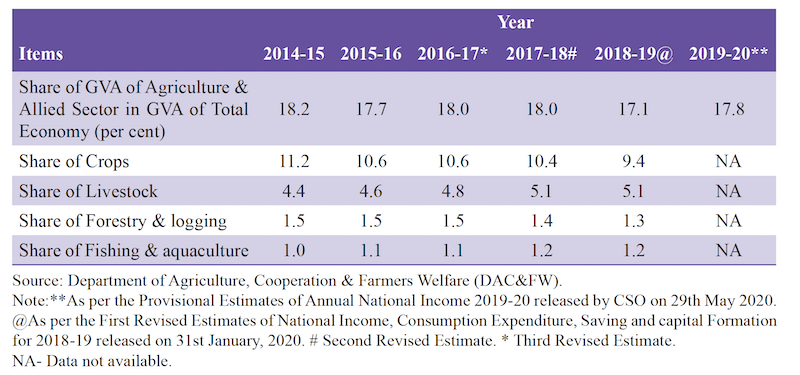
Table 3: Share of Agriculture and Allied Sectors in Total GVA at current prices
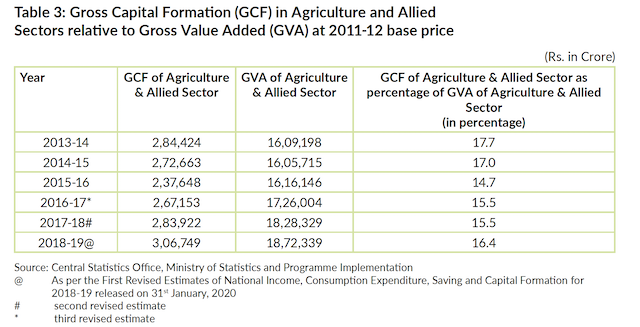
Capital Formation in Agriculture and Allied Sectors
- Gross Capital Formation (GCF) is an indicator of level of investment activity in the sector.
- With respect to GVA in the sector, Gross Capital Formation in the sector has been fluctuating during the last 5 years with a major fall experienced in 2015-16 to 14.7 percent from 17.7 per cent in 2013-14. The indicator has since recovered and has improved to
16.4 per centin 2018-19.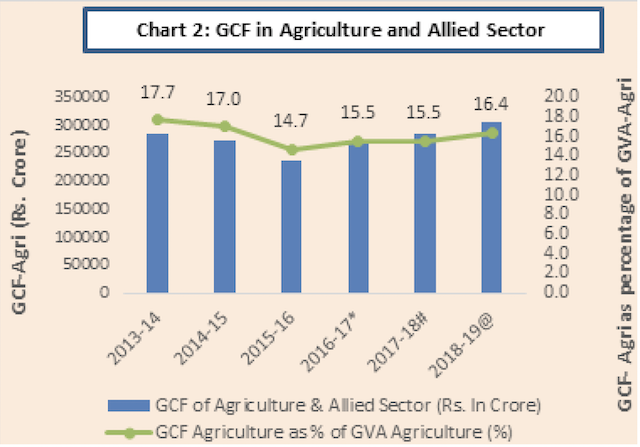
Profile of Agriculture Sector in India
- In 5 states viz. Andhra Pradesh, Arunachal Pradesh, Madhya Pradesh, Nagaland and Tripura, Agriculture and Allied activities contribute more than 30% in State Gross Value Added estimated for 2016-17 (at current prices). (Source: National Statistical Office) Number of operational holdings in the country is estimated at 14.64 Crore. (Agriculture Census 2015-16).
- The percentage share of Agricultural workers in Total workers is
54.6 %. (Registrar General of India). 57.8 %of rural households are engaged in agriculture (Situation Assessment Survey of Agricultural Households, NSO).- The small and marginal holdings taken together (0.00-2.00 ha) constituted
86.08 %of the total land holdings in 2015-16. The all- India average size of holding is 1.08 ha. (Source: Agriculture Census, 2015-16) - Position of women in agricultureo 30.33% of total cultivators and 40.67% of agriculture labour are women.
- Only
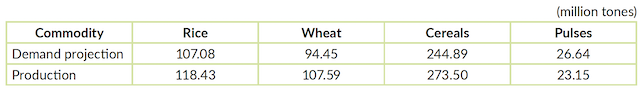
13.95 %of total operational holdings are operated by women. (Source: Agriculture Census, 2015-16) - Demand for foodgrains projected by Niti Aayog (2020-21) and domestic production (4th advance estimates for 2019-20, DES).
Production Scenario 2020-21
Department of Agriculture, Cooperation and Farmers Welfareof Ministry of Agriculture and Farmers’ Welfare Production data of agriculture in4 advance estimatesof agricultural production, which are released in each quarter.- The foodgrain estimates is made based on the inputs from states.
- As per 4th Advance Estimates for 2020-21, total food grain production in the country is estimated at
308.65 million tonnes. The production during 2020-21 is also higher by 29.77 million tonnes than the previous five years’ (2015-16 to 2019-20) average production of food grain and higher by 11.14 million tonnes than the production of foodgrain during 2019-20.
👉🏻 As per 4th Advance Estimates, the estimated production of major crops during 2020-21 is as under:
Foodgrains – 308.65 million tonnes (💥 New Record)
| Crop | Production (in million tonnes) |
|---|---|
| Rice | 122.27 💥 New Record |
| Wheat | 109.52 💥 New Record |
| Nutri / Coarse Cereals | 51.15 |
| Maize | 31.51 💥 New Record |
Pulses – 25.72 million tonnes (💥 New Record)
| Crop | Production (in million tonnes) |
|---|---|
| Tur | 4.28 million tonnes |
| Gram | 11.99 million tonnes (💥 New Record) |
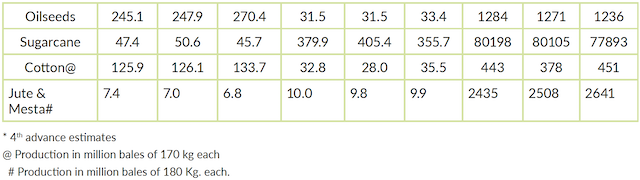
Oilseeds – 36.10 million tonnes (💥 New Record)
| Crop | Production (in million tonnes) |
|---|---|
| Groundnut | 10.21 million tonnes (💥 New Record) |
| Soyabean | 12.90 million tonnes |
| Rapeseed and Mustard | 10.11 million tonnes (💥 New Record) |
Sugarcane – 399.25 million tonnes
Cotton – 35.38 million bales (of 170 kg each)
Jute & Mesta – 9.56 million bales (of 180 kg each)
👉🏻 Among Pulses the crop with highest production and largest area under cultivation in India is - Chick pea. 👉🏻 Among Oil seeds the crop with highest production and largest area under cultivation in India is – Soyabean.
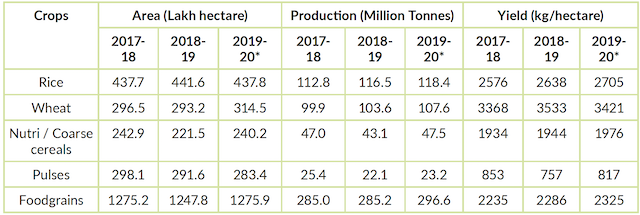
Have a look at the below table and get some idea about area and productivity of major crops.
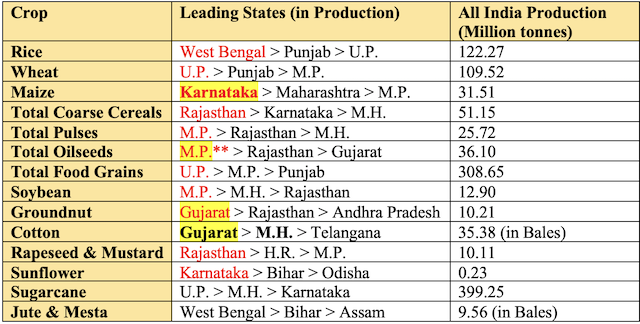
Leading States in Production
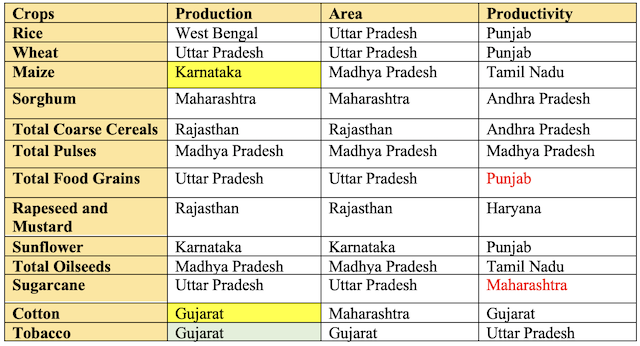
Leading States in Area, Production and Productivity
Land Utilization in India
In India out of total sown ara 74 % area is under food crops. Where as only 8.61 % of total sown area is under horticultural crops.
Sourse: Annual Report MoAFW 2017-18
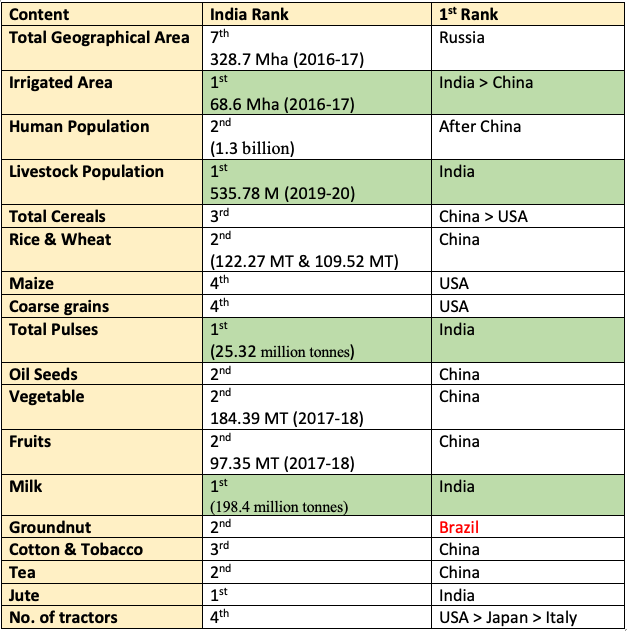
India’s Position in World Agriculture
Agricultural Scenario of India
- India has
2.4 %of worlds’ geographical area, 18 % population, 15% livestock population, 2% forest and 1% rain of the world. - India has arable land approximately
52 %of total land area. - Per capita arable land availability is less than 0.3 ha (
0.12 haWorld Bank 2016). - Agriculture plays a vital role in India’s economy.
54.6 %of the total workforce is engaged in agricultural and allied sector activities (Census 2011) and accounts for17.8 %of the country’s Gross Value Added (GVA) for the year 2019-20 (at current prices). - As per Land Use Statistics 2016-17, India’s total geographical area is
328.7 million hectares, of which139.4 million hectaresis net sown area (42.4 %of the total geographical area) and200.2 million hectaresis the gross cropped area with …
Become Successful With AgriDots
Learn the essential skills for getting a seat in the Exam with
🦄 You are a pro member!
Only use this page if purchasing a gift or enterprise account
Plan
- Unlimited access to PRO courses
- Quizzes with hand-picked meme prizes
- Invite to private Discord chat
- Free Sticker emailed
Lifetime
- All PRO-tier benefits
- Single payment, lifetime access
- 4,200 bonus xp points
- Next Level
T-shirt shipped worldwide

Yo! You just found a 20% discount using 👉 EASTEREGG
High-quality fitted cotton shirt produced by Next Level Apparel