🌡 Climatic Classification
Classification, Scale of Climate, IMD, Crop weather modeling, Forcasting, Draught.
Classification of Climate
- Climatic classification is done to study the climate systematically, to understand its general pattern and ecological conditions to estimate agricultural potential and to transfer technology.
- There are various classifications put forth by different people.
De Candolewas the first person to attempt the classification of climate around 1900 A.D. His classification is mainlybased on vegetation.Koppen(1884 with modifications done later in 1918 and 1936) was the first person to classify climatebased on weather elements.- Subsequently, about 50 classifications were proposed by different scientists and most of these classifications took precipitation or temperature or both as the important weather elements.
- Among these, the most widely accepted ones were that of Koppen’s and Thornthwaite’s classifications.
- The classification suitable for agricultural purpose was proposed by
Troll(1965).
Basis for Classification of Climate
Evapo-transpiration
- Evapo-transpiration is a term used to refer to two processes combined together i.e. Evaporation of water from the soil surface and transpiration from the plant surface.
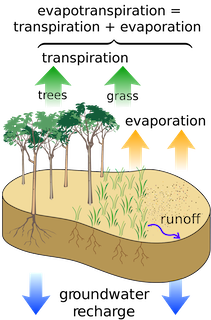
Transpiration
- Transpiration is the process by which moisture is carried through plants from roots to small pores on the underside of leaves, where it changes to vapor and is released to the atmosphere.
- Transpiration is essentially evaporation of water from plant leaves.
- Studies have revealed that about 10 percent of the moisture found in the atmosphere is released by plants through transpiration. The remaining 90 percent is mainly supplied by evaporation from oceans, seas, and other bodies of water (lakes, rivers, streams).
- Plants put down roots into the soil to draw water and nutrients up into the stems and leaves. Some of this water is returned to the air by transpiration.
- Transpiration rates vary widely depending on weather conditions, such as temperature, humidity, sunlight availability and intensity, precipitation, soil type and saturation, wind, land slope, and water use and diversion by people.
- During dry periods, transpiration can contribute to the loss of moisture in the upper soil zone, which can have an effect on vegetation and food-crop fields.
Evaporation
- “The process by which any liquid escapes from the surface into the atmosphere in gaseous states is known as evaporation."
- Evaporation of water from surface or free water surface is a diffusive process by which liquid water in the form of vapour is lost in the atmosphere.
Potential Evapo-Transpiration (PET)
- PET is the demand or maximum amount of water that would be evapotranspired if enough water were available (from precipitation and soil moisture).
- When we talk about Evapo-Transpiration, we are referring to how much water actually is evapotranspired and is limited by the amount of water that is available.
Precipitation
- Precipitation is any type of water that forms in the Earth’s atmosphere and then drops onto the surface of the Earth.
- Water vapor, droplets of water suspended in the air, builds up in the Earth’s atmosphere. Water vapor in the atmosphere is visible as clouds and fog. Water vapor collects with other materials, such as dust, in clouds.
- Precipitation condenses, or forms, around these tiny pieces of material, called cloud condensation nuclei (CCN).
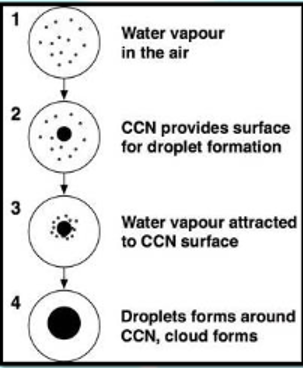
- Clouds eventually get too full of water vapor, and the precipitation turns into a liquid (rain) or a solid (snow).
- Precipitation is part of the water cycle. Precipitation falls to the ground as snow and rain. It eventually evaporates and rises back into the atmosphere as a gas. In clouds, it turns back into liquid or solid water, and it falls to Earth again.
- There can be various forms of precipitation.
Koppen’s Classification
- Koeppen has used certain critical values of
temperaturesof the warmest and the coldest months andrainfallof the wettest and the driest months along with the seasonal distribution of rainfall to divide the climatic regions. - His climatic divisions generally coincide with vegetational divisions, since Koppen considered the
distribution of vegetationto be the best expression of the totality of climate.
Thornthwaite’s Classification
👉🏻 Thornthwaite gave two classifications—one in 1931 and the other in 1948.
1931 Classification
- Like Koppen, Thornthwaite also considered natural vegetation of a region as the indicator of climate of that region.
- He accepted the concept that the amount of precipitation and temperature had paramount control on vegetation but he also pleaded for inclusion of evaporation as important factor of vegetation and climate.
- That is why Thornthwaite used two factors, viz.
precipitation effectivenessandtemperature effectiveness, for the delimitation of boundaries of different climatic regions.
Precipitation Effectiveness
- Precipitation effectiveness or precipitation efficiency refers to only that amount of total precipitation which is
availablefor the growth of vegetation. He used precipitation efficiency ratio for the calculation of this amount of water available to vegetation. - Precipitation efficiency ratio (P/E ratio) is calculated by dividing total monthly precipitation by monthly evaporation and precipitation efficiency index (P/E index) is derived by summing the precipitation efficiency ratios for 12 months of a year.
Temperature Effectiveness
- On the basis of the temperature effectiveness index, Thornthwaite divided the world into 6 temperature provinces.
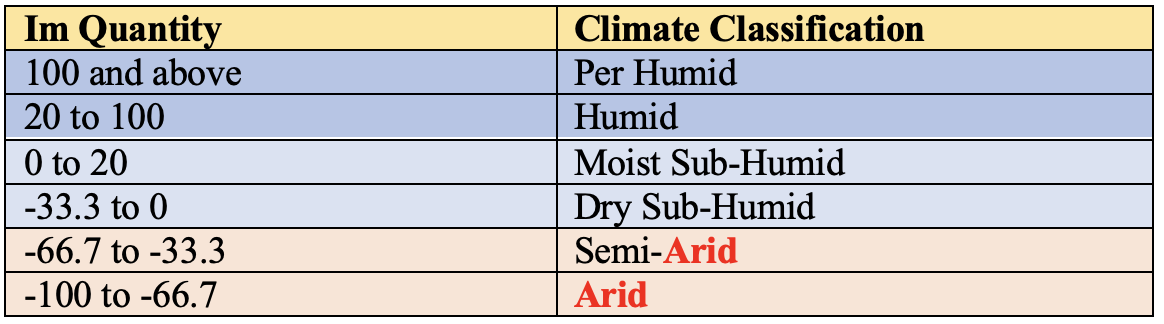
1948 Classification
- Thornthwaite’s 1948 classification used two factors viz.
Potential EvapotranspirationandPrecipitation. - It was further modified by Mathur (1955) and the following formula was derived to calculate the
Moisture Index (Im). - Mouisture Index (Im) = 100 x [(P-PE)/PE]
- Where P = Precipitation, PE = Potential evapo-transpiration.
Now using the Moisture Index (Im), the following classification was made:
Troll Classification
- Troll (1965) proposed a classification called the
seasonal climates of the earthutilizing monthly rainfall and potential evapotranspiration. - It is based on very sound physical principles and parameters like temperature, radiation, wind, speed, vapour pressure, duration of sunshine and albedo which are mainly responsible for loss of water from the surface have been taken into account.
- The importance of Troll’s classification lies on the duration of arid and humid months rather than assignment of climatic boundaries based on annual/monthly values of precipitation, temperature and relative humidity.
- Thus, he came out with a classification of climatic regions based on the
duration humid monthsin a year. - He defined humid month as the month having precipitation more than PET.
The Troll Classification was modified by ICRISAT for India and the classification was brought out based on the number of humid months:
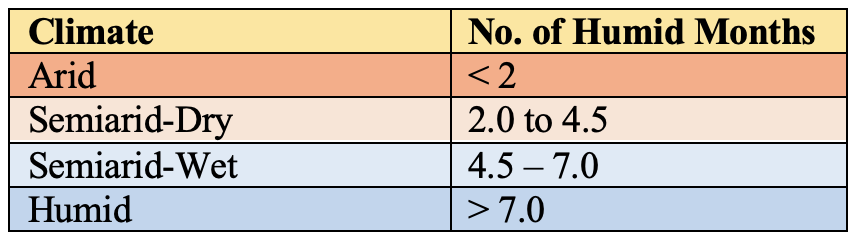
👉🏻 According to modified Troll’s climatic classification, Semi-arid area has higher area in India.
ICAR Classification
- The ICAR under the
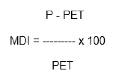
All India Coordinated Research Project on Dryland Agricultureadopted classification based onMoisture Deficit Index (MDI). - The Moisture Deficit Index is calculated using the following formula:
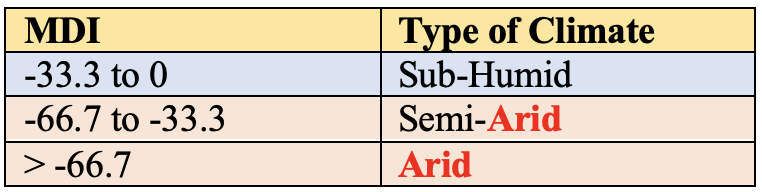
- The types of climate put forth are as follows:
Scales of Climate
What is it and its importance?
- The atmosphere is always in motion.
- Each of its swirls and circulations are known to us by name — a gust of wind, a thunderstorm, or a hurricane - but those names tell us nothing about its size.
- For that, we have weather scales.
- Weather scales group weather phenomena according to their size (the horizontal and vertical distance they span) and how long of a lifespan they have.
- In order from largest to smallest, these scales include the planetary, synoptic (both coming under Macro-climate), mesoscale and micro-climate.
Macro-Climate
Planetary or Global scale
- Planetary, or global scale weather features are the largest and longest-lived. As their name suggests, they generally span tens of thousands of kilometers in size, extending from one end of the globe to another. They last weeks or longer.
- They include the general circulation features, such as the trade winds, prevailing westerlies, Rossby waves and the jet streams, and regions of the atmosphere such as the tropics, the mid-latitudes, the Polar Regions and the ozone layer.
Synoptic scale
- Spanning somewhat smaller, yet still large distances of a
few hundred to several thousand kilometersin breadth; thearea of one continentand may extend from the surface to the lower stratosphere are the synoptic scale weather systems. - This scale covers weather elements such as high and low-pressure systems, air masses and frontal boundaries, tropical cyclones, hurricanes, typhoons, features commonly found on standard weather maps.
- Derived from the Greek word which means “seen together”, synoptic can also mean an overall view.
- Synoptic meteorology, then, deals with viewing a variety of large-scale weather variables over a wide area at a common time. Doing this gives us a comprehensive and nearly instantaneous picture of the state of the atmosphere.
Meso-scale
- If we focus a little closer, we see the mesoscale.
- This scale, also known as the
local scale, covers atmospheric elements from afew kilometres to tens of kilometresin the horizontal dimension and from the surface to the top of the planetary boundary layer, about 1 kilometre in depth. - It includes the coverage of the events like Thunderstorms, Tornadoes, Sea and Land breezes.
- The mesoscale can be thought of as encompassing an area from the size of towns to that of metropolitan regions.
- Mesoscale weather is what you see on the weather maps and forecasts for a specific area, or a
stateorprovince.
Micro-scale
- Finally, if we look really closely, we see the microscale.
- The microscale includes all atmospheric processes
less than a few kilometresin size. This size range can include our backyard or garden, our neighbourhood, or a small lake, hills or wooded area. - It can even be seen in differences within our garden or around the outside of our house or school.
- We don’t think too much about the microscale, but it is the one in which we most intimately live and the one we have some ability to modify.
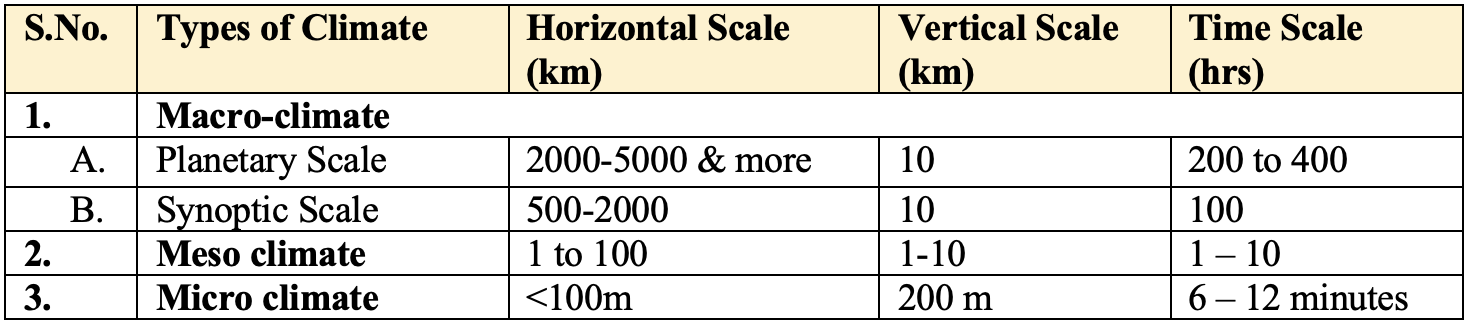
The scales of air motion in different climates are given in the Table below:
Indian Meteorological Department
- The India Meteorological Department (IMD), also referred to as the
Met Department, is an agency of theMinistry of Earth Sciencesof the Government of India. It is the principal agency responsible for meteorological observations, weather forecasting and seismology. - It was established in
1875inPune. - IMD is currently headquartered in
New Delhiand operates hundreds of observation stations across India and Antarctica. - IMD is also one of the six Regional Specialised Meteorological Centres of the World Meteorological Organization (headquartered in Geneva, Switzerland).
Agricultural Meteorology Division (AMD)
- This division was established under IMD at
Punein1932in order to provide direct services to the farming community of the country. - The prime objective is to minimize the impact of adverse weather on crops and to make use of crop-weather relationships to boost agricultural production.
👉🏻 Services of the Division
- Gramin Krishi Mausam Seva (GKMS)
- Dissemination of Agromet advisories
- Feedback & Awareness of Agromet Service
- Training Programme to AMFUs (Agro-Met Field Units)
👉🏻 What are Agrometeorological services?
- All agrometeorological and agroclimatological information that can be directly applied to try to improve and/or protect the livelihood of farmers in agricultural production may be considered to belong to agrometeorological services.
- This improvement/protection applies to yield quantity, quality and income while safeguarding the agricultural resource base from degradation.
- The Agromet Advisory Services provide a very special kind of inputs to the farmers as advisories that can make a tremendous difference to the agriculture production by taking the advantage of benevolent weather and minimize the adverse impact of malevolent weather.
- This has a potential to change the face of any country in terms of food security and poverty alleviation.
- Agrometeorological services rendered by India Meteorological Department (IMD), Ministry of Earth Sciences is a step to contribute to weather information-based crop/livestock management strategies and operations dedicated to enhancing crop production and food security.
Integrated Agro-meteorological Advisory Service (IAAS) program of India:
- India’s Integrated Agro-meteorological Advisory Service (AAS) program is one of the largest agrometeorological information programs in the world.
- The Indian Meteorological Department (IMD) started broadcasting weather services for farmers by radio in 1945.
- Agrometeorological advisories were first initiated in 1976 to provide state level forecast-based advisories to farmers based on short-range weather forecasts issued by the India Meteorological Department (IMD).
- Made available to farmers one day in advance, these advisories were inadequate for planning weather-based agricultural practices and/or undertaking precautionary measures, which required a much longer lead time.
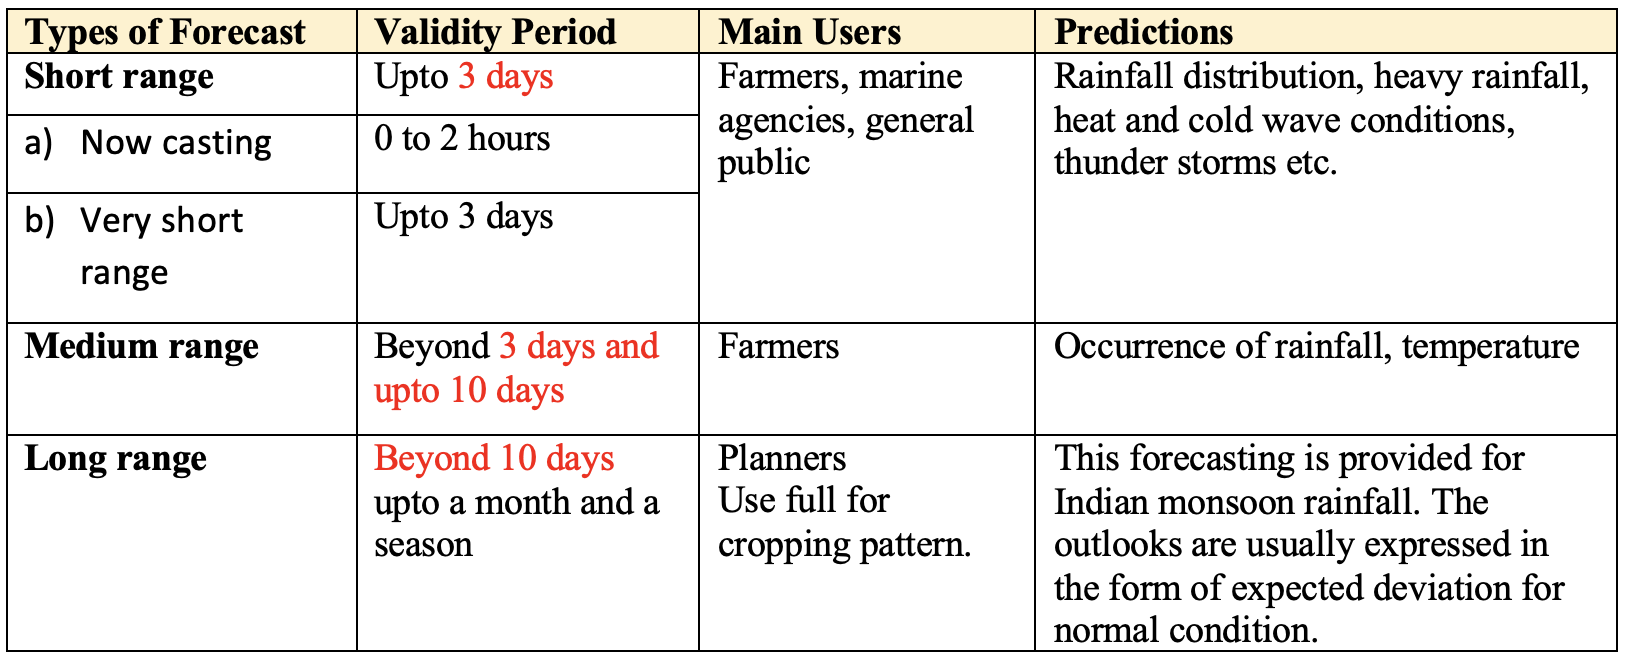
- In agriculture, location-specific weather forecasts in the
medium range (3-10 days in advance)hold greater salience for farmers. - In addition, forecasts issued need to be fine-tuned to the specific requirements of farmers, particularly in recommending activities and modifications to specific farm-level practices.
- Keeping these needs in mind, the
NCMRWF (National Center for Medium-Range Weather Forecasting)was established in1988by the Government of India as a scientific mission to develop operational Numerical Weather Prediction (NWP) models for forecasting weather in the medium range. - To disseminate these forecasts and build forecast-based agricultural advisories,
Agro Meteorological Field Units (AMFUs)were created across the country, in all127 agroclimatic zones. - IMD took over leadership of the AAS in 2007 (IAAS was launched in collaboration with different organizations/institutes/stakeholders on 1st April 2007 for weather-wise farm management) and launched a
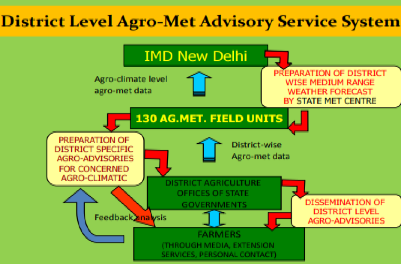
District-level Agrometeorological Advisory Service (DAAS)in 2008, with the aim of providing relevant weather information and management advisoriesat a district scaleacross the country.
District-level Agrometeorological Advisory Service (DAAS)
- DAAS aims to generate district-level agrometeorological advisories based on weather forecasts.
- DAAS continues to be a multi-institutional project involving a variety of stakeholders including the Indian Council of Agricultural Research (ICAR); SAUs; Krishi Vigyan Kendras (KVKs); the Department of Agriculture and Cooperation; State Departments of Agriculture, Horticulture, Animal Husbandry and Forestry; development NGOs and media agencies.
- The program provides meteorological (weather forecasting), agricultural (identifying how weather forecasts affect farming), extension (two-way communication with users) and information dissemination (media, IT and others) services.
- Tailoring information to farmer needs at a district scale is accomplished through multi-institutional teams, or “Agro-Meteorological Field Units” in each of the 127 agro-climatic zones.
👉🏻 How is the weather forecasting done?
- Today, IMD issues quantitative district level
5-day weather forecaststwice a weekusing a Multi-Model Ensemble technique based on forecast products from models available in India and other countries. - Weather forecasts for seven parameters (rainfall, maximum and minimum temperatures, wind speed and direction, relative humidity and cloudiness) as well as weekly cumulative rainfall forecasts are generated.
- These products are disseminated to Regional Meteorological Centres and Meteorological Centres of IMD located in different states.
- Experts in these centres add value to IMD forecast products, which are then communicated to 130 AMFUs located within SAUs, ICAR Institutes, and Indian Institutes of Technology.
- Weather forecast collected over 5 days is sent to all regional met centres of IMD for value addition keeping local synoptic condition and climatology in consideration.
- The value-added forecast is provided to concerned agro-met field units for advisory preparation on every Tuesday and Friday of the week and prepared advisories disseminated to farmers through multi-channel dissemination network.
Crop-Weather Modelling
- It is a representation of a crop through
mathematical equationsexplaining thecrops interactionwith both above ground and below ground environment. - Crop-weather modelling, firstly used by BAIER in 1979, refers to the techniques that can be used to determine the
likely effects of weather on crop, its growth and production. - It is not wrong to say that they are computer programs that mimic the growth and development of crops.
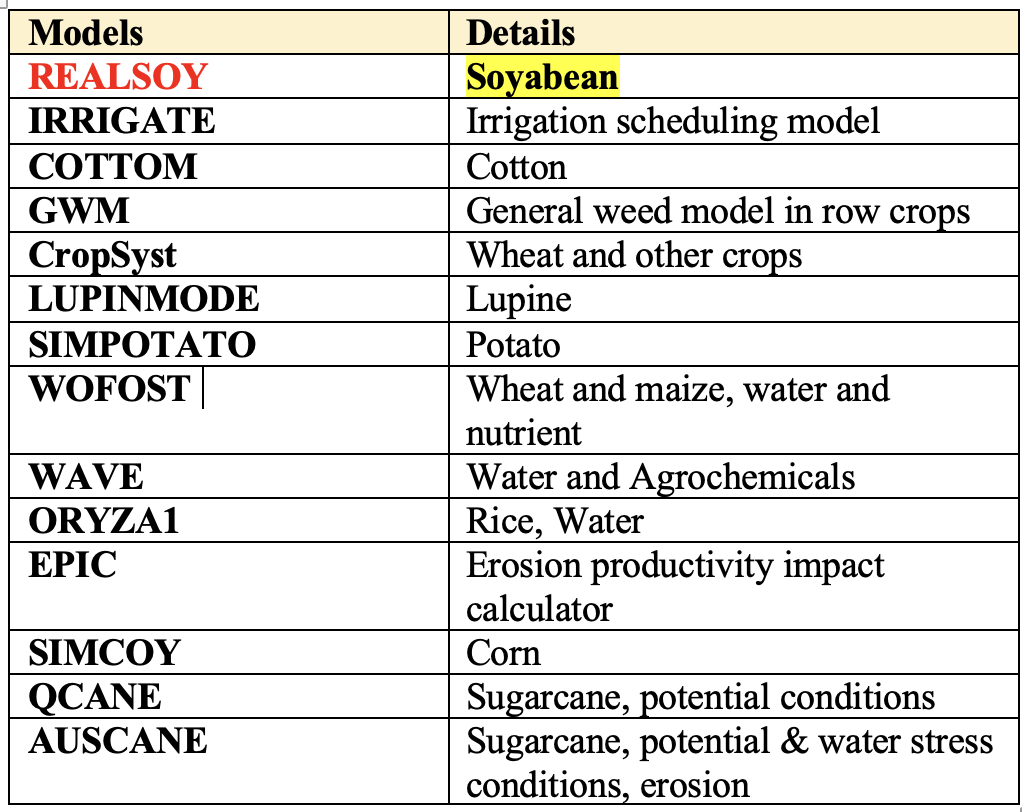
Some important Crop weather models running in India:
- CERES (Crop Environment Resource Synthesis model): It is a series of crop simulation models on crops, e.g. Rice, Maize, Sorghum, Wheat etc. running in different regions of India.
- DSSAT (Decision Support System for Agro technology Transfer): It was used for assessing the impact of climate change on rice and developing adaptation strategies to sustain rice production in western zone of Tamil Nadu.
- PRECIS (Providing Regional Climates for Impacts Studies): PRECIS generates high-resolution climate change information and can be applied in any region of the world.
- InfoCrop-RICE model: Since rice is sensitive to high temperatures, a simulation analysis was carried out to quantify the impact of increased temperatures and elevated CO2 alone and in combination on the yield.
- CROPGRO-Groundnut model was used to quantify the impact of climate change on the productivity of groundnut, running in Anantapur, Mahboobnagar and Junagadh.
Weather Forecasting
👉🏻 It means any advance information about the probable weather in future, which is obtained by evaluating the present and past meteorological conditions of the atmosphere.
Methods of Weather Forcasting
(a) Synoptic Method: Useful for short range forecasting, especially for farmers, irrigation engineers, mariners.
(b) Statistical Method: Useful for short & long range forecasting both.
Types of Weather Forecast
Drought
👉🏻 Drought is the consequence of a natural reduction in the amount of precipitation over an extended period of time, usually a season or more in length, often associated with other climatic factors (viz. high temperatures, high winds and low relative humidity) that can aggravate the severity of the drought event.
Types of Drought
- Metrological Drought
- Hydrological Drought
- Agriculture Drought
- Socio-Economic Drought
Meteorological Drought
- In India, according to India Meteorological Department, meteorological drought over an area is defined as a situation when the seasonal rainfall received over the area is
less than 75%of its long-term average value. - It is further classified as
moderate droughtif the rainfall deficit is between26-50%andsevere droughtwhen thedeficit exceeds 50%of the normal.
Hydrological Drought
- Meteorological drought, if prolonged, results in hydrological drought with
marked depletion of surface waterand consequent drying up of inland water bodies such as lakes, reservoirs, streams and rivers and fall in level of water table.
Agricultural Drought
- A period of
4 consecutive weeksfromMay to Mid-Octoberor6 consecutive weeksduring rest of the year or Yield reduction due to severe soil moisture shortage. - Drought year: Year for which the annual rainfall is less than
≤ 75 per centnormal. - Drought prone area: Area which suffer with severe/moderate drought for ≥ 20 per cent of year.
- Chronic Drought area: Area which suffer with serious/moderate drought for ≥ 40 per cent year.
- Most of the arid and semi-arid regions fall in seasonal drought.
- Widely used index for classification of droughts –
Palmer drought indexgiven byPalmer(USA, 1965)
How does the India Meteorological Department monitor the Agricultural Drought?
- India Meteorological Department (IMD) monitors the incidence, spread, intensification and cessation of drought (near real-time basis) on a weekly time scale over the country based on
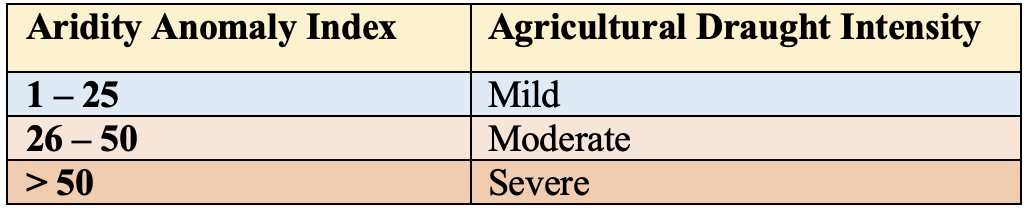
Aridity Anomaly Index (AAI). - It also issues Weekly Drought Outlook, based on this index, which indicates the impending drought scenario in the country in the subsequent week.
- Based on aridity anomaly index, weekly Aridity Anomaly Reports and maps for the Southwest Monsoon Season for the whole country and for the Northeast Monsoon Season for the five meteorological sub-divisions are prepared.
- These Aridity Anomaly maps/reports help to assess the moisture stress experienced by growing plants and to monitor agricultural drought situation in the country.
Aridity Anomaly Index (AAI)
- Aridity is the Thornthwaite’s concept to describe water deficiency experienced by plants.
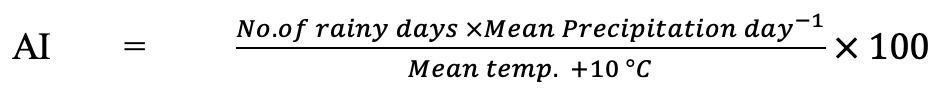
- Thornthwaite gave the following formula for computing aridity index (AI):
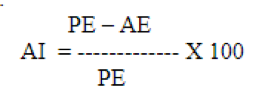
👉🏻 PE denotes the water need of the plants (which is called potential evapotranspiration).
👉🏻 AE denotes the actual evapotranspiration and (PE-AE) denotes the water deficit.
The positive values of the anomalies have been classified into three different classes as follows:
Note: There is another index known as SPI (Standardized Precipitation Index), computation of which is done at a monthly time scale. Kindly note the full form of it.
Moisture Availability Index (MAI)
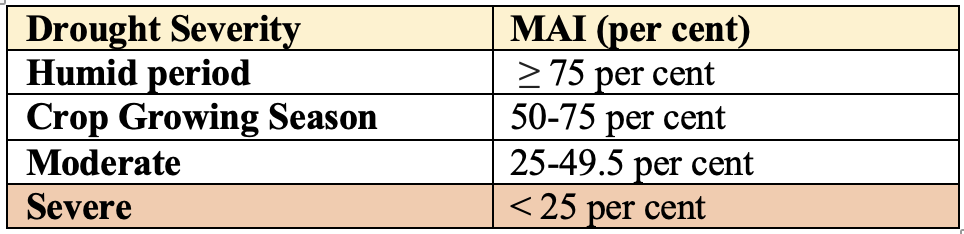
- It is defined as the ratio of assured weekly/monthly rainfall at 50% probability level to potential evapotranspiration of the corresponding period. RRB-SO-2019
- Moisture Availability Index (MAI) = P (At 50% probability)/PET x 100
Moisture Deficit Index (MDI)
- This is used to estimate the dryness of a region,
- MDI = P-PET/PET x 100
- Where, P for precipitation and PET for Potential Evapotranspiration.
Aridity Index (AI)
- A measure of dryness of region.
Thorntwaite Moisture Index (TMI)
- It is the ratio between the actual evapotranspiration and potential evapotranspiration.
NADAMS
👉🏻 National Agricultural Drought Assessment and Monitoring System, established by NRSA, Dehradun.
NRSA
👉🏻 National Remote Sensing Agency, Hyderabad
NDVI
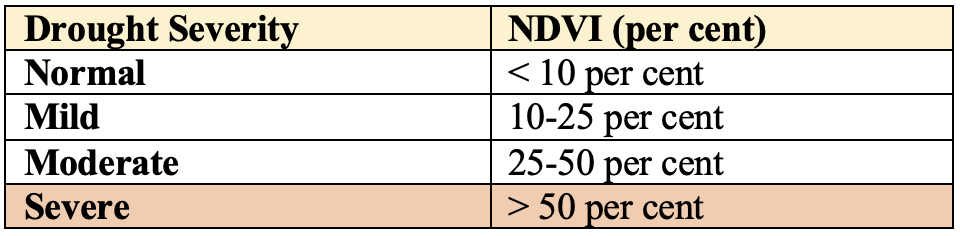
👉🏻 Normalized Deviation Vegetation Index, used for determining drought severity.
Classification of Drought Severity According to NDVI and MAI per cent
Classification of Climate
- Climatic classification is done to study the climate systematically, to understand its general pattern and ecological conditions to estimate agricultural potential and to transfer technology.
- There are various classifications put forth by different people.
De Candolewas the first person to attempt the classification of climate around 1900 A.D. His classification is mainlybased on vegetation.Koppen(1884 with modifications done later in 1918 and 1936) was the first person to classify climatebased on weather elements.- Subsequently, about 50 classifications were proposed by different scientists and most of these classifications took precipitation or temperature or both as the important weather elements.
- Among these, the most widely accepted ones were that of …
Become Successful With AgriDots
Learn the essential skills for getting a seat in the Exam with
🦄 You are a pro member!
Only use this page if purchasing a gift or enterprise account
Plan
- Unlimited access to PRO courses
- Quizzes with hand-picked meme prizes
- Invite to private Discord chat
- Free Sticker emailed
Lifetime
- All PRO-tier benefits
- Single payment, lifetime access
- 4,200 bonus xp points
- Next Level
T-shirt shipped worldwide

Yo! You just found a 20% discount using 👉 EASTEREGG

High-quality fitted cotton shirt produced by Next Level Apparel