💹 India's Agricultural Trade
Agricultural exports and imports, trade surplus, top export commodities, Agricultural Export Policy, and Agri-Export Zones with exam-oriented tables
From Farm to Foreign Markets
India is the world's largest producer of spices, second-largest producer of rice and wheat, and a major exporter of marine products. Yet, when a shrimp farmer in Andhra Pradesh sends his harvest to the USA or a basmati rice grower in Haryana exports to Iran, they are part of a trade system that contributes only about 2-3% of global agricultural trade. Understanding India's agricultural trade — what we export, where, and the policies driving growth — is essential for competitive exams.
India's Position in Global Agricultural Trade
| Parameter | Value (2017-18) |
|---|---|
| Share in world agricultural exports | 2.27% |
| Share in world agricultural imports | 1.90% |
| Agricultural exports as % of agricultural GDP | 9% |
| Agricultural imports as % of agricultural GDP | 5.47% |
| Agricultural exports as % of total exports | 12.80% |
| Total agricultural export value | US$ 38.74 billion |
| Total agricultural import value | US$ 20.35 billion |
| Trade balance | Surplus (exports > imports) |
TIP
Pro Content Locked
Upgrade to Pro to access this lesson and all other premium content.
₹99 charged monthly · Cancel anytime
- All Agriculture & Banking Courses
- AI Lesson Questions (100/day)
- AI Doubt Solver (50/day)
- Glows & Grows Feedback (30/day)
- AI Section Quiz (20/day)
- 22-Language Translation (100/day)
- Recall Questions (20/day)
- AI Quiz (15/day)
- AI Quiz Paper Analysis (100/day)
- AI Step-by-Step Explanations (100/day)
- Spaced Repetition Recall (FSRS)
- AI Tutor
- Immersive Text Questions
- Audio Lessons — Hindi & English
- Mock Tests & Previous Year Papers
- Summary & Mind Maps
- XP, Levels, Leaderboard & Badges
- Generate New Classrooms
- Voice AI Teacher (AgriDots Live)
- AI Revision Assistant
- Knowledge Gap Analysis
- Interactive Revision (LangGraph)
🔒 Secure via Razorpay · Cancel anytime · No hidden fees
From Farm to Foreign Markets
India is the world's largest producer of spices, second-largest producer of rice and wheat, and a major exporter of marine products. Yet, when a shrimp farmer in Andhra Pradesh sends his harvest to the USA or a basmati rice grower in Haryana exports to Iran, they are part of a trade system that contributes only about 2-3% of global agricultural trade. Understanding India's agricultural trade — what we export, where, and the policies driving growth — is essential for competitive exams.
India's Position in Global Agricultural Trade
| Parameter | Value (2017-18) |
|---|---|
| Share in world agricultural exports | 2.27% |
| Share in world agricultural imports | 1.90% |
| Agricultural exports as % of agricultural GDP | 9% |
| Agricultural imports as % of agricultural GDP | 5.47% |
| Agricultural exports as % of total exports | 12.80% |
| Total agricultural export value | US$ 38.74 billion |
| Total agricultural import value | US$ 20.35 billion |
| Trade balance | Surplus (exports > imports) |
TIP
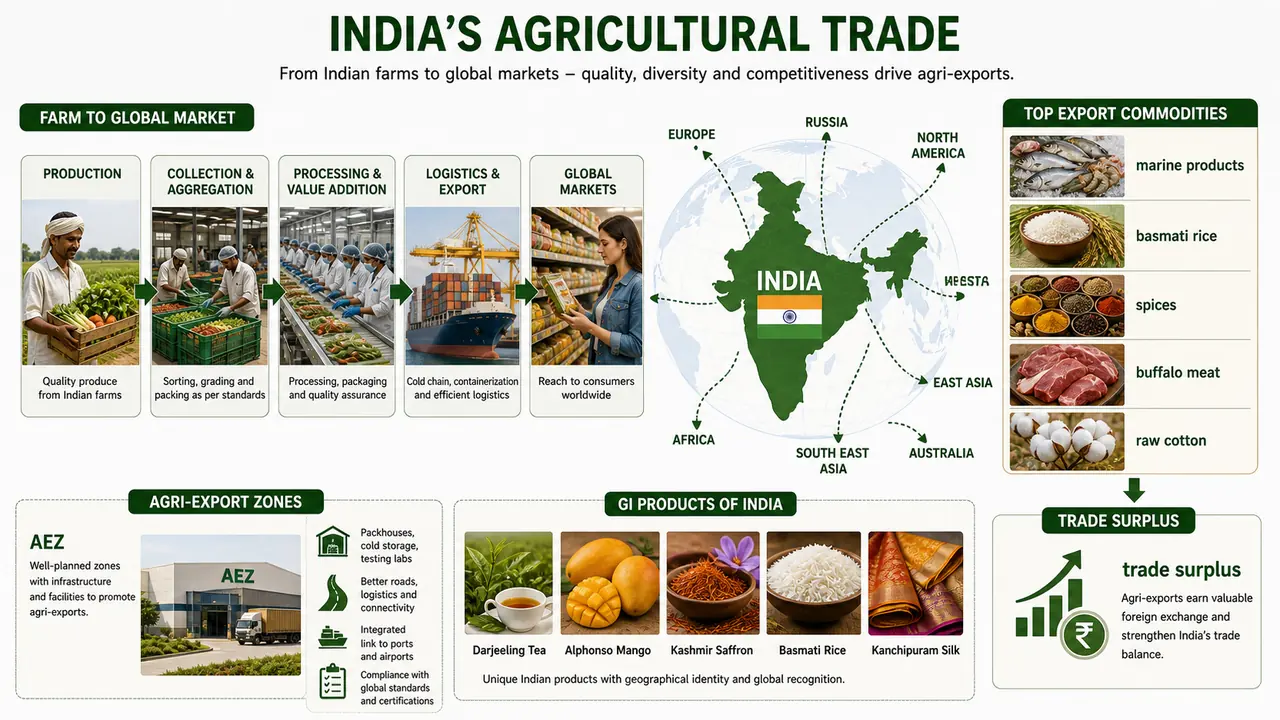
India consistently maintains a trade surplus in agriculture (exports exceed imports). This strengthens foreign exchange reserves. The surplus was about US$ 18 billion in 2017-18.
Top Export Destinations and Commodities
Highest Export Destinations (in order)
USA > Vietnam > Iran > China > UAE
Top Agricultural Exports by Value (2018-19)
| Rank | Commodity |
|---|---|
| 1 | Marine Products (shrimp, fish) |
| 2 | Rice — Basmati |
| 3 | Buffalo Meat |
| 4 | Spices |
| 5 | Rice — Non-Basmati |
| 6 | Raw Cotton |
Agricultural Insight: India's export strength lies in marine products, rice, meat, and spices — commodities where India has both a production advantage and strong global demand. Basmati rice and spices benefit from India's unique agro-climatic conditions.
Detailed Export Basket
Top 10 Agricultural Commodities — Exports
| No. | Commodity | 2015-16 | 2016-17 | 2017-18 |
|---|---|---|---|---|
| 1 | Rice-basmati | 22719 | 21604 | 26841 |
| 2 | Rice (other than basmati) | 15583 | 17145 | 22927 |
| 3 | Spices | 16630 | 19442 | 20014 |
| 4 | Cotton raw | 12821 | 10982 | 12156 |
| 5 | Oil meals | 3599 | 5371 | 6969 |
| 6 | Coffee | 5125 | 5668 | 6245 |
| 7 | Cashew nut | 5028 | 5303 | 5945 |
| 8 | Sugar | 9825 | 8678 | 5229 |
| 9 | Fresh vegetables | 5237 | 5772 | 4997 |
| 10 | Groundnut | 4075 | 5454 | 3384 |
| Total Agriculture commodities export | 215396 | 227554 | 550173 |
Detailed Import Basket
Top 10 Agricultural Commodities — Imports
| No. | Commodity | 2015-16 | 2016-17 | 2017-18 |
|---|---|---|---|---|
| 1 | Vegetable Oils | 68677 | 73047 | 74996 |
| 2 | Pulses | 25619 | 28523 | 18748 |
| 3 | Fresh Fruits | 11072 | 11241 | 12525 |
| 4 | Cashew nut | 3701 | 9027 | 9134 |
| 5 | Spices | 5400 | 5758 | 6377 |
| 6 | Cotton raw | 2566 | 6337 | 6306 |
| 7 | Sugar | 4038 | 6868 | 6036 |
| 8 | Wheat | 873 | 8509 | 2358 |
| 9 | Misc. processed items | 1811 | 2116 | 2238 |
| 10 | Cocoa products | 1399 | 1540 | 1472 |
| Total Agriculture commodities export | 140311 | 164680 | 152061 |
Agricultural Export Policy
- Government set an overall target of increasing agri and allied exports to US$ 60 billion by 2022
- A new Agricultural Export Policy was unveiled for the first time in India's history during 2017-18
IMPORTANT
The Agricultural Export Policy of 2017-18 was India's first-ever dedicated policy for agricultural exports. This is a landmark fact for exams.
Key Objectives of the Export Policy
| Objective | Agricultural Example |
|---|---|
| Diversify the export basket | Move beyond rice and spices to processed foods and organic products |
| Promote value-added exports | Exporting mango pulp instead of raw mangoes |
| Improve institutional framework | Streamline certifications (FSSAI, APEDA, phytosanitary) |
| Create export-ready supply chains | Cold chain from farm to port for grapes and pomegranates |
| Boost farmer income through global market access | Connecting differentiated products to premium international buyers |
Why the Export Policy Matters
The export policy is not just about selling more abroad. It tries to connect production clusters, quality certification, logistics, and market access so that Indian farmers can move from raw commodity sales toward higher-value and more stable export earnings.
Agri-Export Zones (AEZs)
AEZs are designated geographical areas where all stakeholders — farmers, processors, exporters, and government agencies — work together to develop and export specific agricultural products.
| Feature | Detail |
|---|---|
| Concept | Promote agricultural exports by concentrating resources in specific zones |
| Identified By | State Governments |
| Services | Comprehensive package from state agencies, agricultural universities, and central institutions |
| Goal | Create export-ready supply chains that give farmers better prices and market linkages |
Agricultural Example: An AEZ for Alphonso mangoes in Ratnagiri (Maharashtra) brings together mango growers, processing units, cold chain operators, APEDA certification, and export agencies — creating a seamless pipeline from orchard to international supermarket shelf.
| Crop | State |
|---|---|
| Medicinal Plant | Kerala |
| Medicinal & Aromatic Plants | Uttarakhand |
| Pineapple | West Bengal & Tripura |
| Darjeeling Tea | West Bengal |
| Rose Onion and Vanilla | Karnataka |
| Grape & Grapevine and Pomegranate | Maharashtra |
| Chilli, Mango Pulp | Andhra Pradesh |
| Walnut | Jammu & Kashmir |
| Seed Spices, Wheat, Lentil and Grams | Madhya Pradesh |
| Cut Flowers, Cashewnut | Tamil Nadu |
| Honey | Bihar |
| Value Added Onion, Sesame Seeds | Gujarat |
| Turmeric and Ginger | Odisha |
| Ginger | Sikkim, Assam |
| Fresh and Processed Ginger | Assam |
| Coriander and Cumin | Rajasthan |
Exam Tips and Mnemonics
| Topic | Tip |
|---|---|
| Trade Balance | India has a surplus in agricultural trade — exports > imports |
| Top Export | Marine products rank #1 by value — not rice, not spices |
| Export Destinations | "USA Leads" — USA > Vietnam > Iran > China > UAE |
| Export Policy | 2017-18 = India's first-ever agricultural export policy |
| AEZs | Identified by state governments, not central government |
| Export Target | US$ 60 billion by 2022 (aspirational target) |
Summary Cheat Sheet
| Concept / Topic | Key Details / Explanation |
|---|---|
| India's share in world agri exports | 2.27% (2017-18) |
| India's share in world agri imports | 1.90% (2017-18) |
| Agri exports value | US$ 38.74 billion (2017-18) |
| Agri imports value | US$ 20.35 billion (2017-18) |
| Trade balance | Surplus — exports exceed imports by ~US$ 18 billion |
| Agri exports as % of total exports | 12.80% |
| Agri exports as % of agri GDP | 9% |
| Top export destinations (order) | USA > Vietnam > Iran > China > UAE |
| Top export commodity (#1 by value) | Marine Products (shrimp, fish) — NOT rice or spices |
| Top exports (order) | Marine Products → Basmati Rice → Buffalo Meat → Spices → Non-Basmati Rice → Raw Cotton |
| Agricultural Export Policy | India's first-ever dedicated agri export policy; unveiled 2017-18 |
| Export target | US$ 60 billion by 2022 (aspirational) |
| Export Policy objectives | Diversify basket, promote value-added exports, improve institutional framework, create export-ready supply chains |
| Agri-Export Zones (AEZs) | Designated geographic areas for specific export commodities; identified by State Governments |
| AEZ concept | Concentrates farmers, processors, exporters, agencies for seamless export pipeline |