🏛 SECC 2026
Socio-Economic and Caste Census notes with BPL criteria, 14-5-7 methodology, deprivation indicators, rural findings, welfare targeting, and exam traps.
In the previous lesson, we analysed the 10th Agricultural Census -- India's agrarian structure, land fragmentation, and holding patterns. While the agricultural census captures land and farming data, it does not capture the socio-economic and caste dimensions of rural India. That gap is filled by the Socio-Economic and Caste Census (SECC) 2011 -- a landmark household-level exercise for poverty, deprivation, welfare targeting, and caste enumeration.[1][2]
This lesson covers:
- Background -- why SECC was needed beyond the regular census
- Methodology -- Hashim Committee's three-tier BPL classification
- 14 automatic exclusion parameters and 5 automatic inclusion parameters
- 7 deprivation indicators for grading remaining households
- Key findings -- rural poverty, landlessness, income, and literacy data
- Criticism and way forward
SECC data is frequently tested in UPSC, IBPS AFO, NABARD, and state-level exams, especially the numerical thresholds, three-step targeting method, and the difference between households considered for deprivation and households actually reporting at least one deprivation.
IMPORTANT
Source discipline: this lesson is a dedicated SECC 2011 page. Rural socio-economic figures are cited to the official PIB/Ministry release dated 3 July 2015. Later government replies also clarify that the public finalized SECC data excludes caste data and is used in schemes such as PMAY-G, DAY-NRLM, and PMUY.[1][3]
Socio-Economic Caste Census (SECC) 2011
- SECC-2011 was first caste based census of Independent India began on 29 June 2011 from the Sankhola village of Hazemara block in West Tripura District. Earlier, caste based data was collected in 1931 census. This was a historic exercise as it was the first time since independence that caste-wise data was systematically collected across the country.
- The Manmohan Singh government approved the Socio Economic and Caste Census 2011 to be carried out after discussion in both houses of Parliament in 2010.
- Information on caste was last collected during the British Raj in 1931. This means there was a gap of 80 years before caste data was collected again, during which India's social and economic landscape had transformed dramatically.
- Government released provisional rural socio-economic results of SECC-2011 in July 2015.[1]
-
SECC-2011 was also India's first paperless census conducted on handheld devices. The official release states that enumeration used more than 6.4 lakh electronic handheld devices and covered all 640 districts.[1] This makes SECC data a key administrative tool for identifying beneficiaries across major welfare programmes.
-
SECC 2011 data became a major input for targeted welfare delivery. Government replies cite its use in Pradhan Mantri Awaas Yojana-Gramin (PMAY-G), Deendayal Antyodaya Yojana-NRLM, Pradhan Mantri Ujjwala Yojana, and urban welfare programme design.[3][4]
-
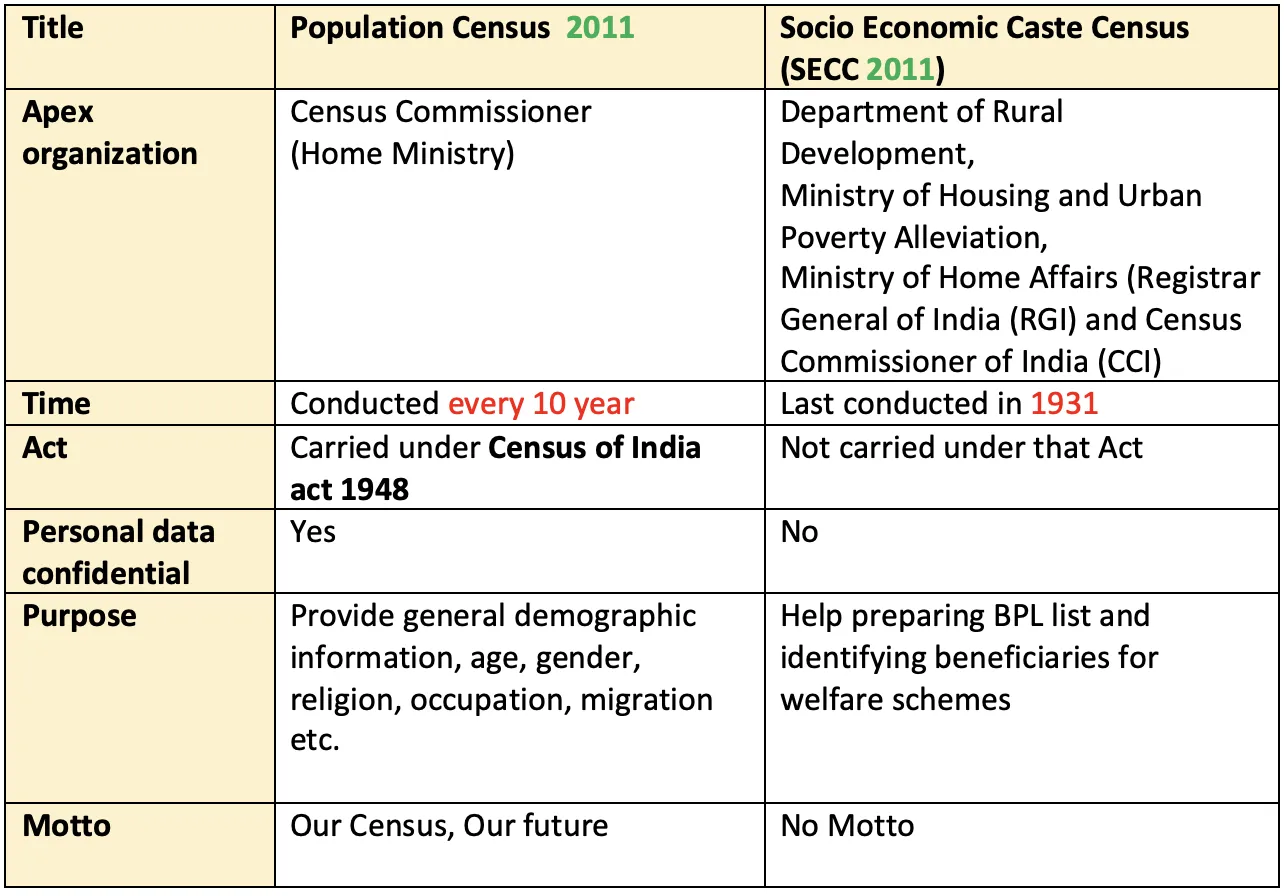
SECC 2011 is a study of socio-economic status of rural and urban households and allows ranking of households based on predefined parameters. Unlike the regular population census, which provides aggregate demographic statistics, SECC provides household-level socio-economic data for targeted programme delivery.[1][3]
-
It has three census components which were conducted by three separate authorities but under the overall coordination of Department of Rural Development in the Government of India.
-
Census in Rural Area was conducted by the Department of Rural Development (DoRD). Census in Urban Areas was under the administrative jurisdiction of the Ministry of Housing and Urban Poverty Alleviation (MoHUPA). Caste Census was under the administrative control of Ministry of Home Affairs: Registrar General of India (RGI) and Census Commissioner of India (CCI). This three-authority structure reflects the complexity of the exercise and the need for specialised expertise in each domain.[1][3]
Why SECC?
-
The current definition of poverty which was derived by identifying a basket of essential goods and services and marking the point in India's income distribution where that basket could be purchased by an individual -- was missing too much. The traditional method of defining poverty through a single monetary threshold failed to capture the multidimensional nature of deprivation.
-
Earlier in India, in 2005 Suresh Tendulkar Committee was constituted by the Planning Commission and the estimations of poverty was based upon the recommendation of this committee. This committee recommended to shift away from the calorie-based model and made the poverty line somewhat broad based by considering monthly spending on education, health, electricity and transport also. The Tendulkar panel stipulated a benchmark daily per capita expenditure of Rs. 26 (rural) and Rs. 32 (urban). These poverty lines were widely criticised as being unrealistically low -- many argued that it was impossible to meet basic needs at such minimal expenditure levels.
-
A new committee was formed which drew a new line but the Rangarajan methodology too wound up at a poverty line not very different from the Tendulkar line.
-
So, a broader and more dynamic definition of poverty seemed important.
-
Also, while the general census was about individuals, the SECC was based on households and this gives a more accurate picture of the economic status of families. The household-based approach is more meaningful because resources are typically shared within a family, and poverty is experienced collectively by the household.
Regular population census v/s SECC 2011
OBJECTIVES
- To enable households to be ranked based on their Socio-Economic status, so that State Governments can then prepare a list of families living below the poverty line. This ranking provides a transparent and objective basis for targeting welfare benefits.
- To make available authentic information that will enable caste-wise population enumeration of the country and education status of various castes and section of the population.
- It is relevant to note that the regular Population Census is carried out under Census Act, 1948. According to this Act, Government must keep individual's personal information confidential.
- The aim of regular Population Census is to provide overview, it is not concerned with any particular individual household. Thus, personal data given in Population Census is confidential. On the contrary all the personal information given in the Socio Economic Caste Census (SECC) is open for use by Government departments to grant and/ or restrict benefits to households. This is the fundamental difference between the two exercises: Census data is confidential while SECC data is open for administrative use.
Criteria used in SECC 2011
In order to evolve a uniform methodology for identification of urban BPL, the Planning Commission in May 2010, constituted an expert group under the Chairmanship of Professor S.R. Hashim to recommend the detailed methodology for identification of BPL families in urban areas which include automatic exclusion, automatic inclusion and scoring index of the remaining urban families in the order.
IMPORTANT
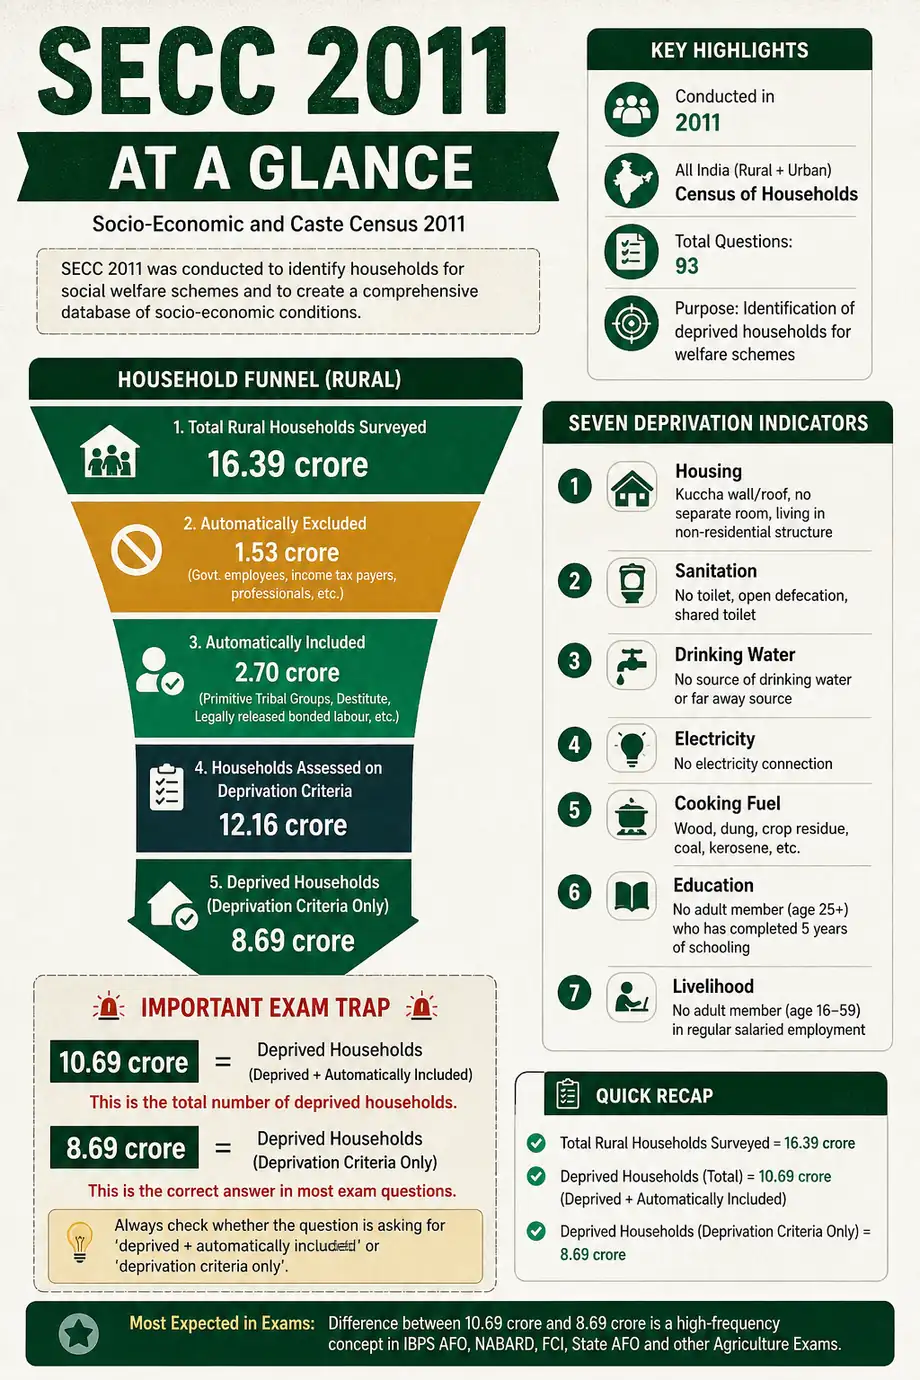
SECC's rural release uses a three-tier methodology: Automatic Exclusion (14 parameters), Automatic Inclusion (5 parameters), and Deprivation Grading (7 indicators). Memorise the count for the rural SECC table.[1]
SECC uses automatic exclusion on the basis of 14 parameters, automatic inclusion on the basis of 5 parameters, and grading of deprivation on the basis of seven criteria. This three-tier methodology creates a systematic and objective framework for classifying households: those who are clearly not poor (excluded), those who are clearly very poor (included), and those in between who are assessed based on deprivation indicators.[1]
NOTE
A later 2018 government reply describes beneficiary selection as 13 automatic exclusion parameters, 5 inclusion parameters, and 7 deprivation criteria.[3] For exam questions asking about the 2015 rural SECC release table, use 14-5-7; for scheme-operational summaries, read the wording carefully.
14 PARAMETERS OF AUTOMATIC EXCLUSION
If a household meets any one of these 14 criteria, it is automatically excluded from the BPL list, as it indicates a minimum level of economic well-being.
- Motorized 2/3/4 wheeler/fishing boat.
- Mechanized 3-4 wheeler agricultural equipment.
- Kisan credit card with credit limit of over Rs 50,000/-.
- Household member government employee.
- Households with non-agricultural enterprises registered with government.
- Any member of household earning more than Rs 10,000 per month.
- Paying income tax.
- Paying professional tax.
- 3 or more rooms with pucca walls and roof.
- Owns a refrigerator.
- Owns landline phone.
- Owns more than 2.5 acres of irrigated land with 1 irrigation equipment.
- 5 acres or more of irrigated land for two or more crop season.
- Owning at least 7.5 acres of land or more with at least one irrigation equipment.
- The percentage of rural households excluded from the deprivation/BPL consideration according to the rural SECC release = 39.39% or about 39.5%.[1]
- The percentage of rural households pays income tax = 2.5% (81.1 lakh). This extremely low figure highlights how few rural households earn enough to fall within the tax-paying bracket.
5 PARAMETERS OF AUTOMATIC INCLUSION
Households meeting any one of these five criteria are automatically included in the BPL list, as these conditions represent extreme deprivation.
- Households without shelter
- Destitute, living on alms
- Manual scavenger families
- Primitive tribal groups (PTG)
- Legally released bonded labour
-
Automatic Included 16.50 Lakh (0.92%). This very small percentage indicates that only a tiny fraction of the population lives under conditions of absolute destitution as defined by these strict criteria.[1]
-
Primitive tribal groups (PTG) are the poorest of poor amongst the Scheduled Tribes (STs). They are identified based on three parameters:
- They use pre-agricultural level of technology for farming
- Very low level of literacy
- There population is either declining or stagnant
HOUSEHOLDS BASED ON 7 MARKERS OF DEPRIVATION
For households that are neither automatically excluded nor automatically included, these 7 deprivation indicators are used to rank them. Each indicator captures a different dimension of vulnerability.
- Households with Kutchha house.
- No adult member in working age.
- Household headed by female and no working age male member.
- Household with handicapped members and not able bodied adult.
- Household with no literate over 25 years.
- Landless households engaged in manual labour
- SC/ST households
The order of priority for inclusion of households in the BPL list is the largest number of deprivations to smallest number of deprivations. This means households suffering from the most deprivations are given first priority, ensuring that the poorest of the poor are served first.
IMPORTANT
BPL Population by State: Highest: Chhattisgarh > Jharkhand > Manipur Lowest: Goa > Kerala
Key Findings
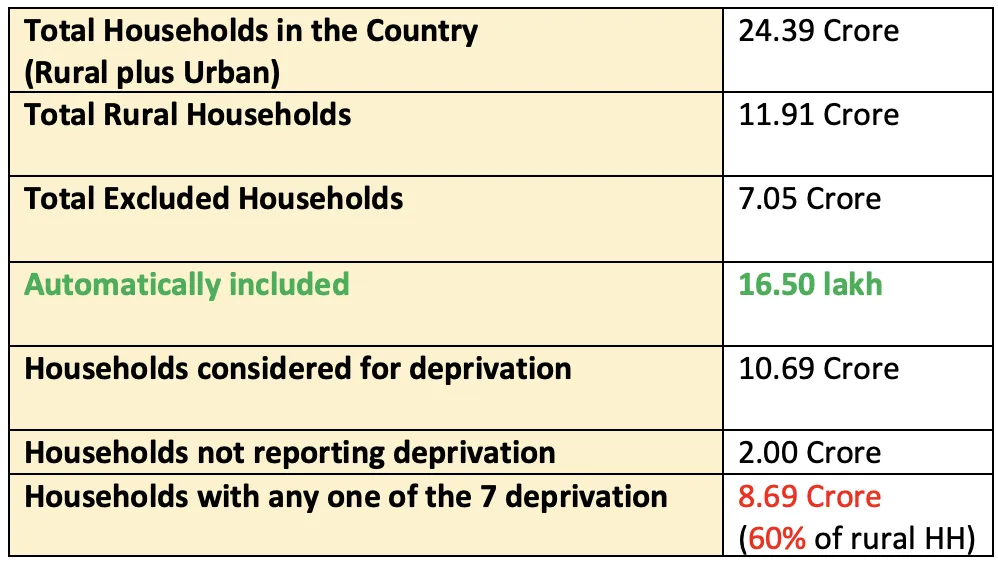
- Out of the 24.39 crore households in India, 17.91 crore were rural households. Of these, 10.69 crore households were considered for deprivation after automatic exclusion and inclusion filters. The official table separately records 8.69 crore rural households with any one of the 7 deprivations, which is about 48.5% of rural households.[1] This distinction is a high-value exam trap.
- These extremely low income numbers follow from the nature of employment that most of rural India is engaged in. The vast majority -- over 90% - of rural India, does not have salaried jobs.
- Working in anything other than agriculture will be a tough task, given the level of education 5.4 % make it to higher secondary and just 3.41 per cent of households have a family member who is at least a graduate. The extremely low levels of higher education in rural India are one of the biggest barriers to non-agricultural employment and economic mobility.
-
Only 30.10% of rural households depend on cultivation as their main source of income. Whereas, 51.14% derive sustenance from manual casual labour (MCL).[1] Fragmentation of landholdings has made it difficult for even farmers to support themselves, let alone those dependent on MCL. Therefore, creation of dignified non-farm work, skill development, and rural enterprise opportunities becomes central to poverty reduction. This data reveals a critical insight: the majority of rural India does not live by farming but by selling labour, often in irregular, low-paying jobs.
-
36% rural people are illiterate in India. This figure was recorded 32% in Census 2011. Out of the remaining, 64% literate around 20% have not completed primary school.
-
35% of urban Indian households qualify as poor.
-
In nearly 75% of the rural households, the main earning family member makes less than Rs 5,000 per month (or Rs 60,000 annually). In just eight per cent of households does the main earning member makes more than Rs 10,000 per month.
-
14 % rural households are employed with government or private sector.
-
56.25% of rural households hold no agricultural land. The numbers also point to the subsistence level of farming that rural India currently practices. Therefore, creation of gainful non-farm employment should receive top priority in policy making. This figure is particularly striking -- more than half of rural households are landless, which means they depend heavily on wages or non-farm income for survival.[1]
-
95 % of rural households have their own house.
-
1 % of rural households own a landline phone without a mobile phone, while 68.35 % rural households have mobile phones as their only phone.
-
As per SECC 2011, 48 % of Indian rural population is female.
-
Around 1.80 Lakh households are still engaged in manual scavenging for livelihood. Maharashtra, with 63,713, tops the list of the largest number of manual scavenger households, followed by Madhya Pradesh, Uttar Pradesh, Tripura and Karnataka. Manual scavenging is one of the most dehumanising occupations and its persistence reflects deep-rooted caste-based discrimination.
-
Percentage of total population of India, Scheduled Castes (S.C.) at 18.46 % (or 15.88 crore), Scheduled Tribes (S.T.) at 10.97 % (9.27 crore), Others at 68.52%, and 2.04% (or 36.57 lakh) as "No Caste & Tribe" households.
-
21.53 % (3.86 crore) families living in villages belong to SC/ST categories.
-
India's 0.1 % population is comprised of transgender. Highest proportion of transgender is in Andaman & Nicobar Islands, West Bengal, Gujarat, Odisha and Mizoram.
-
Kerala has highest number of people with mental aliments in India.
-
The military and the para-military were kept out of the SECC.
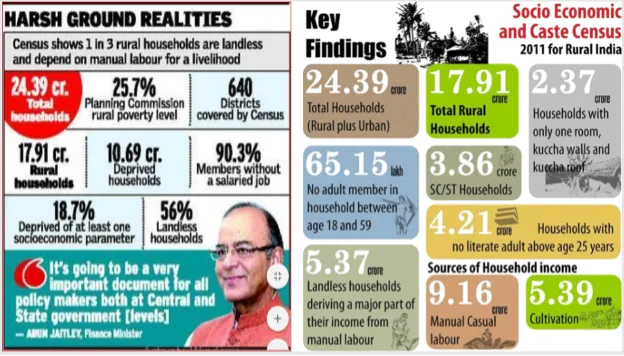
Thus, among the indicators, Iandlessness and a reliance on manual labour contributes the great to deprivation. In all, half of rural India is deprived on at least one of these indicators. The findings of the census are similar to that of the Rangarajan committee, a technical expert group set up in 2012. The panel had found that the percentage of people below the poverty line in 2011-12 was 30.95 % in rural areas and 26.4 % in urban areas.
Criticism of SECC
Despite its historic significance, SECC 2011 faced substantial criticism on grounds of methodology, reliability, and political interference. Understanding these limitations is important for a balanced view.
- SECC 2011 data was criticized by few experts as it was not reliable. The methodology is not full proof and there are many errors and omissions in the draft data.
- Experts have criticized conduction of the census by the ministry of rural development (MRD) rather than by the Registrar General, Census, or by the NSS. Both organisations have been doing survey/census work for the last sixty-five years; MRD is rather late in this game and is prone to political compulsions rather than act as an objective, quasi-academic unit. This criticism highlights the concern that political considerations may have influenced data collection and reporting.
- There is criticism that caste related data is deliberately withheld, similar to the religious data of 2011 Census of India, ostensibly because the findings could be politically controversial.
- Though, experts have appreciated the approach of defining poverty through deprivation, instead of consumption, but there are some data which contradicts the ground realities. For example, the number of manual scavengers are grossly underestimated.
- There are concerns that the SECC's partial release and inconsistent enumeration might potentially harm existing welfare programs. The data released has not covered all the districts and even some states.
- As far as reliability is concerned, it is not confidential like the population census, so respondents could have skewed their answers to be eligible for schemes or, in the case of caste, due to social pressures. This response bias is an inherent challenge in any non-confidential survey where the answers directly affect access to government benefits. A later government reply also clarifies that finalized public SECC data excluded caste data.[3]
Way Forward
- The government has signaled that this data would be the basis for targeted allocation of entitlements under various poverty alleviation programs. This was meant to better identify beneficiaries of welfare schemes.
- Thus, the SECC helps to move to principle of 'program specific indicators for program specific entitlements'. PMAY-G is the best exam example because beneficiary identification uses SECC-2011 housing deprivation parameters, exclusion criteria, Gram Sabha verification, and an appellate process.[4]
SECC 2011 -- Key Numbers to Remember
- 24.39 crore total households; 17.91 crore rural (73.3%)
- 10.69 crore rural households considered for deprivation; 8.69 crore had at least one deprivation
- 48.5% rural households had at least one deprivation; 39.39% automatically excluded
- 0.92% automatically included (16.50 lakh)
- 51.14% depend on manual casual labour; only 30% on cultivation
- 56.25% rural households are landless
- 75% earn <Rs 5,000/month; 36% rural illiteracy
- Tendulkar poverty line: Rs 26 (rural), Rs 32 (urban)
- BPL highest: Chhattisgarh; Lowest: Goa
Recognizing many dimensions of poverty and tackling them with different programs, in multiple fields like health, education, sanitation, mid-day meal can be universal; others like affordable housing, disability can be targeted. This approach moves India towards a more nuanced and effective welfare delivery system where different programmes use different criteria tailored to their specific objectives, rather than relying on a single poverty line.
Official SECC 2011 Sources
4 sources • [1] [2] [3] [4]
Official SECC 2011 Sources
Used for: Primary official rural SECC release for the 24.39 crore household total, 17.91 crore rural households, 14 exclusion parameters, 5 inclusion parameters, 7 deprivation indicators, and source-of-income data.
Used for: Archived PDF copy of the official PIB release, useful when the older PIB print page is slow or unavailable.
Used for: Clarifies rural/urban implementing ministries, finalized public data excluding caste data, three-step beneficiary selection, and use in PMAY-G, DAY-NRLM, PMUY, and urban welfare programmes.
Used for: Confirms PMAY-G beneficiary identification through SECC-2011 housing deprivation parameters, exclusion criteria, Gram Sabha verification, and appellate process.
Summary Cheat Sheet
| Concept / Topic | Key Details |
|---|---|
| SECC 2011 | First caste-based census of independent India; started 29 June 2011 from Tripura |
| Previous caste data | Last collected in 1931 (80-year gap) |
| India's first paperless census | Conducted on handheld devices by BEL |
| Results released | July 2015 |
| Three authorities | Rural = DoRD; Urban = MoHUPA; Caste = RGI/CCI (Home Affairs) |
| Tendulkar Committee (2005) | Poverty line: Rs 26 (rural), Rs 32 (urban) per day |
| Hashim Committee | Designed 3-tier BPL methodology for SECC |
| Automatic Exclusion | 14 parameters (e.g. motorised vehicle, refrigerator, >2.5 acres irrigated land, income tax payer) |
| Excluded households | 39.5% of rural households |
| Automatic Inclusion | 5 parameters (no shelter, destitute, manual scavenger, PTG, bonded labour) |
| Included households | 16.50 lakh (0.92%) |
| 7 Deprivation Indicators | Kutchha house, no working-age adult, female-headed (no male), disabled, no literate >25, landless manual labour, SC/ST |
| Total households | 24.39 crore; rural = 17.91 crore (73.3%) |
| Households considered for deprivation | 10.69 crore after exclusion/inclusion filters |
| Rural households with at least one deprivation | 8.69 crore, about 48.5% of rural households |
| Manual casual labour | 51.14% depend on MCL; 30.10% on cultivation |
| Landless rural households | 56.25% |
| Monthly income <Rs 5,000 | 75% of rural households |
| Rural illiteracy | 36% |
| BPL highest state | Chhattisgarh; Lowest = Goa |
| SC population | 18.46%; ST = 10.97% |
TIP
Next: The next lesson provides a quick reference table of 37 important extension projects -- from Sriniketan (1914) to NFSM (2007) -- with years, founders, and key facts for rapid exam revision.