📈 UP Economy — Overview
Overview of Uttar Pradesh's GSDP, per capita income, economic regions, sectoral composition, and growth trends for Uttar Pradesh GK preparation.
Introduction
Uttar Pradesh is one of India's largest state economies. Because it has the country's largest population, students should understand the economy through two contrasting facts together:
- very large total economic size
- low per capita income compared with richer states and the national average
That contrast explains why growth, jobs, agriculture productivity, and regional balance matter so much in UP's policy discourse.
GSDP and Economic Scale
Economy figures in this lesson are especially time-sensitive. Based on the 2026-27 budget analysis and related budget documents available on June 3, 2026, UP's economy is best remembered as being around ₹30 lakh crore in 2024-25 and budgeted at just under ₹40 lakh crore for 2026-27.
| Indicator | Value |
|---|---|
| GSDP (2024-25, current prices) | about ₹30 lakh crore |
| GSDP (2026-27, budgeted) | about ₹39.8 lakh crore |
| National rank by GSDP | Among the top state economies |
| Per capita income (2024-25) | ₹1,24,366 |
| Fiscal deficit target (2026-27) | 3% of GSDP |
| Fiscal deficit | Capped at 3% |
The state has set an ambitious goal of becoming a $1 trillion economy by around 2029-30. That target is a policy aspiration, not an already achieved fact.
The first state-level Economic Survey for UP was presented in the 2025-26 period, which is an important institutional milestone for exam memory.
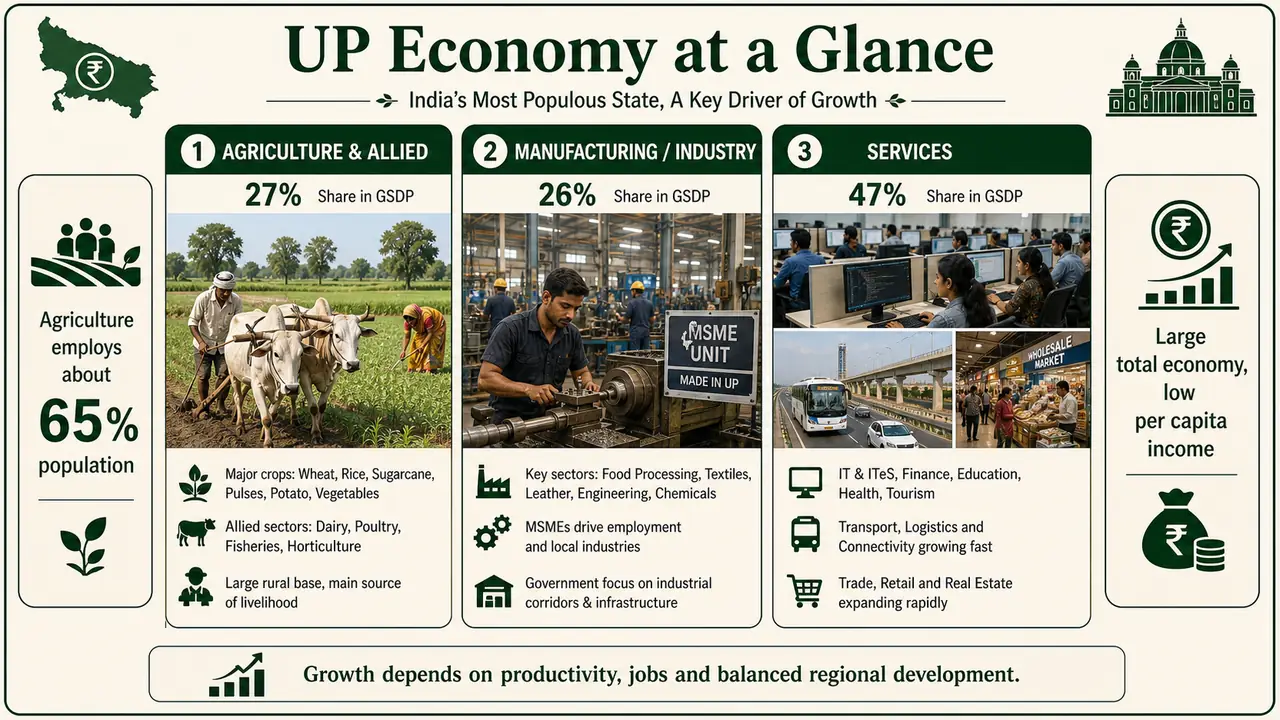
Sectoral Composition of GSDP
The economy has gradually shifted from agriculture-dominated to more services-led output, even though a very large share of the population still depends on agriculture.
| Sector | Share of GSDP | Key Characteristics |
|---|---|---|
| Agriculture & Allied | 27% (2024-25) | Employs ~65% of population |
| Manufacturing/Industry | 26% (2024-25) | MSME-dominated, sugar and textiles |
| Services | 47% (2024-25) | IT, trade, transport, government |
The mismatch between agriculture's 27% GSDP share and its much larger employment dependence highlights low productivity and disguised unemployment in rural areas.
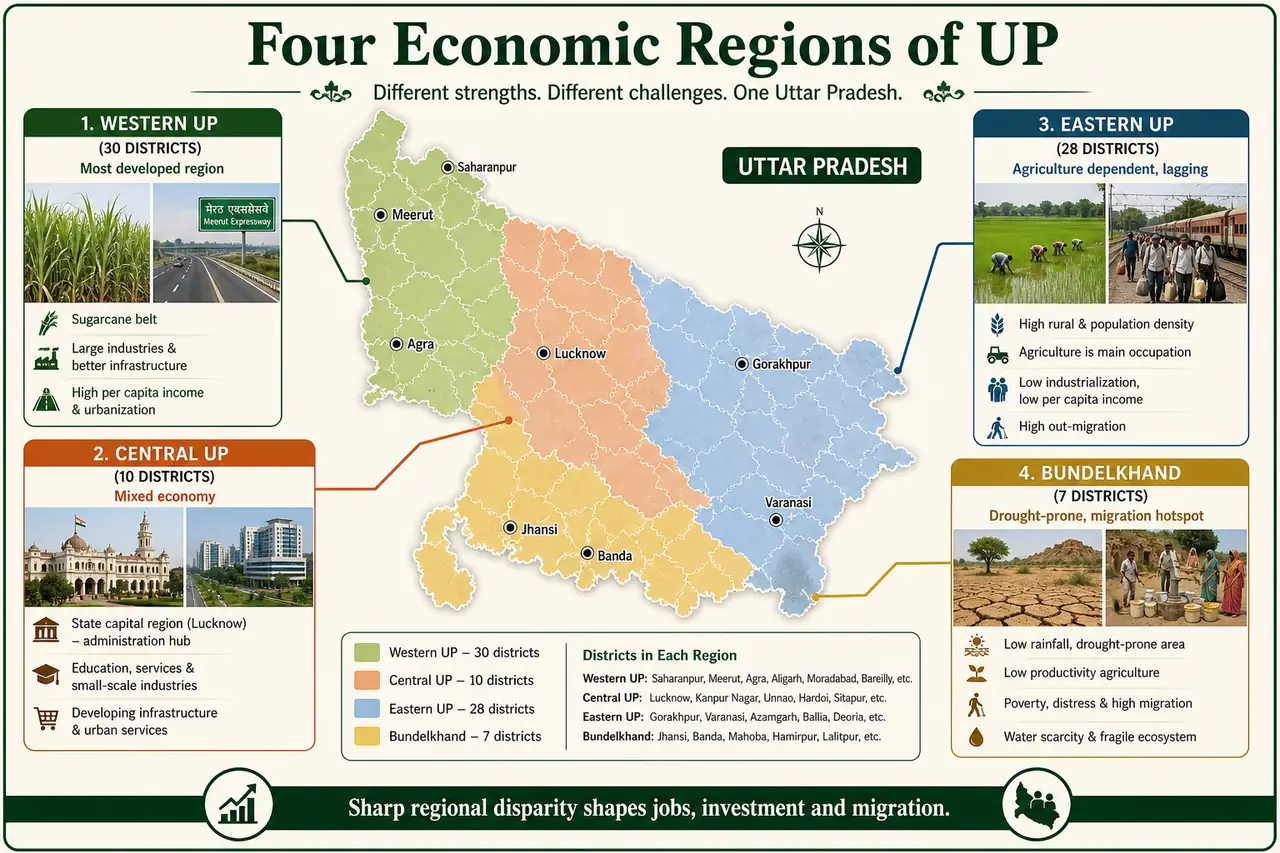
Four Economic Regions of UP
UP is often discussed through four broad economic regions with stark differences in development levels.
| Region | Districts | Development Level | Key Feature |
|---|---|---|---|
| Western UP | 30 districts | Most developed | Sugarcane belt, IT hubs, highest urbanization |
| Central UP | 10 districts | Moderately developed | State capital Lucknow, mixed economy |
| Eastern UP | 28 districts | Least developed | High population density, agriculture-dependent |
| Bundelkhand | 7 districts | Drought-prone, backward | Low rainfall, migration hotspot |
Intra-Regional Disparity
The gap between western and eastern UP is one of the widest intra-state development disparities in India. Western UP benefits from proximity to Delhi-NCR, better infrastructure, and higher irrigation coverage, while eastern UP faces chronic flooding, low industrialization, and outward migration.
Growth Rate and Investment Trends
UP has shown notable economic expansion in recent years, but the lesson should focus more on structural pattern than on fragile one-year headlines.
- GSDP growth rate (2024-25, constant prices estimate): around 9% in the budget analysis cited for this lesson
- UP attracted significant FDI after the Global Investors Summit events (2018, 2023)
- Invest UP — the state's single-window investment clearance portal — has processed thousands of proposals
- Key investment sectors: defence manufacturing, IT/ITES, food processing, textiles, renewable energy
- Large investment proposals have been announced through investors' summits, though proposal values should be treated cautiously until grounded in implementation data
Budget Highlights
The UP Budget 2026-27 was presented on February 11, 2026. Budget analysis sources place its total outlay at about ₹9.12 lakh crore. The fiscal deficit target is 3% of GSDP, and UP remains a major recipient of central transfers due to its size and population weight.
Challenges Facing UP Economy
| Challenge | Details |
|---|---|
| Low per capita income | Nearly half the national average |
| Agriculture dependency | 65% workforce in low-productivity farming |
| Regional imbalance | Eastern UP and Bundelkhand lag significantly |
| Urbanization deficit | Only ~22% urban (national average ~35%) |
| Informal sector dominance | Over 90% employment in unorganized sector |
| Infrastructure gap | Power, roads, and logistics still developing |
Summary Cheat Sheet
| Fact | Answer |
|---|---|
| UP economy position | One of India's largest state economies |
| GSDP 2024-25 | about ₹30 lakh crore |
| GSDP 2026-27 (budgeted) | about ₹39.8 lakh crore |
| Per capita income (2024-25) | ₹1,24,366 |
| Agriculture share in GSDP | 27% |
| Manufacturing share in GSDP | 26% |
| Services share in GSDP | 47% |
| Agriculture share in employment | ~65% |
| $1 Trillion Economy target | around 2029-30 |
| UP Budget 2026-27 | about ₹9.12 lakh crore |
| Fiscal deficit target | 3% of GSDP |
| Most developed region | Western UP (30 districts) |
| Least developed region | Eastern UP (28 districts) |
| Bundelkhand districts | 7 |
| State investment portal | Invest UP |
Lesson Doubts
Ask questions, get expert answers