🏛 SECC 2011
Learn about Socio-Economic Cast Census 2011
- SECC-2011 was
first caste based censusof Independent India began on 29 June 2011 from the Sankhola village of Hazemara block in WestTripuraDistrict. Earlier, caste based data was collected in 1931 census. - The Manmohan Singh government approved the Socio Economic and Caste Census 2011 to be carried out after discussion in both houses of Parliament in 2010.
- Information on caste was last collected during the British Raj in
1931. - Government released the results of SECC-2011 in July
2015. - SECC-2011 was also India’s first paperless census conducted on handheld devices manufactured by Bharat Electronics Ltd. (BEL) by the government in 640 districts of the country. The rural development ministry has taken a decision to use the SECC data in all its programmers such as MGNREGA, National Food Security Act etc.
- SECC 2011 data will also be used to identify beneficiary and expand the Direct Benefit Transfer (DBT) scheme as part of its plans to build upon the JAM (Pradhan Mantri Jan Dhan Yojana-Aadhaar-Mobile number portability) trinity.
- SECC 2011 is a study of socio economic status of rural and urban households and allows ranking of households based on predefined parameters.
- It has three census components which were conducted by three separate authorities but under the overall coordination of Department of Rural Development in the Government of India.
- Census in
Rural Areahas been conducted by the Department of Rural Development (DoRD). Census inUrban Areasis under the administrative jurisdiction of the Ministry of Housing and Urban Poverty Alleviation (MoHUPA). Caste Census is under the administrative control of Ministry of Home Affairs: Registrar General of India (RGI) and Census Commissioner of India (CCI).
Why SECC?
- The current definition of poverty which was derived by identifying a basket of essential goods and services and marking the point in India’s income distribution where that basket could be purchased by an individual — was missing too much.
- Earlier in India, in 2005 Suresh Tendulkar Committee was constituted by the Planning Commission and the estimations of poverty was based upon the recommendation of this committee. This committee recommended to shift away from the calorie-based model and made the poverty line somewhat broad based by considering monthly spending on education, health, electricity and transport also. The Tendulkar panel stipulated a benchmark daily per capita expenditure of
Rs. 26andRs. 32in rural and urban areas respectively. - A new committee was formed which drew a new line but the Rangarajan methodology too wound up at a poverty line not very different from the Tendulkar line.
- So, a broader and more dynamic definition of poverty seemed important.
- Also, while the general census was about individuals, the SECC was based on households and this gives a more accurate picture of the economic status of families.
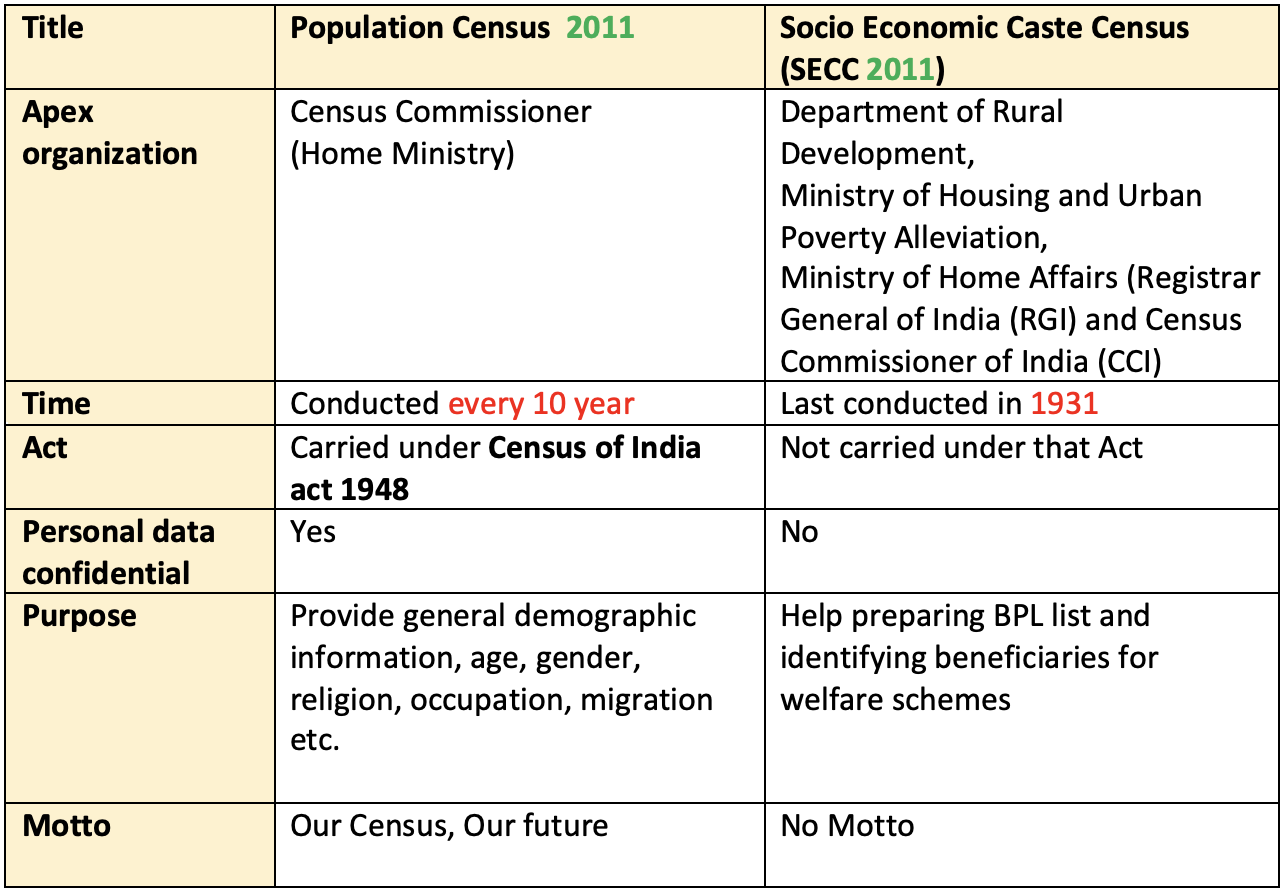
Regular population census v/s SECC 2011
OBJECTIVES
- To enable households to be ranked based on their Socio-Economic status, so that State Governments can then prepare a list of families living below the poverty line.
- To make available authentic information that will enable caste-wise population enumeration of the country and education status of various castes and section of the population.
- It is relevant to note that the regular Population Census is carried out under Census Act, 1948. According to this Act, Government must keep individual’s personal information confidential.
- The aim of regular Population Census is to provide overview, it is not concerned with any particular individual household. Thus, personal data given in Population Census is confidential. On the contrary all the personal information given in the Socio Economic Caste Census (SECC) is open for use by Government departments to grant and/ or restrict benefits to households.
Criteria used in SECC 2011
In order to evolve a uniform methodology for identification of urban BPL, the Planning Commission in May 2010, constituted an expert group under the Chairmanship of Professor S.R. Hashim to recommend the detailed methodology for identification of BPL families in urban areas which include automatic exclusion, automatic inclusion and scoring index of the remaining urban familied in the order. SECC uses the parameters laid down by the S. R. Hashim committee appointed by the erstwhile Planning Commission of India i.e., automatic exclusion on the basis of 14 parameters, automatic inclusion on the basis of 5 parameters and grading of deprivation on the basis of seven criteria.
14 PARAMETERS OF AUTOMATIC EXCLUSION
- Motorized 2/3/4 wheeler/fishing boat.
- Mechanized 3-4 wheeler agricultural equipment.
- Kisan credit card with credit limit of over Rs 50,000/-.
- Household member government employee.
- Households with non-agricultural enterprises registered with government.
- Any member of household earning more than Rs 10,000 per month.
- Paying income tax.
- Paying professional tax.
- 3 or more rooms with pucca walls and roof.
- Owns a refrigerator.
- Owns landline phone.
- Owns more than 2.5 acres of irrigated land with 1 irrigation equipment.
- 5 acres or more of irrigated land for two or more crop season.
- Owning at least 7.5 acres of land or more with at least one irrigation equipment.
- The percentage of rural households have been excluded from below poverty line according to standard definition = 39.5 %.
- The percentage of rural households pays income tax =
2.5 %(81.1 lakh).
5 PARAMETERS OF AUTOMATIC INCLUSION
- Households without shelter
- Destitute, living on alms
- Manual scavenger families
- Primitive tribal groups (PTG)
- Legally released bonded labour
- Automatic Included 16.50 Lakh (0.92%)
- Primitive tribal groups (PTG) are the poorest of poor amongst the Scheduled Tribes (STs). They are identified based on three parameters:
- They use pre-agricultural level of technology for farming
- Very low level of literacy
- There population is either declining or stagnant
HOUSEHOLDS BASED ON 7 MARKERS OF DEPRIVATION
- Households with Kutchha house.
- No adult member in working age.
- Household headed by female and no working age male member.
- Household with handicapped members and not able bodied adult.
- Household with no literate over 25 years.
- Landless households engaged in manual labour
- SC/ST households
👉🏻 The order of priority for inclusion of households in the BPL list is the largest number of deprivations to smallest number of deprivations.
👀 BPL population
Highest: Chhattisgarh > Jharkhand > ManipurLowest: Goa > Kerala
Key Findings
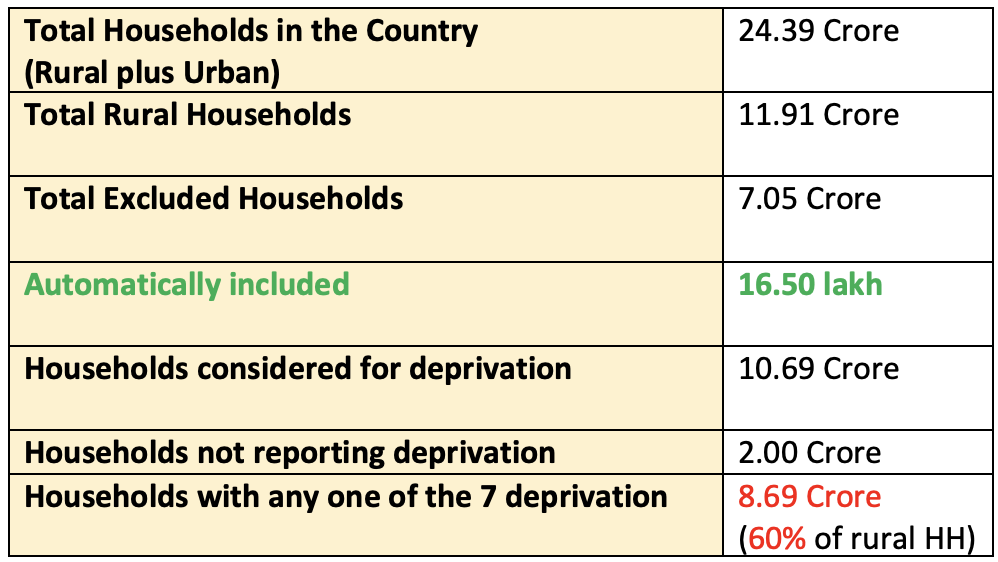
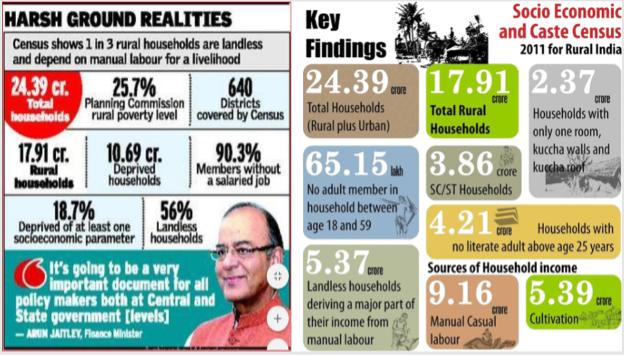
- Out of the
24.39 crorehouseholds in India,17.91 crore(73.3%) live in villages. Out of these,10.69 Crore(60%) households are deprived. The economic status of a household was computed through seven indicators of deprivation aspects of landlessness, housing, source of income, disability etc. - These extremely low income numbers follow from the nature of employment that most of rural India is engaged in. The vast majority — over 90% - of rural India, does not have salaried jobs.
- Working in anything other than agriculture will be a tough task, given the level of education
5.4 %make it to higher secondary and just3.41 per centof households have a family member who is at least a graduate. - Only
30% of rural householdsdepend on cultivation as their main source of income. Whereas,51.14 %derive sustenance from manual casual labour (MCL). Fragmentation of landholdings has made it difficult for even farmers to support themselves, let alone those dependent on MCL. Therefore, getting people out of farms will spur mechanization and consolidation of land holdings, leading to increased agricultural productivity in the long run. 36 %rural people are illiterate in India. This figure was recorded 32 % in Census 2011. Out of the remaining, 64% literate around 20 % have not completed primary school.35 %of urban Indian households qualify as poor.- In nearly
75 %of the rural households, the main earning family member makes less than Rs 5,000 per month (or Rs 60,000 annually). In just eight per cent of households does the main earning member makes more than Rs 10,000 per month. 14 %rural households are employed with government or private sector.56.25 %of rural households hold no agricultural land. The numbers also point to the subsistence level of farming that rural India currently practices. Therefore, creation of gainful non-farm employment should receive top priority in policy making.95 %of rural households have their own house.1 %of rural households own a landline phone without a mobile phone, while68.35 %rural households have mobile phones as their only phone.- As per SECC 2011,
48 %of Indian rural population is female. - Around
1.80 Lakh householdsare still engaged inmanual scavengingfor livelihood. Maharashtra, with 63,713, tops the list of the largest number of manual scavenger households, followed by Madhya Pradesh, Uttar Pradesh, Tripura and Karnataka. - Percentage of total population of India, Scheduled Castes (S.C.) at
18.46 %(or 15.88 crore), Scheduled Tribes (S.T.) at10.97 %(9.27 crore), Others at 68.52%, and 2.04% (or 36.57 lakh) as “No Caste & Tribe” households. 21.53 %(3.86 crore) families living in villages belong to SC/ST categories.- India’s
0.1 %population is comprised of transgender. Highest proportion of transgender is in Andaman & Nicobar Islands, West Bengal, Gujarat, Odisha and Mizoram. Kerelahas highest number of people with mental aliments in India.- The military and the para-military were kept out of the SECC.
30.95 % in rural areas and 26.4 % in urban areas.
CRITICISM OF SECC
- SECC 2011 data was criticized by few experts as it was not reliable. The methodology is not full proof and there are many errors and omissions in the draft data.
- Experts have criticized conduction of the census by the ministry of rural development (MRD) rather than by the Registrar General, Census, or by the NSS. Both organisations have been doing survey/census work for the last sixty-five years; MRD is rather late in this game and is prone to political compulsions rather than act as an objective, quasi-academic unit.
- There is criticism that caste related data is deliberately withheld, similar to the religious data of 2011 Census of India, ostensibly because the findings could be politically controversial.
- Though, experts have appreciated the approach of defining poverty through deprivation, instead of consumption, but there are some data which contradicts the ground realities. For example, the number of manual scavengers are grossly underestimated.
- There are concerns that the SECC’s partial release and inconsistent enumeration might potentially harm existing welfare programs. The data released has not covered all the districts and even some states.
- As far as reliability is concerned, it is not confidential like the census, so respondents could have skewed their answers to be eligible for schemes or in case of caste, due to a number of social reasons.
Way Forward
- The government has signaled that this data would be the basis for targeted allocation of entitlements under various poverty alleviation programs. This was meant to better identify beneficiaries of welfare schemes.
- Thus, the SECC helps to move to principle of ‘program specific indicators for program specific entitlements’. Recognizing many dimensions of poverty and tackling them with different programs, in multiple fields like health, education, sanitation, mid-day meal can be universal; others like affordable housing, disability can be targeted.
- SECC-2011 was
first caste based censusof Independent India began on 29 June 2011 from the Sankhola village of Hazemara block in WestTripuraDistrict. Earlier, caste based data was collected in 1931 census. - The Manmohan Singh government approved the Socio Economic and Caste Census 2011 to be carried out after discussion in both houses of Parliament in 2010.
- Information on caste was last collected during the British Raj in
1931. - Government released the results of SECC-2011 in July
2015. - SECC-2011 was also India’s first paperless census conducted on handheld devices manufactured by Bharat Electronics Ltd. (BEL) by the government in 640 districts of the country. The rural development ministry has taken a decision to use the SECC data in all its programmers such as MGNREGA, National …
Become Successful With AgriDots
Learn the essential skills for getting a seat in the Exam with
🦄 You are a pro member!
Only use this page if purchasing a gift or enterprise account
Plan
- Unlimited access to PRO courses
- Quizzes with hand-picked meme prizes
- Invite to private Discord chat
- Free Sticker emailed
Lifetime
- All PRO-tier benefits
- Single payment, lifetime access
- 4,200 bonus xp points
- Next Level
T-shirt shipped worldwide

Yo! You just found a 20% discount using 👉 EASTEREGG

High-quality fitted cotton shirt produced by Next Level Apparel