🧪 Fertility Evaluation
Crop Response Data, varius methods of soil fertility evaluation
Soil Testing Research in India
- Farming is a business and, like all businesspersons, the farmer operates farming business for profit. Obviously, to reach a decision before planting a crop, a farmer needs all of the reliable information from the country’s soil evaluation program.
- In our country, system of fertility evaluation is being modified from time to time in various stages incorporating crop response data.
Some Important landmarks in soil testing research in India:
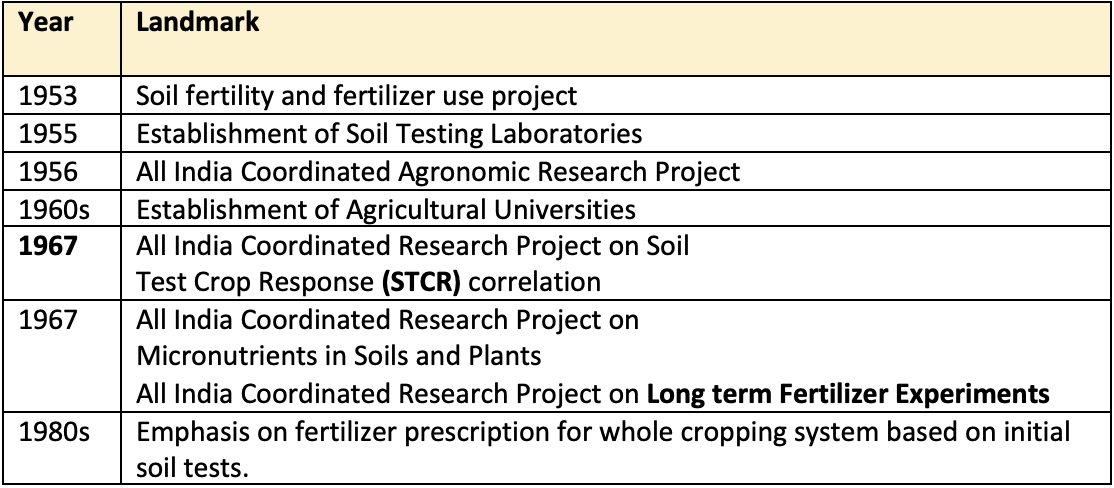
- Since Liebig’s time around 1840 many methods and approaches have been tried to get a precise or workable basis for predicting the fertilizer requirements of crops.
- The fertilizer use project initiated in 1953 following a study by Stewart (1947) was the first systematic attempt in the whole of the country to relate the knowledge of soils to the judicious use of fertilizers.
- The establishment of soil testing laboratories was initiated in 1955-56.
- The project on Model Agronomic Experiments on Experimental Farms and Simple fertilizer trials on cultivators’ Fields was started in 1957.
- The Soil Test Crop Response (STCR) correlation work carried out at Indian Agricultural Research Institute, New Delhi had resulted in the selection of soil test methods and categorizing the tests into low, medium, and high soil fertility classes.
Soil fertility evaluation
- Soils are very heterogeneous in respect to forms of nutrients they contain, which greatly complicates the interpretation of Soil Test for assessing fertilizer needs. The total amount of a nutrient present in a soil offers little information relative to the amount of that nutrient which is available. Numerous extracting solutions and procedures have been used to remove nutrient elements from the soil, but none remove exactly the amount that plant roots obtain.
- This means that, in order to interpret the data, the results from each analytical procedure must be correlated with the plant response obtained in field experiments by applying that fertilizer nutrient.
- By this calibration, the requirement of fertilizer is calculated for achieving specific yield target. Soil fertility evaluation preferably employs a particular method of calibration as per the utility of the outcome.
Crop Response Data
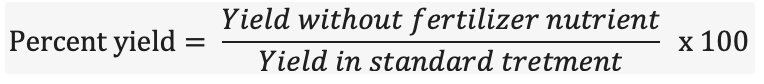
- In nutrient rating experiments, soil test data is correlated with the response of crop. The response is measured in terms of ‘percent yield’ or ‘percent yield increase’. Both represent the ratio of the yield obtained in unfertilized soil (nutrient limiting deficient soil) to the yield in fertilizer nutrient applied soil (non-limiting or nutrient sufficient soil).
- The yield in non-limiting soil is otherwise known as maximum attainable yield or yield of standard treatment with all nutrients applied.
- While comparing native fertility, in experiments that are conducted at different locations, percent yield is used.
- While conducting multi location trials, or a pot experiment in a single location with soils brought from different locations, percent yield increase is worked out for every level of fertilizer application.
- The highest yield obtained in the experiment with all fertilizer nutrient applied, is taken as Maximum attainable yield.

- The soils analyzed by standard nutrient extraction method are grouped. The soil tests are calibrated into different fertility groups by various procedures.
👉🏻 Present Crop Response Data extensively used in India:
- Soil testing programme was initially started adopting the International soil fertility evaluation and improvement programme (Fitts, 1956). In this approach much stress is laid on laboratory characterization, followed by potted-plant studies ultimately leading to field - verification trials.
- These two initial steps help in eliminating arbitrariness of field trials. However, this approach had low adoption as it arrived one critical value below which economic responses are possible. Later, many improvements were suggested.
Agronomic Approach
- This is based on fertilizer rate experiments (recording yield at increasing nutrient levels) conducted at many locations. The level at which yields are high are recorded and averaged. From these results, the optimum dose of fertilizer is recommended for a crop at given agro-climatic region.
- Eg. A blanket dose of 120-50-50 kg/ha of N, P2O5, K2O respectively is recommended for rice.
Critical Limit Approach
- Waugh and Fitts (1965) developed this technique which is largely meant for less mobile nutrients like P, K and micronutrients. Soils vary considerably in fixing capacities. Due to it a part of applied P, which is fixed in soil, is not readily available to plants.
- The method includes incubation study. For P, Soil is incubated for 72 hours with graded doses of soluble P in the form of monocalcium phosphate. Then, the amount of phosphates released (extracted) with an extracting reagent (Olsen or Bray) will be determined.
- The extracted P versus the amount of P applied is plotted. If the relationship is unique, then for high P fixing soils a larger amount of fertilizer P application is needed. This amount of P fixed is estimated as X-value.
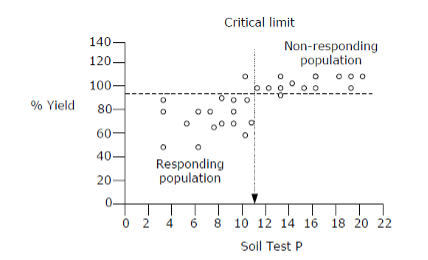
- Then, in plotted experiment fertilizer P is added at 0, 0.5X, X, 2X levels, and the test crop was grown to find out the soil critical value. The percentage yield obtained is plotted against the soil-test value for different soils. By using a plastic overlay, these data are grouped into two populations as described by Cate and Nelson (1965). The soil-test value where the vertical line crosses the x-axis is designated as the soil critical limit.
- Critical limit for the soil test value is the limit below which a positive or economic response to added fertilizer is possible and above which the response diminishes at a faster rate or vanishes.
- The validity of critical value is verified by conducting verification trials in the field locations where from the soil samples have been collected for pot studies.
Linear model
Targeted Yield approach
- Fertilizer recommendation must aim at providing balanced nutrition to crops. Balanced nutrition should ensure the nutrients to be present in available forms in adequate quantities and required proportion for the plant in order to produce maximum yield. The requirement of nutrient to produce the expected yield can be worked out based on nutrient uptake.
Nutrient requirement of crops
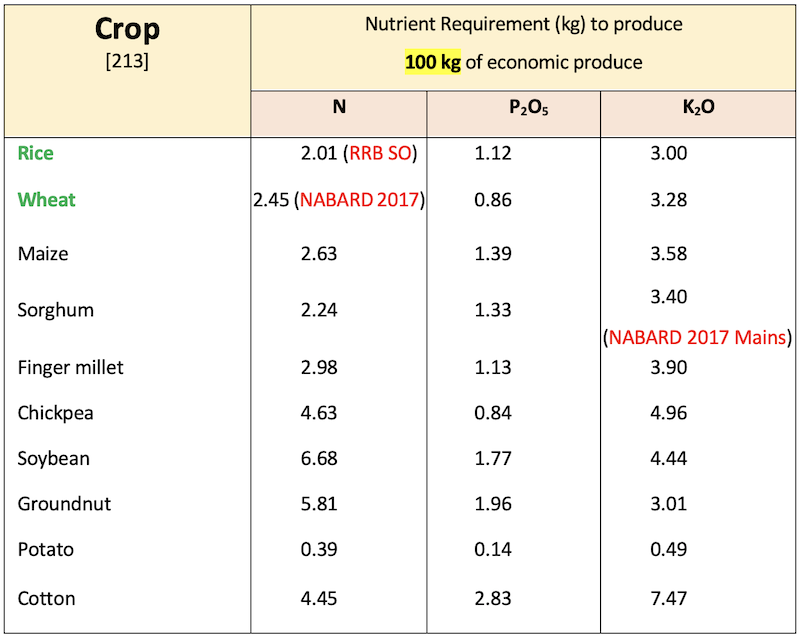
- Liebig’s law of minimum states that the growth of plants is limited by the plant nutrient element in the smallest quantity, when all others being present in adequate amounts. This forms the basis for fertilizer application for targeted yields, first advocated by Troug (1960) by significant linear relationship between the yield of grain and uptake of nutrients. Yield target can be projected within the linear region of the response function.
- This approach, popularly known as Soil Test Crop Response Function (STCR), implies that for obtaining a specific yield (grain or any other economic produce) a definite quantity of the nutrient must be taken up. This value can be determined by the magnitude of the expected yield (T in q/ha) and the nutrient requirement to produce unit quantity of that target (NR in kg/ha).
Fertility Evaluation by Plant Analysis
- Plant analysis is a useful diagnostic tool to ascertain if a nutrient has been or is being assimilated. Plant analysis is also important in ascertaining the nutrient requirements and nutrient status of plants during various stages of growth.
- A reasonably simple laboratory test of plant sample provides a measure of nutrient availability in soil or nutrient status of plant at the time the sample was collected. If these tests are to be useful in making fertilizer recommendations, a coordinated laboratory-field research program must be conducted in order to obtain the desired information.
Deficiency symptoms
- Careful inspection of growing seedling or plants can help identify specific nutrient stress. If a plant is lacking in a particular nutrient, characteristic symptoms may appear. Nutrient deficiency symptoms must be related to some function of the nutrient in the plant. Visual symptoms may be caused by more than one nutrient. In a set of nutrient omission an addition pot experiments, exact limiting nutrients can be identified.
Tissue tests
- The concentration of the nutrients in the cell sap is usually a good indication of how well the plant is supplied at the time of testing.
- These semi-quantitative tests are intended mainly for verifying or predicting deficiencies of N, P, K, S and several micronutrients.
- Method: the plant parts may be chopped up and extracted with reagents. The intensity of color developed is compared with standards and used as a measure of nutrient concentration. Tissue tests are quick, easy to conduct and interpret.
- For tissue tests, the time of sampling and plant part to be sampled have already been standardized for many crops. Tissue test can be done 5-6 times in a season and concentration can be monitored in the farm premises.
- There can be two peak periods of nutrient demand, one during maximum vegetative growth and second during reproductive stage. Fertilization can be done to maintain the peak concentration at critical stages.
Diagnosis and Recommendation Integrated System (DRIS)
- DRIS is a system that identifies all the nutritional factors limiting crop production. Index values measure how far particular nutrients in the leaf or plant are from optimum levels.
- Index values are used in the calibration to classify yield factors in the order of limiting importance. To develop a DRIS for a given crop, the following criteria are to be well considered.
- All factors having effect on yield
- Relationship among factors
- Calibration norm
- Continually refined recommendations
- DRIS was developed based on nutrient ratios. When compared to concentration that normally varies with season, nutrient ratio does not very much. When a nutrient ratio has an optimal value, optimum yield occurs unless some other limiting factor reduces the yield.
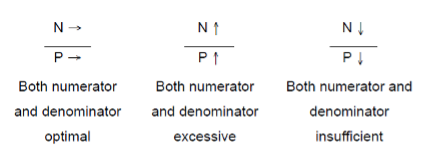
- When the ratio is too low a
response in the numerator will be obtainedif it is limiting. If the nutrient in the denominator is excessive, a yield response may or may not occur depending on the level of other yield factors.
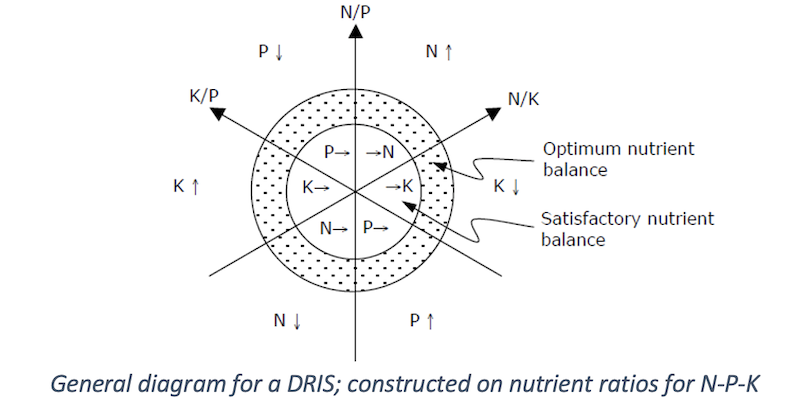
- When the ratio is too high the reverse is true. Usually N/S, K/Mg, K/Ca, Ca + Mg /K, N/P ratios are commonly used. Initially relationship among N-P-K is calibrated.
- Thus, DRIS has several advantages to integrate much nutrient concentration at various stages, in different seasons suitable for many cultivars of a crop.
- DRIS has been found suitable for several grain crops and perennial fruit trees.
Crop Logging
- An excellent example of the use of plant analysis in crop production is the crop logging carried out for
sugarcanein Hawaii. The crop log, which is a graphic record of the progress of the crop, contains a series of chemical and physical measurements. Critical nutrient concentration approach is used in the crop log system. - In sugarcane, plant is sampled at 35 days and analyzed for N, sugar, moisture and weight of young sheath tissue. Nutrients like P and K are monitored at critical stages.
- Based on moisture, irrigation is scheduled. Based on nutrient content, fertilizer application is done. By this record keeping, the productivity of crop is increased.
Biological Tests
- Simpler and rapid laboratory/ greenhouse techniques utilize small quantity of soil to quantify nutrient supplying power of a soil.
Tests using higher plants
- Neubauer seedling method: The neubauer technique is based on the uptake of nutrients by a large number of plants grown on a small amount soil. The roots thoroughly penetrate the soil, exhausting available nutrient supply within a short time. Usually 100 seedlings of rye or oats made to feed 100 g soil mixed with 50 g sand. Blank without soil is also run. Total P2O5 and K2O uptake is calculated and blank value is detected to get root soluble P2O5 and K2O. Values designated as Neubauer Nos. (mg/ 100 g soil) are used to determine the deficiency. These tables give the maximum values of available macro and micronutrients for satisfactory yields of various crops.
- Standard and Demont technique: It is a modified neubauer technique. Round cardboard cartons with bottom removed are nested in a container and filled with sand. Seeds are sown. After 2-3 weeks of growth, a carton containing the plants is nested in a second carton holding 200 g soil or soil + fertilizer. When the mat of roots meets soil, it is allowed to feed for 3-4 days. Then nutrient uptake is estimated.
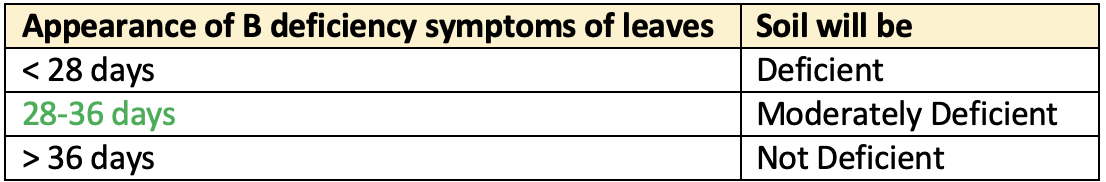
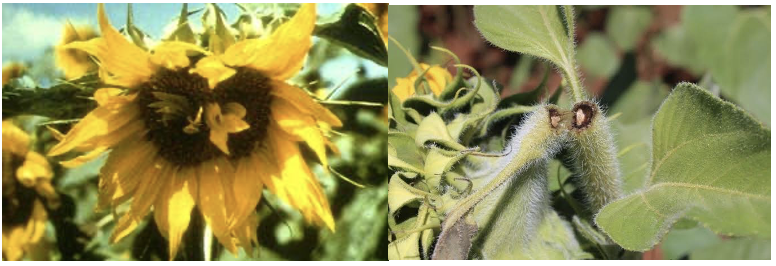
- Deficiency test of sunflower for Boron
- Sunflower is grown in the test soil supplied with nutrient solution with all essential nutrients excepting boron.
Microbiological methods
- In the absence of nutrients, certain microorganisms exhibit behavior similar to that of higher plants. For example, growth of Azotobacter or Aspergillus niger reflects nutrient deficiency in the soil. The soil is grouped from very deficient to not deficient in the respective elements, depending on the amount of colony growth.
- In comparison with methods that utilize growing of higher plants, microbiological methods are rapid, simple and require little space.
- Sacket and Stewart technique: For identifying P and K deficiency test soil is divided in to 4 portions.
Solution containing soluble P, K, and P + K are added in 3 portions and one portion was allowed as check. They are inoculated with
Azotobacterand incubated for 72 hrs. Based on colony growth deficiency is identified. - Melich Cunninghamella – plaque test: Cunninghamella is sensitive for P. Test soil is mixed with nutrient solution and a paste is prepared. The paste is spread on a clay dish.
Cunninghamellais inoculated at the centre and incubated for 5-6 days.
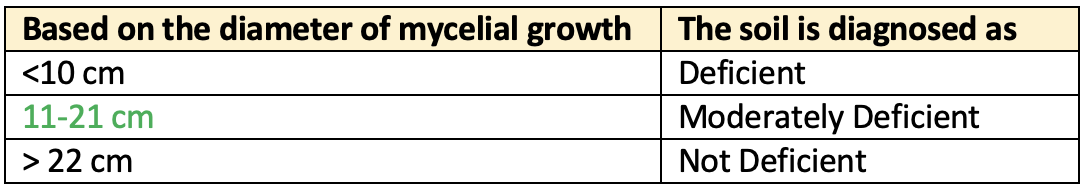
- Mulder Aspergillus niger test for Cu and Mg: Colours of mycelial and spores are used to delineate the deficiency of Cu and Mg. This method is used for Mo, Co, Mn, S, Zn also.
References
- Tisdale, S.L., Nelson, W.L., Beaton, J.D. Havlin, J.L.1997. Soil fertility and Fertilizers. Fifth edition, Prentice hall of India Pvt. Ltd, New Delhi
- Singh, S.S.1995. Soil fertility and Nutrient Management. Kalyani Publishers, Ludhiana
- Maliwal, G.L. and Somani, L.L. 2011. Soil Technology. Agrotech
Soil Testing Research in India
- Farming is a business and, like all businesspersons, the farmer operates farming business for profit. Obviously, to reach a decision before planting a crop, a farmer needs all of the reliable information from the country’s soil evaluation program.
- In our country, system of fertility evaluation is being modified from time to time in various stages incorporating crop response data.
Some Important landmarks in soil testing research in India:
- Since Liebig’s time around 1840 many methods and approaches have been tried to get a precise or workable basis for predicting the fertilizer requirements of crops.
- The fertilizer use project initiated in 1953 following a study by Stewart (1947) was the first systematic attempt in the whole of the country to relate the …
Become Successful With AgriDots
Learn the essential skills for getting a seat in the Exam with
🦄 You are a pro member!
Only use this page if purchasing a gift or enterprise account
Plan
Rs
- Unlimited access to PRO courses
- Quizzes with hand-picked meme prizes
- Invite to private Discord chat
- Free Sticker emailed
Lifetime
Rs
1,499
once
- All PRO-tier benefits
- Single payment, lifetime access
- 4,200 bonus xp points
- Next Level
T-shirt shipped worldwide

Yo! You just found a 20% discount using 👉 EASTEREGG

High-quality fitted cotton shirt produced by Next Level Apparel