🗺️ Drought, Climate Classification & Agro-Climatic Zones of India
Drought types and agricultural drought sub-types, weather forecasting, 15 agro-climatic zones, 20 agro-ecological regions, Koppen and Thornthwaite classification, LGP, and meteorological institutions and instruments
Why Drought and Climate Zones Matter for Agriculture
In the previous lesson, we explored clouds and cloud seeding — how clouds form, the 10 types, and artificial rainmaking techniques. Now we tackle the consequences when rain fails: drought — and the classification systems that help planners match crops to regions.
In 2018, a severe drought in Maharashtra forced thousands of farmers to abandon their soybean and cotton crops. Dryland farmers in Rajasthan routinely face crop failure when growing periods shrink below 5 weeks. Understanding drought classification helps design contingency plans, while knowing India's agro-climatic zones ensures that the right crop is grown in the right region — the foundation of agricultural planning.
This lesson covers:
- Drought types — meteorological, agricultural, hydrological, socio-economic
- Agricultural drought sub-types — early, mid, late, chronic, apparent
- Drought indices — AAI, MAI, MDI, NDVI, SPI, Palmer Index
- Weather forecasting — short, medium, and long range; synoptic vs statistical methods
- IMD and agro-meteorological services — AMD, IAAS, DAAS, AMFUs
- Growing Degree Days and crop-weather models — GDD formula, CERES, DSSAT
- Length of Growing Period — LGP thresholds for cropping systems
- Agro-climatic zones — Planning Commission's 15 zones, ICAR's 127 zones, NBSS&LUP's 20 AERs
- Climate classification — Koppen, Thornthwaite, Troll systems
- Meteorological instruments — heights, uses, and key devices
All topics are high-yield for IBPS AFO, NABARD Grade A, and FCI exams.
What is Drought?
Drought can be defined in three ways:
- The condition under which crops fail to mature because of insufficient water supply through rains.
- A situation where water required for transpiration and evaporation by crops exceeds available soil moisture.
- No precipitation in a rainy season for more than 15 days continuously — such stretches are called dry spells.
IMPORTANT
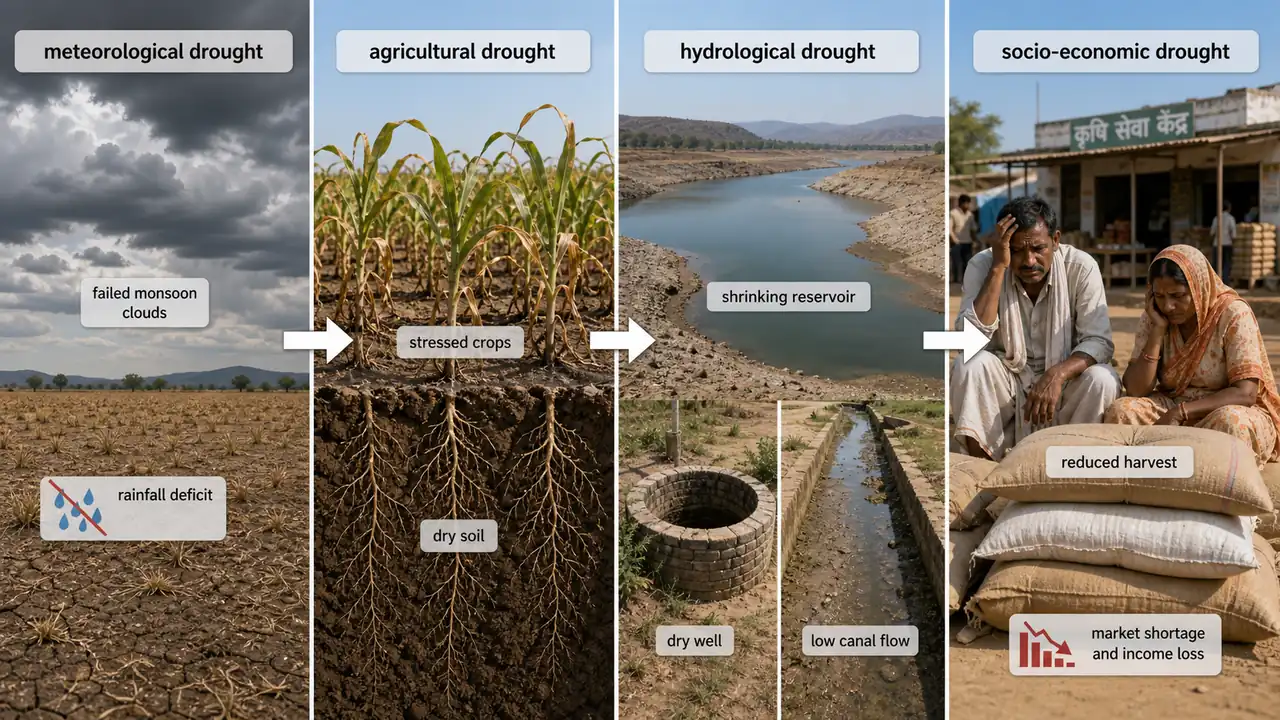
Droughts are classified into 4 main categories that occur in a cascading sequence: Meteorological → Agricultural → Hydrological → Socio-economic.
Four Types of Drought
| Type | Definition | Key Threshold | Agricultural Impact |
|---|---|---|---|
| Meteorological | Seasonal rainfall falls below 75% of the climatologically expected normal over a wide area | Moderate: 26–50% deficit; Severe: >50% deficit | Cropping pattern disrupted; sowing delayed |
| Agricultural | Inadequate rainfall followed by soil moisture deficit; 4 consecutive weeks (May–mid Oct) or 6 weeks (rest of year) without adequate soil moisture | Yield reduction due to soil moisture shortage | Growth reduction; yield loss; crop failure |
| Hydrological | Streams, rivers, reservoirs, lakes, and wells dry up due to marked depletion of surface water; ground water table falls | Lags meteorological drought by weeks/months | Irrigation sources fail; industry and power affected |
| Socio-economic | Drought impacts on livelihoods, food supply, and economy; cascading effect of the above three types | Human welfare indicators decline | Food prices rise; migration; employment loss; famine |
TIP
Cascading sequence for exams: Meteorological → Agricultural → Hydrological → Socio-economic. Agricultural drought is further divided into 5 sub-types (see below).
Five Types of Agricultural Drought
| Sub-Type | When It Occurs | Cause | Agricultural Example |
|---|---|---|---|
| 1. Early Season | Start of season | Delayed onset of monsoon or prolonged dry spell after onset | Seedling mortality in rainfed sorghum; need for resowing bajra |
| 2. Mid-Season | During crop growth | Inadequate soil moisture between two successive rainfall events | Maize at tasseling stage suffers; grain filling reduced in rice |
| 3. Late Season (Terminal) | End of season | Early cessation of monsoon; weak monsoon activity | Rainfed rice in dry sub-humid regions fails due to September rain failure (40–50% dry spells > 5 days) |
| 4. Chronic | Most years | Rainfall and stored soil moisture inadequate most years | Assured growing period is hardly 6–7 weeks in arid Rajasthan; only short-duration bajra survives |
| 5. Apparent | Any time | Mis-matching of cropping pattern with rainfall/moisture | Growing long-duration rice in a 90-day LGP zone |
TIP
Mnemonic — "EML-CA": Early, Mid, Late (terminal), Chronic, Apparent. These five sub-types cover all agricultural drought scenarios.
Key Drought Terms
| Term | Definition |
|---|---|
| Drought year | Annual rainfall ≤ 75% of normal |
| Drought-prone area | Severe or moderate drought in ≥ 20% of years |
| Chronic drought area | Severe or moderate drought in ≥ 40% of years |
| Palmer Drought Index | Given by Palmer (USA, 1965); uses temperature + rainfall to estimate relative soil moisture |
Drought and Moisture Indices
| Index | Full Form / Formula | Use |
|---|---|---|
| AAI (Aridity Anomaly Index) | Departure from normal aridity | Used by IMD weekly to monitor agricultural drought in real-time |
| MAI (Moisture Availability Index) | P (at 50% probability) / PET × 100 | Crop planning in dryland areas |
| MDI (Moisture Deficit Index) | (P − PET) / PET × 100 | Estimate dryness of a region (used in ICAR classification) |
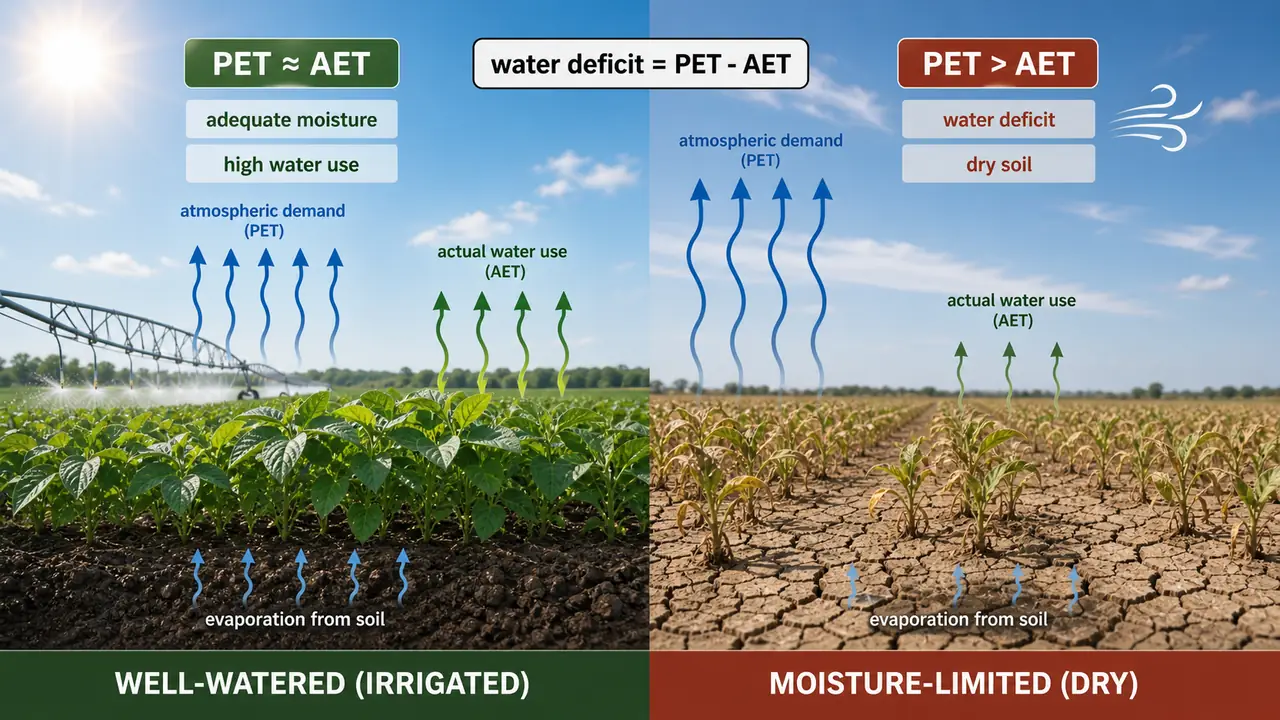
| TMI (Thornthwaite Moisture Index) | AET / PET | How well water supply meets atmospheric demand |
| NDVI (Normalised Difference Vegetation Index) | Satellite-derived; lower values = stressed vegetation | Drought severity assessment from vegetation greenness |
| SPI (Standardised Precipitation Index) | Based solely on monthly precipitation data | Versatile drought index; works across all time scales |
TIP
For exams: AAI = IMD weekly drought monitoring. MAI = dryland crop planning. NDVI = satellite-based. SPI = precipitation-only index.
Drought Monitoring Systems
| System | Full Form | Location | Function |
|---|---|---|---|
| NADAMS | National Agricultural Drought Assessment and Monitoring System | NRSA, Dehradun | Satellite-based vegetation monitoring using NDVI |
| NRSA | National Remote Sensing Agency | Hyderabad | Remote sensing data for crop and drought monitoring |
NOTE
NADAMS uses satellite-derived NDVI to classify drought severity — lower NDVI values indicate stressed or sparse vegetation, confirming drought conditions.
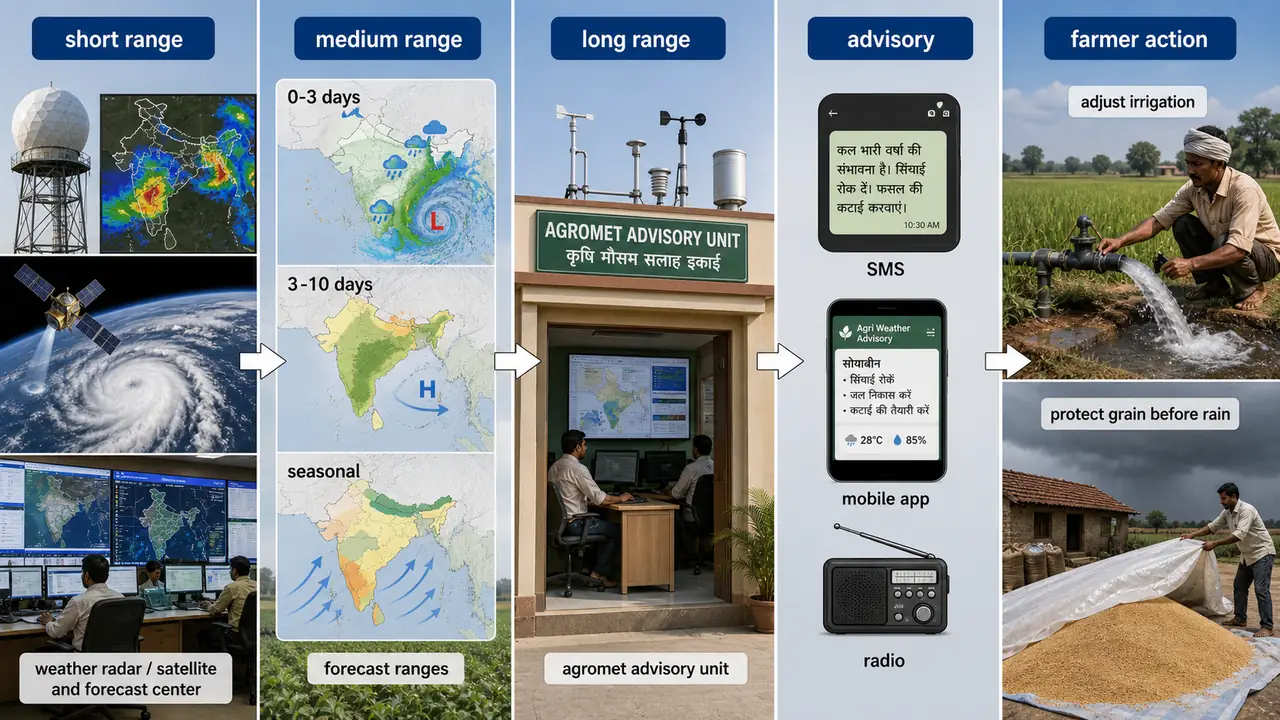
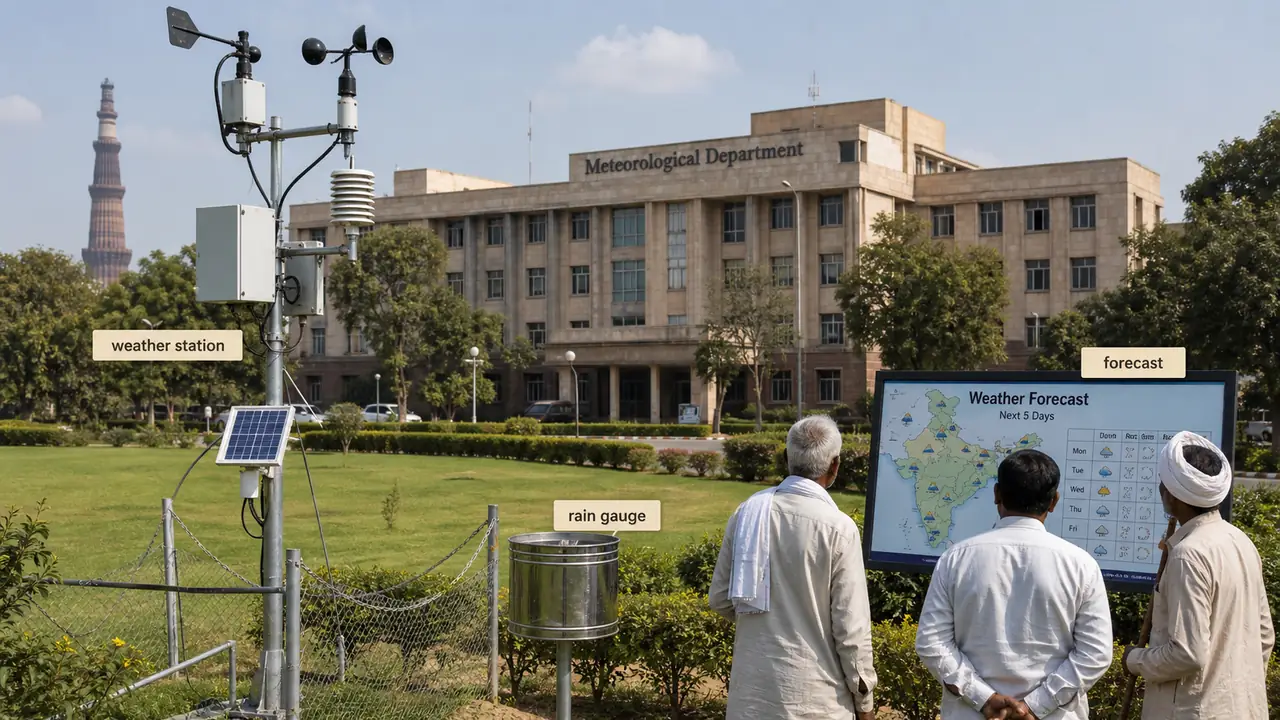
Weather Forecast Types
Drought monitoring is reactive — it tells us what has happened. Weather forecasting is proactive — it gives farmers advance warning to protect crops. Accurate weather forecasting is the first line of defence against drought and weather damage:
| Forecast Type | Validity Period | Primary Users | What It Predicts |
|---|---|---|---|
| Short range | Up to 72 hours | Farmers, marine agencies, public | Rainfall, heavy rain, heat/cold waves, thunderstorms |
| — Now casting | 0–2 hours | Same as above | Immediate weather conditions |
| — Very short range | 0–12 hours | Same as above | Near-term weather |
| Medium range | 3 to 10 days | Farmers | Rainfall occurrence, temperature trends |
| Long range | Beyond 10 days up to a month/season | Planners, policy makers | Monsoon rainfall; expressed as deviation from normal |
NOTE
Daily weather forecast in India is issued from Pune (IMD headquarters). Medium-range forecasts help farmers decide irrigation scheduling, while long-range forecasts help planners allocate seed and fertiliser.
Forecasting Methods
| Method | Best For | Approach |
|---|---|---|
| Synoptic | Short-range forecasts | Weather maps, pressure systems, fronts |
| Statistical | Short and long range forecasts | Historical data, statistical relationships |
IMD and Agro-Meteorological Services
Agricultural Meteorology Division (AMD)
- Established at Pune in 1932 — one of the oldest agro-met services worldwide.
- Services: GKMS (Gramin Krishi Mausam Seva), Agromet advisories, Training for AMFUs.
Integrated Agro-meteorological Advisory Service (IAAS)
| Milestone | Year | Detail |
|---|---|---|
| Weather broadcasts for farmers | 1945 | IMD radio broadcasts |
| State-level advisories | 1976 | Short-range forecast based |
| NCMRWF established | 1988 | Medium-range (3–10 day) numerical weather prediction |
| AMFUs created | — | 130 units across all 127 agroclimatic zones in SAUs/ICAR/IITs |
| IAAS launched | 1 April 2007 | IMD took over Agromet Advisory Service |
| DAAS launched | 2008 | District-level Agromet Advisory Service |
- IMD issues 5-day district-level forecasts twice a week using Multi-Model Ensemble technique.
- Seven parameters: rainfall, max/min temperature, wind speed/direction, RH, cloudiness.
- Advisories reach farmers through SMS, mobile apps, radio, TV, newspapers, Kisan Call Centres.
TIP
Exam tip: AMD = Pune, 1932. IAAS = 1 April 2007. DAAS = 2008. AMFUs = 130 units.
Growing Degree Days (GDD)
Weather forecasts predict what is coming; Growing Degree Days help predict where a crop stands in its development cycle. GDD is one of the most important tools in agricultural meteorology for predicting crop development and planning farm operations.
- Formula: GDD = (Tmax + Tmin) / 2 − Tbase
- Negative values are treated as zero (plants do not undergo negative growth).
- Base temperature = temperature below which plant growth is zero (e.g., 5°C for cereals).
- GDDs are accumulated daily from the beginning of the season.
- Used to compare growing season progress against long-term average and estimate maturity.
IMPORTANT
GDD is frequently asked as a formula question. Remember: negative GDD = zero, and base temp for cereals = 5°C.
Crop-Weather Modelling
Mathematical equations explaining crop interaction with environment, used to predict growth and yield. First used by Baier (1979).
| Model | Full Form | Application |
|---|---|---|
| CERES | Crop Environment Resource Synthesis | Rice, Maize, Sorghum, Wheat simulation |
| DSSAT | Decision Support System for Agro-technology Transfer | Climate change impact on rice (TN) |
| PRECIS | Providing Regional Climates for Impacts Studies | Regional climate projections |
| InfoCrop-RICE | — | Impact of high temp + elevated CO₂ on rice yield |
| CROPGRO-Groundnut | — | Climate change impact on groundnut (Anantapur, Junagadh) |
TIP
For exams: Baier (1979) = pioneer of crop-weather modelling. CERES = most versatile crop simulation model.
Length of Growing Period (LGP)
LGP is the period when moisture availability from rainfall exceeds half the potential evapotranspiration (PET). It determines what cropping system is viable:
LGP and Cropping System
| LGP (Days) | Viable Cropping System | Agricultural Example |
|---|---|---|
| < 75 | Perennial vegetation only | Rangelands in western Rajasthan |
| 75–140 | Sole cropping | Single crop of bajra or short-duration pulses |
| 140–180 | Intercropping | Sorghum + pigeonpea intercrop in Maharashtra |
| > 180 | Double cropping | Rice-wheat system in Punjab |
LGP and Climate Region
| LGP (Days) | Region |
|---|---|
| < 75 | Arid |
| 75–120 | Semi-Arid |
| > 120 | Humid |
IMPORTANT
LGP is the single most important parameter for deciding cropping intensity. Regions with LGP < 75 days are too dry for annual crops.
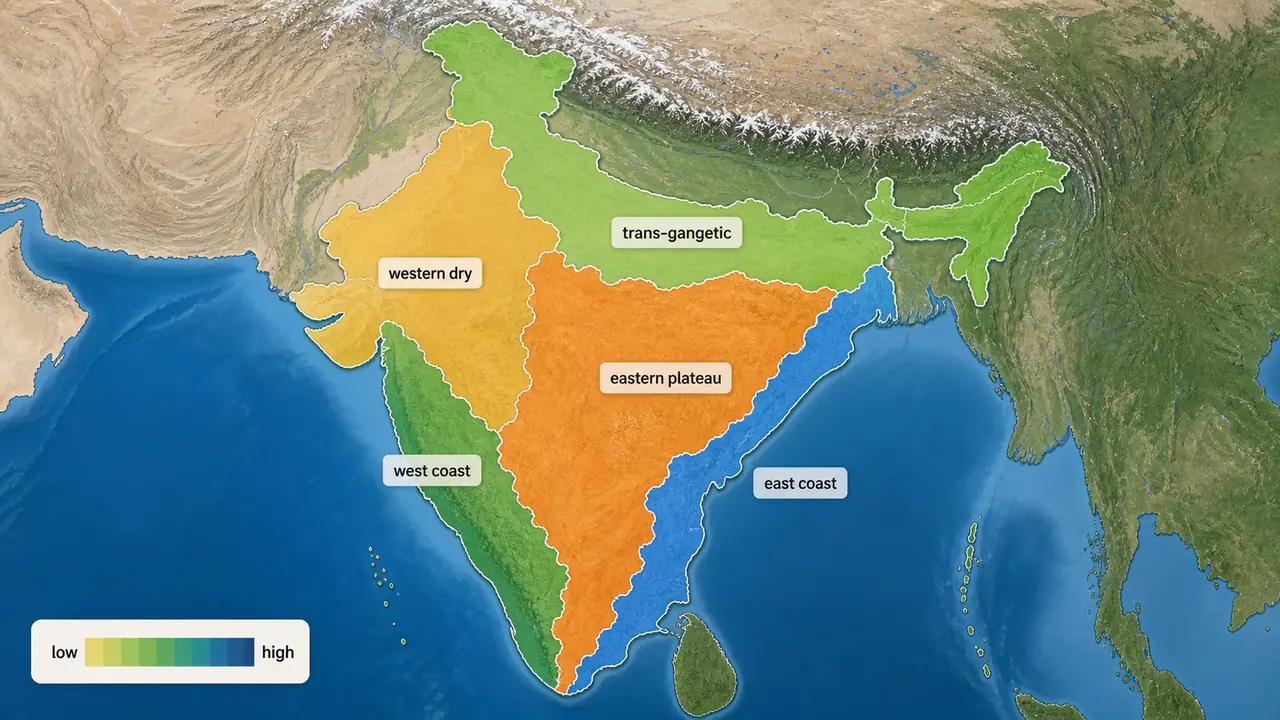
15 Agro-Climatic Zones of India (Planning Commission, 1989)

The Planning Commission of India (1989) divided the country into 15 agro-climatic regions based on rainfall, temperature, topography, cropping systems, and water resources.
All 15 Agro-Climatic Zones — Detailed
1. Western Himalayan Zone
| Feature | Detail |
|---|---|
| States | J&K, Himachal Pradesh, UP hills |
| Climate | Cool and humid |
| Rainfall | 750–1500 mm |
| Temperature | July: 5–30°C; January: -5 to 5°C |
| Soils | Skeletal, podsolic, hilly brown; silty loams prone to erosion |
| Crops | Winter: barley, oats, wheat; Kharif: rice (valleys), maize (hills) |
| Horticulture | Apple, peach, apricot, pear, cherry, almond, litchi, walnut |
| Special | Saffron grown here; cropping intensity lowest in J&K, highest in HP |
2. Eastern Himalayan Zone
| Feature | Detail |
|---|---|
| States | Sikkim, Darjeeling, Arunachal Pradesh, NE states, parts of WB |
| Climate | Humid and sub-humid |
| Rainfall | 1840–3530 mm |
| Crops | Rice, maize, potato, tea |
| Special | Shifting cultivation (Jhuming) in ~1/3 of cultivated area; major constraint: soil erosion |
3. Lower Gangetic Plains Zone
| Feature | Detail |
|---|---|
| States | West Bengal (lower Gangetic plain), Brahmaputra valley |
| Climate | Moist humid to dry humid |
| Rainfall | 1300–1600 mm |
| Soils | Mostly alluvial; flood-prone |
| Crops | Rice (main), jute, rapeseed, wheat |
4. Middle Gangetic Plains Zone
| Feature | Detail |
|---|---|
| States | 12 districts of eastern UP, 27 districts of Bihar |
| Area | 16 million hectares |
| Irrigation | 39% of gross cropped area |
| Cropping intensity | 142% |
| Rainfall | 1211–1470 mm |
| Crops | Sugarcane, paddy, maize, wheat |
5. Upper Gangetic Plains Zone
| Feature | Detail |
|---|---|
| States | 32 districts of central and western UP |
| Irrigation intensity | 131% (canals and tube wells) |
| Cropping intensity | 145% |
| Rainfall | 720–980 mm |
| Crops | Rice, wheat, sugarcane |
6. Trans-Gangetic Plains Zone
| Feature | Detail |
|---|---|
| States | Punjab, Haryana, Delhi, Chandigarh, Sriganganagar (Rajasthan) |
| Also called | Satluj Yamuna Plains |
| Climate | Semi-arid |
| Rainfall | 650–1250 mm |
| Key distinction | Highest net sown area, highest irrigated area, high cropping intensity, highest ground water utilisation |
| Crops | Wheat, sugarcane, cotton, rice, gram, maize, pulses, oilseeds |
7. Eastern Plateau and Hills Zone
| Feature | Detail |
|---|---|
| States | Eastern MP, southern WB, most of inland Odisha |
| Climate | Moist sub-humid to dry sub-humid |
| Rainfall | 1270–1435 mm |
| Soils | Red, yellow, laterites, alluvium; shallow to medium depth |
| Irrigation | Through tanks and tube wells |
| Crops | Rice, millets, maize, oilseeds, ragi, gram, potato |
| Special | Largest agro-climatic zone in India; deficient in water resources |
8. Central Plateau and Hills Zone
| Feature | Detail |
|---|---|
| States | 46 districts of MP, parts of UP and Rajasthan |
| Climate | Semi-arid to dry humid |
| Rainfall | 400–1550 mm |
| Rainfed area | 75% with low-value cereal crops |
| Soils | Mixed red, yellow, black; ravines present |
| Crops | Wheat, gram, jowar, bajra, paddy, millets, oilseeds, cotton |
| Constraint | Scarcity of water |
9. Western Plateau and Hills Zone
| Feature | Detail |
|---|---|
| States | Major part of Maharashtra, parts of MP, one district of Rajasthan |
| Climate | Semi-arid |
| Rainfall | 600–1040 mm (avg 904 mm) |
| Irrigated area | Only 12.4% |
| Soils | Regur (black) soil |
| Crops | Jowar, bajra, cotton, wheat |
| Special | Provides 50% of India's jowar; best quality orange, grape, and banana |
10. Southern Plateau and Hills Zone
| Feature | Detail |
|---|---|
| States | 35 districts of AP, Karnataka, and TN |
| Climate | Semi-arid |
| Dryland farming | 81% of area |
| Cropping intensity | 111% |
| Rainfall | 675–1000 mm |
| Crops | Coffee, cotton, tea, cardamom, spices |
11. East Coast Plains and Hills Zone
| Feature | Detail |
|---|---|
| States | East coast of TN, AP, and Odisha |
| Climate | Semi-arid and dry sub-humid |
| Rainfall | 780–1290 mm |
| Soils | Alluvial and coastal sands |
| Rainfed area | 75% |
| Crops | Rice, ragi, jowar, bajra |
| Special | Contributes 17.5% of India's groundnut production |
12. West Coast Plains and Ghats Zone
| Feature | Detail |
|---|---|
| States | West coast of TN, Kerala, Karnataka, Maharashtra, Goa |
| Rainfall | 2230–3650 mm (highest rainfall zone) |
| Soils | Laterite and coastal alluvial |
| Crops | Rice, ragi, groundnut, tapioca |
| Special | Spices and plantation crops along Western Ghats hill slopes |
13. Gujarat Plains and Hills Zone
| Feature | Detail |
|---|---|
| States | 19 districts of Gujarat |
| Climate | Arid and semi-arid |
| Irrigated area | Only 32.5% |
| Rainfed area | 78%; about 60% drought-prone |
| Rainfall | 340–1793 mm |
| Crops | Maize, wheat, groundnut, tobacco, cotton, jowar, bajra |
| Special | Known as "Oilseed Region" |
14. Western Dry Zone
| Feature | Detail |
|---|---|
| States | Nine districts of Rajasthan |
| Characteristics | Hot sandy desert; erratic rainfall; scanty vegetation; no perennial rivers |
| Rainfall | 95 mm (lowest in India) |
| Ground water | Deep and often brackish |
| Forest area | 1.2%; irrigated: 6.3% |
| Cropping intensity | 105% (lowest) |
| Crops | Bajra, gram, wheat, rapeseed |
| Special | Famine and drought are common features |
15. Islands Zone
| Feature | Detail |
|---|---|
| States | Andaman & Nicobar Islands and Lakshadweep |
| Climate | Equatorial |
| Rainfall | 3000 mm over 8–9 months |
| Crops | Rice, maize, millets, pulses, arecanut, turmeric, cassava |
| Special | Nearly half the cropped area under coconut |
Key Zone Facts for Exams
| Zone | Distinguishing Feature |
|---|---|
| Trans-Gangetic (Zone 6) | Highest net sown area, highest irrigated area, highest cropping intensity, highest groundwater use |
| Eastern Himalayan (Zone 2) | Shifting cultivation (Jhuming) |
| Eastern Plateau & Hills (Zone 7) | Largest agro-climatic zone |
| Gujarat Plains (Zone 13) | Oilseed zone; 60% drought-prone |
| Western Plateau (Zone 9) | 50% of India's jowar; best orange, grape, banana |
| Western Dry (Zone 14) | Lowest rainfall (95 mm); famine and drought zone |
| West Coast (Zone 12) | Highest rainfall (2230–3650 mm) |
| Western Himalayan (Zone 1) | Saffron cultivation |
ICAR Classification — 127 Agro-Climatic Zones (NARP)
Under the National Agricultural Research Project (NARP), ICAR advised State Agricultural Universities to divide each state into sub-zones based on rainfall, cropping pattern, and administrative units. This yielded 127 agro-climatic zones. ICAR's climate classification uses Moisture Deficit Index (MDI) under the All India Coordinated Research Project on Dryland Agriculture, specifically designed for agricultural planning in dryland areas.
State-wise NARP Zones (Selected)
| State | Zones | State | Zones |
|---|---|---|---|
| Madhya Pradesh | 12 (most) | Uttar Pradesh | 10 |
| Karnataka | 10 | Rajasthan | 9 |
| Odisha | 9 | Maharashtra | 9 |
| Gujarat | 8 | Kerala | 8 |
| Andhra Pradesh | 7 | Tamil Nadu | 7 |
| West Bengal | 6 | Assam | 6 |
| Bihar | 6 | NE Hill region | 6 |
| Punjab | 5 | J&K | 4 |
| Himachal Pradesh | 4 | Haryana | 2 |
Key Numbers for Exams
| Classification | Number | Authority |
|---|---|---|
| Agro-climatic regions (Planning Commission) | 15 | Planning Commission, 1989 |
| Agro-climatic zones (NARP) | 127 | ICAR/NARP |
| Total ACZs (ICAR reclassification) | 131 | ICAR |
| Agro-ecosystems under NARP | 5 | ICAR |
| Agro-ecological regions (NBSS&LUP) | 20 | NBSS&LUP/ICAR |
| State with most NARP zones | Madhya Pradesh (12) | ICAR |
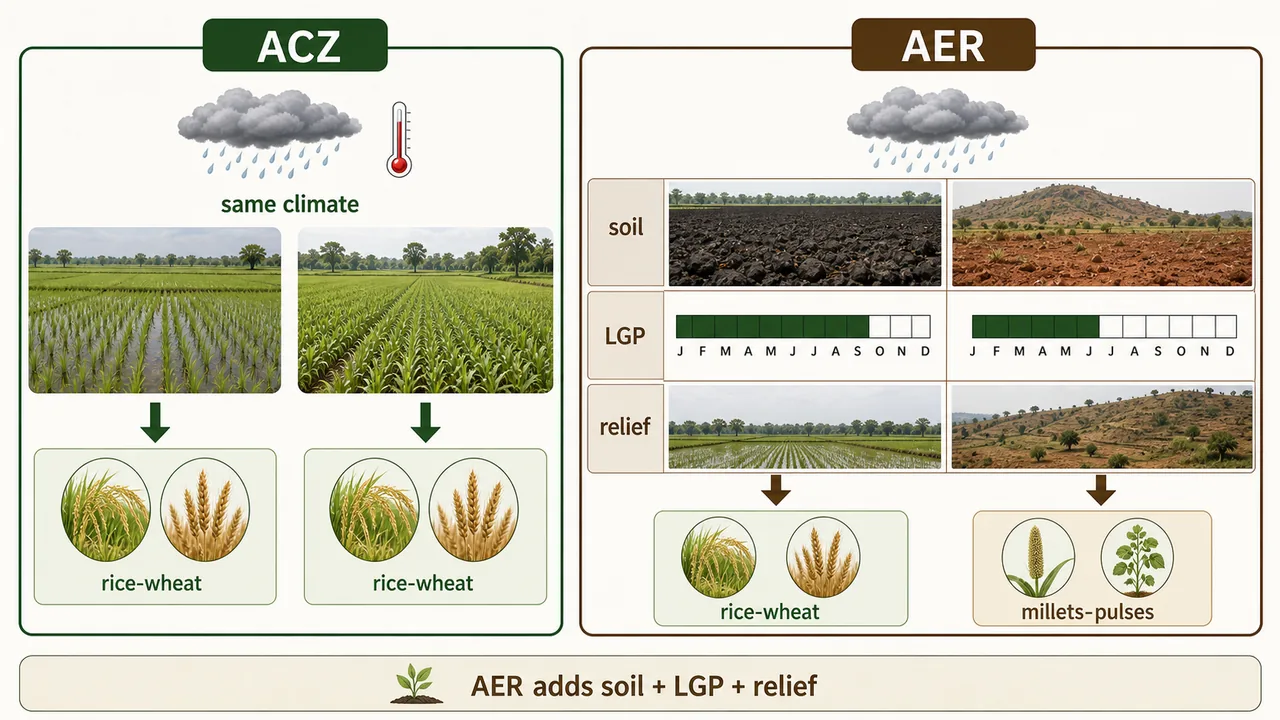
20 Agro-Ecological Regions (NBSS & LUP)
The National Bureau of Soil Survey and Land Use Planning (NBSS & LUP) of ICAR delineated 20 agro-ecological regions (AERs) using the FAO 1978 concept — superimposing length of growing periods and bio-climate maps on soil physiographic maps.
All 20 Agro-Ecological Regions
| Ecosystem | No. | Region | Key States | Eco-region | Soil Type |
|---|---|---|---|---|---|
| Arid | 1 | Western Himalaya | J&K, HP | Cold Arid | Shallow skeletal |
| Arid | 2 | Deccan Plateau | AP, Karnataka | Hot Arid | Red & Black |
| Arid | 3 | Western Plain, Kutch, part of Kathiawar | Gujarat, Rajasthan, Haryana, Punjab | Hot Arid | Desert & Saline |
| Semi-Arid | 4 | Northern Plain & Central Highlands (Aravallis) | Gujarat, Rajasthan, UP, MP, Haryana, Punjab | Hot Semi-Arid | Alluvium Derived |
| Semi-Arid | 5 | Central (Malwa) Highlands, Gujarat Plains | Gujarat, MP | Hot Semi-Arid | Medium & Deep Black |
| Semi-Arid | 6 | Deccan Plateau | Karnataka, AP, Maharashtra, MP | Hot Semi-Arid | Shallow & Medium Black |
| Semi-Arid | 7 | Deccan (Telangana) Plateau & Eastern Ghats | AP | Hot Semi-Arid | Red and Black |
| Semi-Arid | 8 | Eastern Ghats, TN Uplands, Deccan (Karnataka) Plateau | Karnataka, TN, Kerala | Hot Semi-Arid | Red Loamy |
| Sub-Humid | 9 | Northern Plain | Bihar, UP, Punjab | Hot Sub-humid (dry) | Alluvium-derived |
| Sub-Humid | 10 | Central Highlands (Malwa, Bundelkhand, Eastern Satpura) | MP, Maharashtra | Hot Sub-humid | Black & Red |
| Sub-Humid | 11 | Eastern Plateau (Chhattisgarh) | MP | Hot Sub-humid | Red & Yellow |
| Sub-Humid | 12 | Eastern Plateau (Chhota Nagpur) & Eastern Ghats | Odisha, WB, Bihar, MP, Maharashtra | Hot Sub-humid | Red & Laterite |
| Sub-Humid | 13 | Eastern Plain | UP, Bihar | Hot Sub-humid (moist) | Alluvium-derived |
| Sub-Humid | 14 | Western Himalayas | J&K, HP, UP | Warm Sub-humid to humid | Brown Forest & Podzolic |
| Humid/Per-humid | 15 | Bengal & Assam Plains | WB, Assam | Hot Sub-humid to Humid | Alluvium derived |
| Humid/Per-humid | 16 | Eastern Himalayas | Arunachal Pradesh, Sikkim, WB | Warm Per-humid | Brown & Red Hill |
| Humid/Per-humid | 17 | NE Hills (Purvanchal) | Tripura, Mizoram, Meghalaya | Warm Per-humid | Red & Lateritic |
| Coastal | 18 | Eastern Coastal Plain | TN, Puducherry, AP, Odisha, WB | Hot Sub-humid to Semi-arid | Coastal Alluvium |
| Coastal | 19 | Western Ghats & Coastal Plain | Kerala, Goa, Maharashtra, Gujarat | Hot Humid Per-humid | Red, Lateritic, Alluvium |
| Island | 20 | Andaman-Nicobar & Lakshadweep | A&N, Lakshadweep | Hot Humid Per-humid | Red Loamy & Sandy |
AER Ecosystem Distribution
| Ecosystem Type | Number of AERs |
|---|---|
| Arid | 3 |
| Semi-Arid | 5 |
| Sub-Humid | 6 |
| Humid/Per-humid | 3 |
| Coastal | 2 |
| Island | 1 |
| Total | 20 |
Climate Classification Systems
Agro-climatic zones are practical divisions for planning. Climate classification systems provide the scientific framework behind those divisions. Different scientists have classified climate using different criteria:
| Classification By | Basis | Key Detail |
|---|---|---|
| De Candolle | Vegetation | Earliest; plant-based |
| Koppen (1884, modified 1918, 1936) | Mean monthly temperature and mean annual rainfall | Most widely used; first quantitative classification; 5 groups |
| Thornthwaite (1931) | P/E ratio and P/E index (sum of 12 monthly P/E ratios) | Recognised runoff and percolation losses; 6 temperature provinces (Tropical to Frost) |
| Thornthwaite and Mather (1948) | Moisture index (Im), PET | Im = 100 × [(P − PE) / PE]; modified by Mathur (1955) |
| Troll (1965) | Temperature and duration of humid months | Classification called "Seasonal Climates of the Earth"; humid month = month where P > PET; modified by ICRISAT for India |
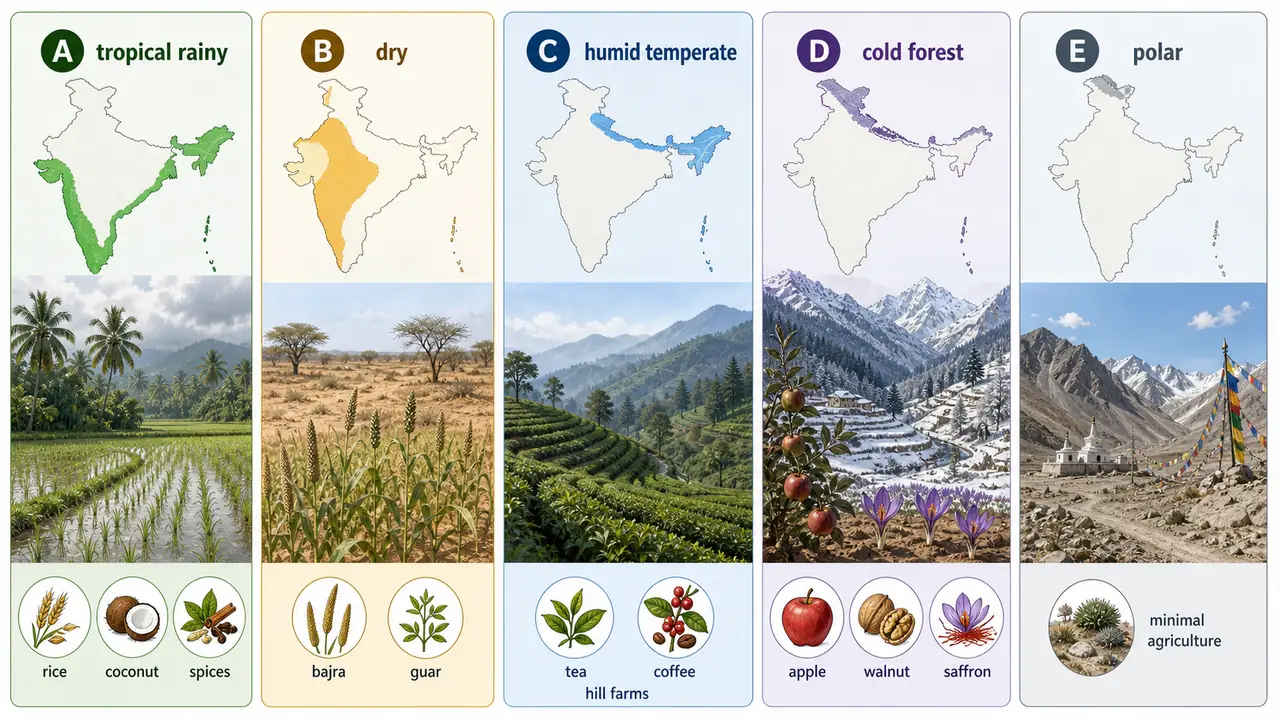
Koppen Classification (A, B, C, D, E)
Koppen divided climate into five categories:
| Group | Climate Type | Temperature/Precipitation Criteria | Indian Agricultural Region |
|---|---|---|---|
| A | Tropical rainy | Coolest month > 18°C; P > E | Kerala, coastal Karnataka — rice, coconut, spices |
| B | Tropical dry | Coolest month > 18°C; P < E | Rajasthan, Gujarat — bajra, guar, drought-tolerant crops |
| C | Humid temperate rainy | Coolest month 18°C to -3°C | Nilgiris, Western Ghats hills — tea, coffee |
| D | Cold forest | Coolest month < -3°C; precipitation as snow | Kashmir, HP — apple, walnut, saffron |
| E | Polar | Warmest month < 10°C | Ladakh — minimal agriculture |
TIP
Exam fact: Groups A, C, D, E are classified based on temperature. Group B is the only one classified based on rainfall (precipitation vs evaporation).
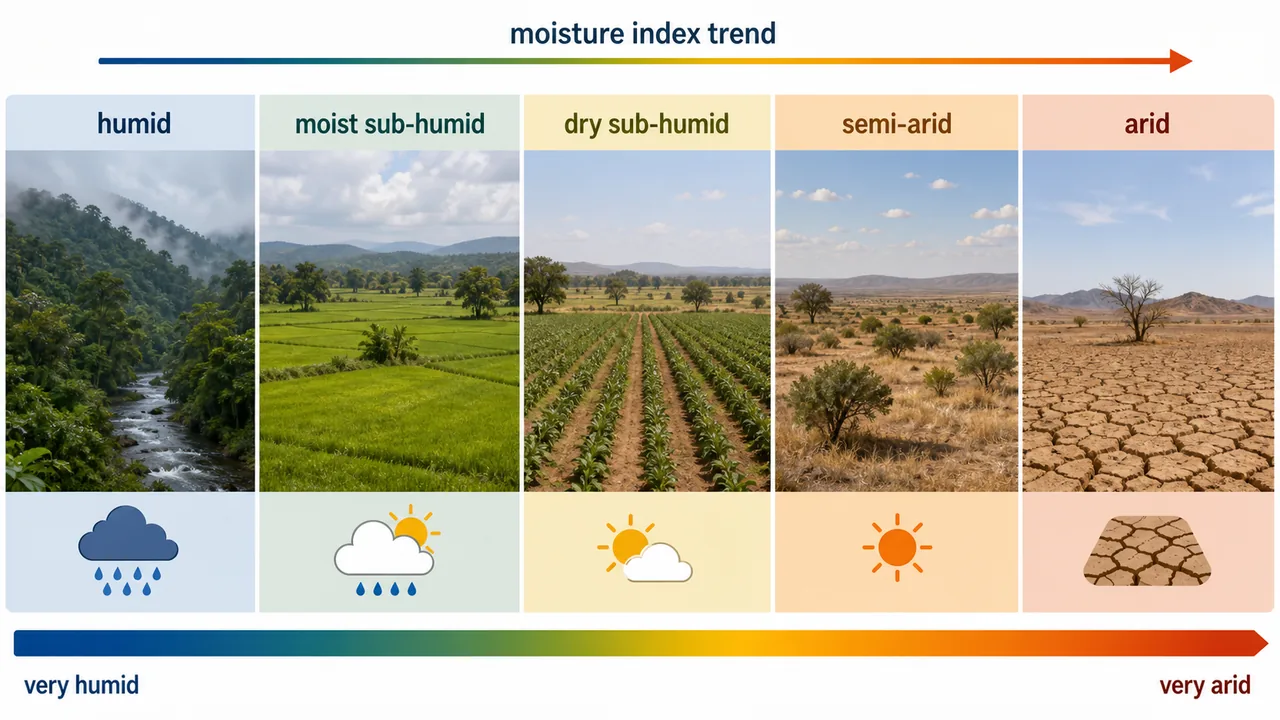
Thornthwaite Classification — Moisture Index (Im)
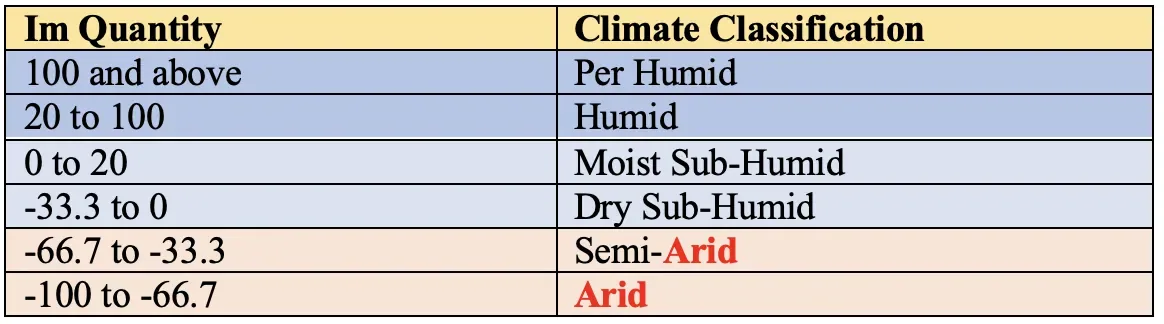
| Im Value | Climate | Agricultural Viability |
|---|---|---|
| 100 and above | Per humid | Plantation crops; waterlogging risk |
| 20 to 100 | Humid | Rice, jute, tea |
| 0 to 20 | Moist sub-humid | Wheat, maize with some irrigation |
| -33.3 to 0 | Dry sub-humid | Rainfed millets, pulses |
| -66.7 to -33.3 | Semi-arid | Sorghum, groundnut, cotton |
| -100 to -66.7 | Arid | Only drought-tolerant crops with irrigation |
Moisture Deficit Index formula: MDI = 100 (P - PET) / PET
NOTE
Thornthwaite classified climate based on PE index, TE index, and seasonal distribution of rainfall. Optimum years of weather data for defining climate: 31 years.
Meteorological Institutions
The classification systems above were developed by international scientists, but India's own meteorological infrastructure implements them. These institutions and their founding details are frequently asked in exams.
| Institution | Location & Year | Key Function |
|---|---|---|
| IMO (International Meteorological Organization) | Geneva, 1873 | Predecessor of WMO |
| IMD (Indian Meteorological Department) | Calcutta, 1875 (later Shimla → Pune → New Delhi) | India's weather forecasting authority |
| WMO (World Meteorological Organization) | Switzerland, 1950 | Global weather coordination |
| IITM (Indian Institute of Tropical Meteorology) | Pune, 1962 | Monsoon and tropical weather research |
| IIRS (Indian Institute of Remote Sensing) | Dehradun, 1966 | Remote sensing for agriculture |
| NCMRWF | New Delhi, 1988 | Medium range weather forecasting |
| NRSA (National Remote Sensing Agency) | Hyderabad | Satellite-based crop monitoring |
WARNING
Common exam confusion: IMO (1873, Geneva) is the predecessor of WMO (1950). IMD was established in Calcutta in 1875, not Pune or Delhi (those were later shifts).
Agro-Meteorological Observatory Standards
| Standard | Specification |
|---|---|
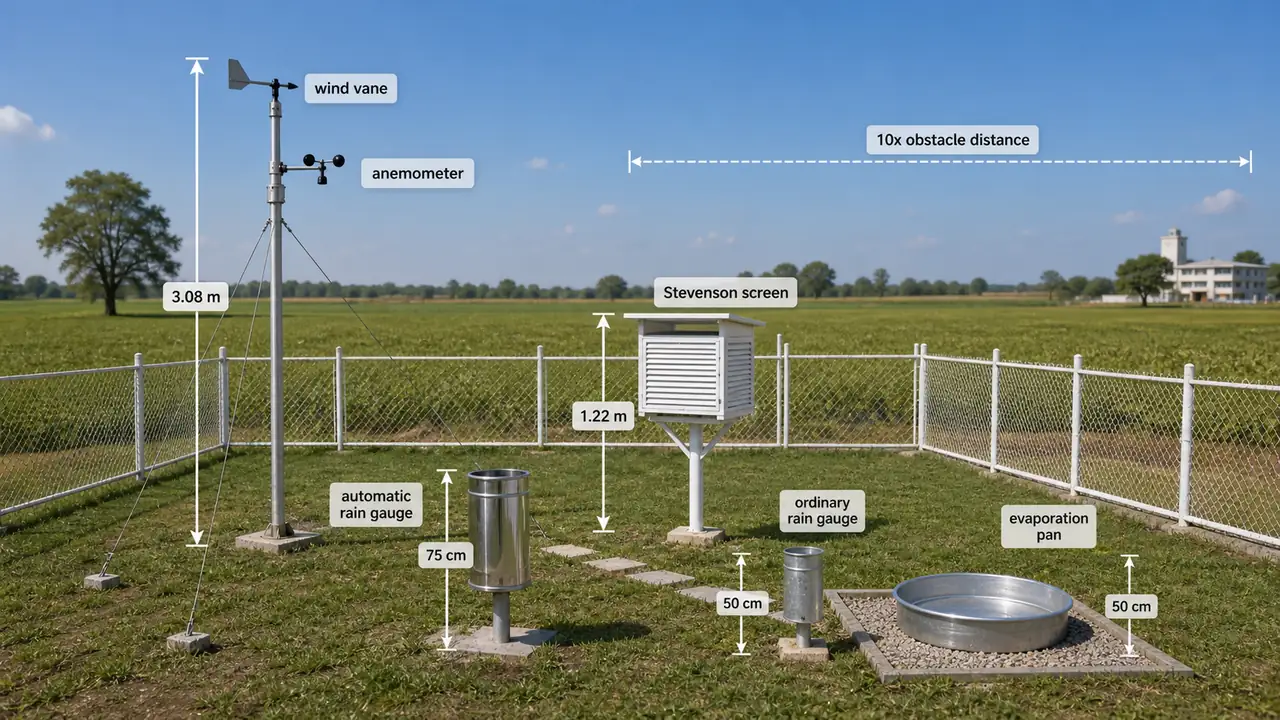
| Distance from buildings/trees | 10 times the height of the obstacle |
| Plot size | 60 m (N-S) x 40 m (E-W) |
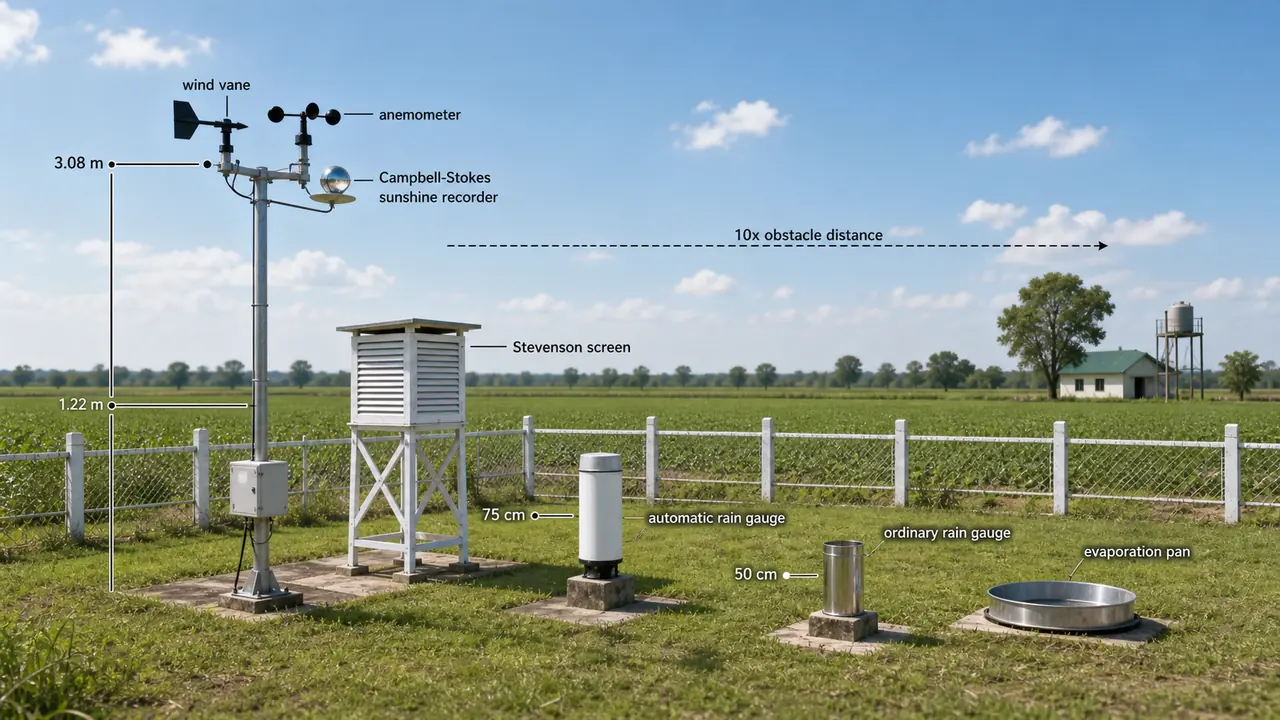
Meteorological Instruments — Heights and Uses
Every agro-meteorological observatory follows standardised placement rules to ensure consistent, comparable data. The heights below and the instrument-function pairings are heavily tested in competitive exams.
Standard Heights from Ground Level
| Instrument | Height | What It Measures |
|---|---|---|
| Sunshine recorder, Anemometer, Wind vane | 3.08 m | Sunshine hours, wind speed, wind direction |
| Stevenson screen | 1.22 m | Houses thermometers (max, min, dry/wet bulb) |
| Automatic rain gauge | 75 cm | Continuous rainfall recording |
| Ordinary rain gauge, Evaporation pan | 50 cm | Daily rainfall, evaporation |
Key Instruments and Their Uses
| Instrument | Measures | Agricultural Use |
|---|---|---|
| IR Gun / Infrared Thermometer | Plant canopy surface temperature (8–14 μm range) | Estimates crop water stress without contact |
| Net Radiometer | Net radiation at earth's surface | Energy balance studies |
| Quantum Sensor | PAR above crop canopy | Light availability for photosynthesis |
| Tube Solarimeter | PAR reaching ground through crop canopy | Canopy light interception efficiency |
| Pyradiometer | Both long-wave and short-wave radiation | Total radiation balance studies |
| Assaman Psychrometer | RH in open and crop canopy | Humidity monitoring for pest management |
| Hygrograph | Continuous record of RH | Long-term humidity tracking |
| Rain Gauge | Rainfall | Basic rainfall measurement |
| Pluviograph | Continuous rainfall record | Rainfall intensity analysis |
| Drosometer / Dew Gauge | Dew measurement | Dew contribution to dryland crops |
| USWB Evaporimeter / Atmometer | Evaporation | Irrigation scheduling |
| Cone Penetrometer | Soil mechanical resistance | Tillage planning |
| Fortin Barometer (Mercurial) | Most accurate atmospheric pressure | Weather station standard |
| Barograph | Continuous atmospheric pressure | Pressure trend monitoring |
Evapotranspiration, Soil, and Water Instruments
| Instrument | Measures | Key Detail |
|---|---|---|
| Lysimeter | Evapotranspiration (ET) | Most accurate method for measuring ET; large soil container with vegetation |
| Tensiometer | Soil moisture tension | Range: 0–0.8 bar; widely used for irrigation scheduling |
| Infiltrometer | Infiltration rate | Double-ring type; measures vertical water entry into soil |
| Permeameter | Hydraulic conductivity | Measures rate of water flow through soil |
| Piezometer | Depth of water table / groundwater pressure | Monitoring well water levels |
Temperature and Frost Instruments
| Instrument | Measures | Key Detail |
|---|---|---|
| Cryometer | Temperature below 0°C | Uses alcohol instead of mercury (Hg freezes at −39°C) |
| Infra-Red Thermometer | Canopy temperature | Indicator of crop water stress (stressed crops = higher canopy temp) |
Plant Growth and Physiology Instruments
| Instrument | Measures | Key Detail |
|---|---|---|
| Auxanometer | Plant growth | Mechanical growth measurement device |
| Crescograph | Minute plant growth | Invented by Sir J.C. Bose; magnifies growth up to 10,000× |
| Potometer | Transpiration | Measures water uptake rate by cut shoot |
| Porometer | Stomatal opening area | Indicates plant water status and photosynthetic activity |
| Pressure Chamber / Thermocouple | Leaf water potential | Measures plant water stress directly |
| Pressure Membrane Apparatus | Moisture equivalents | Soil water retention curves |
Density and Liquid Instruments
| Instrument | Measures | Key Detail |
|---|---|---|
| Hydrometer | Relative density of liquids | Used in soil particle size analysis |
| Lactometer | Fat percentage in milk | Dairy quality testing |
| Pycnometer | Soil specific gravity | Soil physical property determination |
Exam-Important Rapid-Fire Facts
Quick-Reference Facts for Competitive Exams
Atmosphere and Radiation
- Average temperature of earth surface: 14–15°C
- 50% of atmospheric mass below 5.6 km
- 90% below 16 km; 99% below 40 km
- Air density at sea level: 1.2 kg/m³
- Density decreases with height
- Diurnal temperature variation: up to 16°C
- Seasonal variation: less near equator
- Incoming solar radiation: short wave (visible)
- Outgoing earth radiation: long wave (infrared)
- Temperatures at tropopause, stratopause, mesopause remain constant
Pressure and Wind
- Equatorial low-pressure belt: Doldrums (5°N and S)
- Atmospheric pressure = force per unit area
- Most accurate pressure instrument: Fortin barometer
Humidity
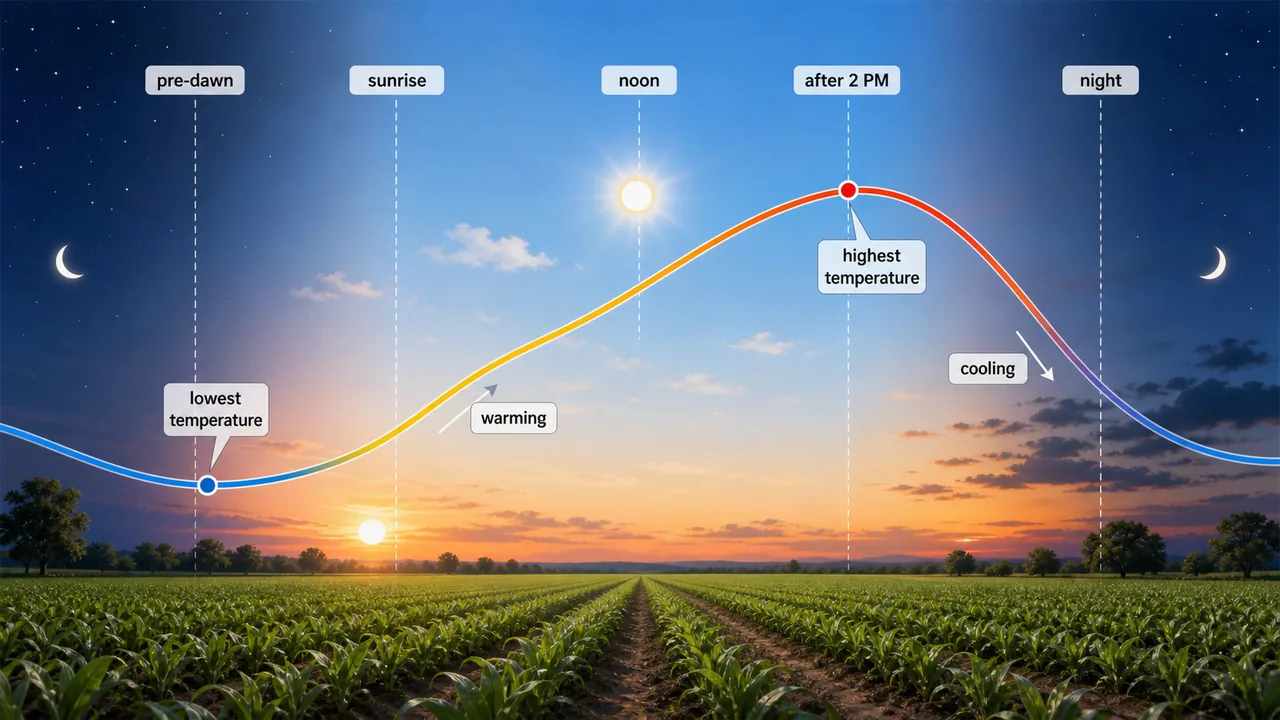
- Maximum RH: morning; Minimum RH: afternoon
- RH = 100% when temperature = dew point
- Pest incidence higher at higher RH
Agriculture-Specific
- Plant hardening causes: increased sugar concentration
- Highest solar energy utilisation: Sugarcane (10–12%)
- Acid rain caused by: SO₂ and NO₂
- Frost damage worst on: sandy soils
- Hailstorms: before onset and after withdrawal of monsoon
- Optimum weather data for climate: 31 years
- Weather data from sloppy land: Topo climate
- Weather data from standing crop: Microclimate
- Conversion efficiency: 3,700 to 4,100 cal/g of dry matter
- Oldest light intensity unit: Lux
- Biological amplification of DDT: Bio-magnification
- Atmospheric gases are in: mixed states
Summary Table
| Topic | Key Fact | Exam Value |
|---|---|---|
| Drought — dry spell | No rain for > 15 days continuously | Definition |
| Drought cascade | Met → Agri → Hydro → Socio-economic | Sequence |
| Meteorological drought | Rainfall < 75% of normal; Moderate: 26–50% deficit; Severe: >50% | Threshold |
| Agricultural drought sub-types | Early, Mid, Late, Chronic, Apparent (EML-CA) | Mnemonic |
| Drought year | Rainfall ≤ 75% of normal | Definition |
| Drought-prone area | Severe/moderate drought ≥ 20% of years | Definition |
| Chronic drought area | Severe/moderate drought ≥ 40% of years | Definition |
| Palmer Drought Index | Palmer, USA, 1965 | Index |
| AAI | IMD weekly drought monitoring | Index |
| MAI | P at 50% probability / PET × 100 | Index |
| NDVI | Satellite-based vegetation index for drought | Index |
| NADAMS | NRSA, Dehradun; satellite drought monitoring | Monitoring |
| Terminal drought | Early cessation of monsoon; rainfed rice fails | Crop-specific |
| Chronic drought | Growing period only 6–7 weeks | Duration |
| Short-range forecast | Up to 72 hours | Time period |
| Synoptic method | Best for short-range forecasts | Method |
| Statistical method | Best for short and long range forecasts | Method |
| Long-range forecast | Beyond 10 days to a season | Time period |
| AMD established | Pune, 1932 | Institution |
| IAAS launched | 1 April 2007 | Institution |
| DAAS launched | 2008 | Institution |
| AMFUs | 130 units | Institution |
| GDD formula | (Tmax + Tmin)/2 − Tbase; negative = zero | Formula |
| GDD base temp (cereals) | 5°C | Threshold |
| Crop-weather modelling | Baier (1979); CERES, DSSAT, PRECIS | Models |
| Thornthwaite (1931) | P/E ratio, P/E index, 6 temperature provinces | Classification |
| Troll (1965) | "Seasonal Climates of the Earth"; humid month = P > PET; modified by ICRISAT | Classification |
| LGP < 75 days | Arid; perennial vegetation only | Classification |
| LGP 140–180 days | Intercropping viable | System choice |
| Planning Commission zones | 15 agro-climatic regions (1989) | Number |
| NARP zones | 127 (ICAR: 131) | Number |
| ICAR classification | Under All India Coordinated Research Project on Dryland Agriculture | Classification |
| NBSS&LUP regions | 20 agro-ecological regions | Number |
| Trans-Gangetic Zone | Highest irrigation, sown area, cropping intensity | Zone identification |
| Eastern Plateau & Hills | Largest agro-climatic zone | Zone identification |
| Western Dry Zone | Lowest rainfall (95 mm) | Zone identification |
| Koppen — Group B | Only group classified by rainfall, not temperature | Classification basis |
| IMD established | Calcutta, 1875 | Institution question |
| WMO established | Switzerland, 1950 | Institution question |
| Lysimeter | Most accurate ET measurement | Instrument |
| Tensiometer | Soil moisture tension, 0–0.8 bar | Instrument |
| Crescograph | J.C. Bose; 10,000× magnification | Instrument |
| Stevenson screen height | 1.22 m | Instrument height |
| Rain gauge height | 50 cm | Instrument height |
Summary Cheat Sheet
| Concept / Topic | Key Details |
|---|---|
| Drought dry spell | No rain for > 15 days continuously |
| Drought cascade | Met → Agri → Hydro → Socio-economic |
| Meteorological drought | Rainfall < 75% of normal; Moderate 26–50%; Severe >50% |
| Agricultural drought sub-types | Early, Mid, Late, Chronic, Apparent (EML-CA) |
| Drought year | Rainfall ≤ 75% of normal |
| Drought-prone area | Drought in ≥ 20% of years |
| Chronic drought area | Drought in ≥ 40% of years |
| Palmer Drought Index | Palmer, USA, 1965 |
| AAI | IMD weekly drought monitoring |
| MAI | P at 50% probability / PET × 100 |
| NDVI | Satellite-based vegetation drought index |
| SPI | Standardised Precipitation Index (monthly) |
| NADAMS | NRSA, Dehradun; satellite drought monitoring |
| Terminal drought | Early cessation of monsoon; rainfed rice fails |
| Chronic drought | Growing period only 6-7 weeks |
| Short-range forecast | Up to 72 hours |
| Synoptic method | Best for short-range |
| Statistical method | Best for short + long range |
| Long-range forecast | Beyond 10 days to a season |
| AMD established | Pune, 1932 |
| IAAS launched | 1 April 2007 |
| DAAS launched | 2008 |
| AMFUs | 130 units |
| GDD formula | (Tmax + Tmin)/2 − Tbase; negative = zero; cereals Tbase = 5°C |
| Crop-weather modelling | Baier (1979); CERES, DSSAT, PRECIS, InfoCrop-RICE, CROPGRO-Groundnut |
| Thornthwaite (1931) | P/E ratio, P/E index, 6 temperature provinces |
| Troll (1965) | "Seasonal Climates of the Earth"; humid month = P > PET; modified by ICRISAT |
| ICAR classification | Under All India Coordinated Research Project on Dryland Agriculture |
| LGP < 75 days | Arid; perennial vegetation only |
| LGP 140-180 days | Intercropping viable |
| Planning Commission zones | 15 agro-climatic regions (1989) |
| NARP zones | 127 (ICAR: 131) |
| NBSS&LUP regions | 20 agro-ecological regions |
| Trans-Gangetic Zone | Highest irrigation, sown area, cropping intensity |
| Eastern Plateau & Hills | Largest agro-climatic zone |
| Western Dry Zone | Lowest rainfall (95 mm) |
| Koppen Group B | Only group classified by rainfall, not temperature |
| IMD established | Calcutta, 1875 |
| WMO established | Switzerland, 1950 |
| Lysimeter | Most accurate ET measurement |
| Tensiometer | Soil moisture tension 0–0.8 bar |
| Crescograph | J.C. Bose; 10,000× magnification |
| Stevenson screen height | 1.22 m |
| Rain gauge height | 50 cm |
| Optimum climate data | 31 years |
Lesson Doubts
Ask questions, get expert answers