📊 Microsoft Excel
VLOOKUP, XLOOKUP, ROUND, MID, Pivot Tables, Data Validation, IF functions, cell references, and formulas for UPSSSC AGTA.
What is Microsoft Excel?
Microsoft Excel is a spreadsheet application developed by Microsoft. It is used for data entry, calculations, data analysis, charts, and reporting. An Excel file is called a Workbook and contains one or more Worksheets (sheets).
- Default file extension: .xlsx (older: .xls)
- A worksheet has rows (numbered 1, 2, 3...) and columns (lettered A, B, C...)
- The intersection of a row and column is a Cell (e.g., cell B3 = column B, row 3)
- A1 is the default first cell of a worksheet: column A and row 1
- Total rows in Excel: 10,48,576 | Total columns: 16,384 (XFD)
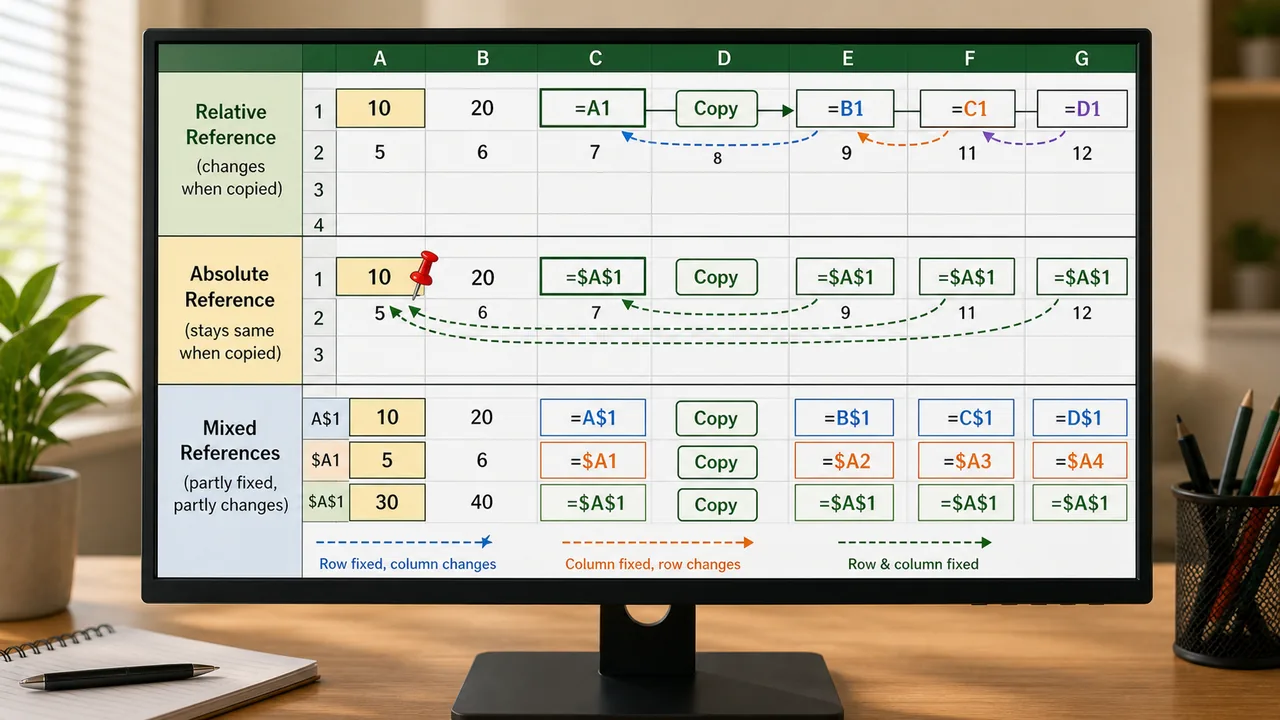
Cell References
| Type | Example | Behavior when copied |
|---|---|---|
| Relative | A1 | Changes with position (default) |
| Absolute | 1 | Never changes (locked) |
| Mixed | 1 | Column or row locked, other changes |
Absolute reference uses $ sign. Press F4 to toggle between reference types while editing a formula.
Essential Functions
Mathematical Functions
| Function | Syntax | Purpose | Example |
|---|---|---|---|
| SUM | =SUM(A1:A10) | Adds values | Sum of A1 to A10 |
| AVERAGE | =AVERAGE(A1:A10) | Mean value | Average of range |
| ROUND | =ROUND(3.456, 2) | Rounds to digits | Result: 3.46 |
| ROUNDUP | =ROUNDUP(3.421, 1) | Always rounds up | Result: 3.5 |
| ROUNDDOWN | =ROUNDDOWN(3.789, 1) | Always rounds down | Result: 3.7 |
| INT | =INT(5.9) | Integer part only | Result: 5 |
| MOD | =MOD(10, 3) | Remainder | Result: 1 |
| POWER | =POWER(2, 3) | Exponent | Result: 8 |
| MAX | =MAX(A1:A10) | Largest value | — |
| MIN | =MIN(A1:A10) | Smallest value | — |
Counting Functions
| Function | Purpose |
|---|---|
| COUNT | Counts cells with numbers only |
| COUNTA | Counts all non-empty cells |
| COUNTBLANK | Counts empty cells |
| COUNTIF | Counts cells matching a condition — =COUNTIF(A1:A10, ">50") |
Text Functions
| Function | Syntax | Result |
|---|---|---|
| MID | =MID("COMPUTER", 4, 3) | PUT (start at 4th char, take 3) |
| LEFT | =LEFT("HELLO", 3) | HEL |
| RIGHT | =RIGHT("HELLO", 2) | LO |
| LEN | =LEN("AGTA") | 4 |
| TRIM | =TRIM(" Hi ") | "Hi" (removes extra spaces) |
| UPPER | =UPPER("hello") | HELLO |
| LOWER | =LOWER("HELLO") | hello |
| PROPER | =PROPER("john doe") | John Doe |
| CONCATENATE | =CONCATENATE("Hi"," ","There") | Hi There |
| SUBSTITUTE | =SUBSTITUTE("Cat","C","B") | Bat |
Lookup Functions
VLOOKUP (Vertical Lookup)
VLOOKUP searches for a value in the first column of a table and returns a value from a specified column.
Syntax: =VLOOKUP(lookup_value, table_array, col_index_num, [range_lookup])
| Parameter | Meaning |
|---|---|
| lookup_value | Value to search for |
| table_array | Range to search in |
| col_index_num | Column number to return (1, 2, 3...) |
| range_lookup | FALSE = exact match, TRUE = approximate |
Example: =VLOOKUP("Wheat", A2:C100, 3, FALSE) — finds "Wheat" in column A, returns value from column C.
HLOOKUP
Same as VLOOKUP but searches in the first row (horizontal).
XLOOKUP (Modern — Excel 365)
XLOOKUP is the newer, more flexible replacement for VLOOKUP/HLOOKUP.
Syntax: =XLOOKUP(lookup_value, lookup_array, return_array)
- Can search left (VLOOKUP cannot)
- No need to count column numbers
- Handles errors with built-in if_not_found parameter
INDEX-MATCH
=INDEX(return_range, MATCH(lookup_value, lookup_range, 0)) — more flexible than VLOOKUP, can look in any direction.
Logical Functions
| Function | Syntax | Purpose |
|---|---|---|
| IF | =IF(A1>50, "Pass", "Fail") | Returns value based on condition |
| AND | =AND(A1>10, B1<20) | TRUE if ALL conditions are true |
| OR | =OR(A1>10, B1<20) | TRUE if ANY condition is true |
| NOT | =NOT(A1>50) | Reverses TRUE/FALSE |
| IFERROR | =IFERROR(A1/B1, "Error") | Returns custom value if error |
Nested IF: =IF(A1>=90, "A", IF(A1>=75, "B", IF(A1>=60, "C", "F")))
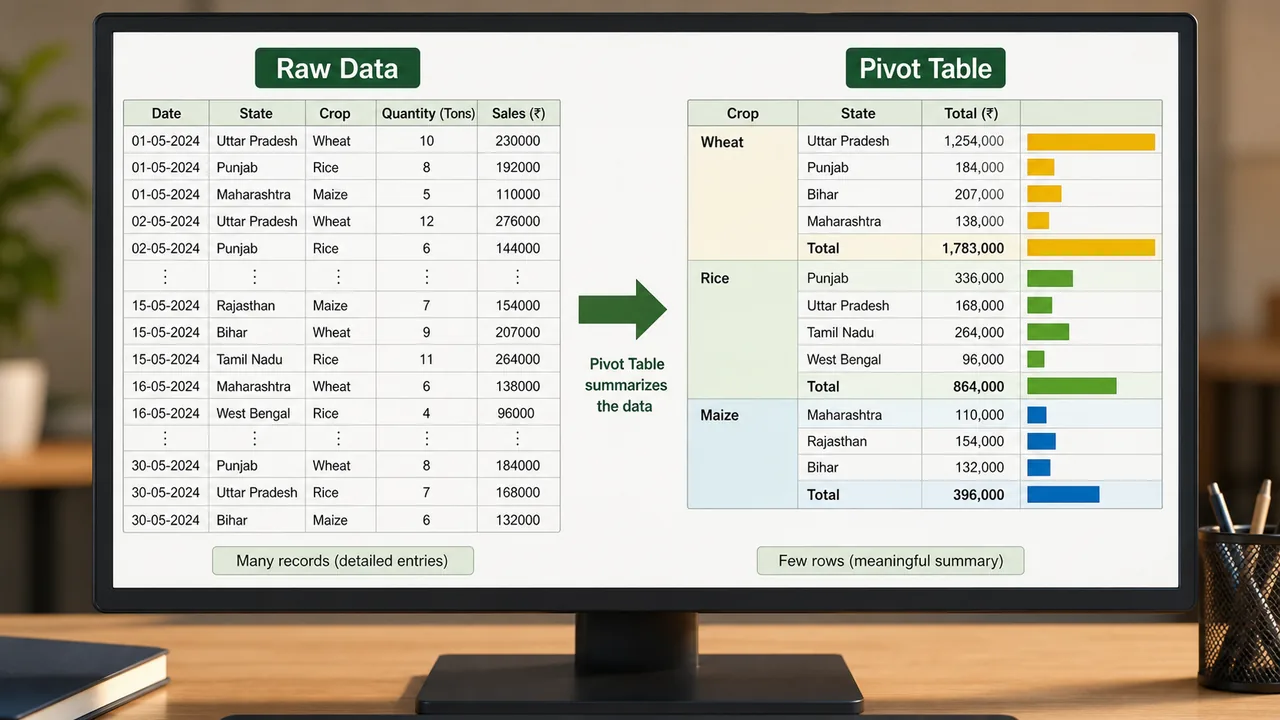
Pivot Tables
A Pivot Table summarizes large datasets into a compact, interactive table.
- Purpose: Quickly analyze data — sum, count, average by categories
- Create: Select data → Insert tab → PivotTable
- Components: Rows, Columns, Values (Sum/Count/Average), Filters
- Example: From 10,000 sales records, instantly see total sales by state, by month, by product
Data Validation & Conditional Formatting
Data Validation
Restricts what can be entered in a cell:
- Dropdown lists — select from predefined options
- Number limits — only allow values between 1-100
- Date range — only allow future dates
- Custom formula — any rule you define
- Access: Data tab → Data Validation
Conditional Formatting
Automatically highlights cells based on values:
- Color cells above average in green
- Highlight duplicates in red
- Data bars, icon sets, color scales
- Access: Home tab → Conditional Formatting
Charts
| Chart Type | Best For |
|---|---|
| Bar/Column | Comparing values across categories |
| Line | Trends over time |
| Pie | Parts of a whole (percentages) |
| Scatter | Relationship between two variables |
| Area | Cumulative totals over time |
Important Excel Shortcuts
| Shortcut | Action |
|---|---|
| Ctrl+; | Insert current date |
| Ctrl+Shift+; | Insert current time |
| F2 | Edit active cell |
| F4 | Toggle absolute/relative reference |
| Ctrl+9 | Hide the selected rows |
| Ctrl+` | Show all formulas |
| Alt+= | AutoSum |
| Ctrl+Shift+L | Toggle AutoFilter |
| Ctrl+T | Create table |
| Ctrl+D | Fill down |
| Ctrl+R | Fill right |
| Ctrl+Page Up/Down | Switch between sheets |
Other Features
- Freeze Panes: View → Freeze Panes — keeps headers visible while scrolling
- Sort: Ascending (A-Z, 1-9) or Descending (Z-A, 9-1)
- Filter: Show only rows matching criteria
- Flash Fill: Auto-detects patterns (Ctrl+E)
- Goal Seek: What-If analysis — finds input needed for desired output
Conditional Sum & Average Functions
| Function | Syntax | Purpose |
|---|---|---|
| SUMIF | =SUMIF(range, criteria, sum_range) | Adds values matching one condition |
| SUMIFS | =SUMIFS(sum_range, criteria_range1, criteria1, criteria_range2, criteria2) | Adds values matching multiple conditions |
| AVERAGEIF | =AVERAGEIF(range, criteria, average_range) | Average of values matching a condition |
| AVERAGEIFS | =AVERAGEIFS(avg_range, criteria_range1, criteria1, ...) | Average with multiple conditions |
Example: =SUMIF(B2:B100, "Wheat", C2:C100) — sums all values in column C where column B is "Wheat".
Additional Text Functions
| Function | Details |
|---|---|
| CONCAT | Modern replacement for CONCATENATE — =CONCAT(A1, " ", B1) |
| TEXTJOIN | Joins text with a delimiter, can ignore empty cells — =TEXTJOIN(", ", TRUE, A1:A5) |
| CLEAN | Removes non-printable characters from text |
| TODAY() | Returns current date (updates automatically) |
| NOW() | Returns current date AND time (updates automatically) |
Note: CONCATENATE is being replaced by CONCAT and TEXTJOIN in newer versions of Excel.
What-If Analysis Tools
What-If Analysis tools are found under the Data tab and help forecast outcomes:
| Tool | Purpose |
|---|---|
| Goal Seek | Finds the input value needed to achieve a desired result (reverse calculation) |
| Data Tables | Shows how changing one or two variables affects a formula's result |
| Scenario Manager | Saves and compares multiple sets of input values (best case, worst case, etc.) |
Excel Interface Elements
| Element | Description |
|---|---|
| Name Box | Shows the address of the selected cell (top-left corner of spreadsheet, e.g., "A1") |
| Formula Bar | Displays the content or formula of the currently selected cell (below the Ribbon) |
| Sheet Tab | The tab at the bottom used to move from one worksheet to another inside the same workbook |
| Wrap Text | Displays cell content on multiple lines within the cell (Home tab) |
| Merge & Center | Combines multiple cells into one and centers the content (Home tab) |
| Flash Fill (Ctrl+E) | Auto-detects data entry patterns and fills remaining cells accordingly |
A workbook can contain many worksheets, and each worksheet is represented by a sheet tab. The sheet tab is specifically used for switching between sheets, whereas the scroll bar moves through content inside the current sheet.
Excel File Formats
| Extension | Description |
|---|---|
| .xlsx | Standard Excel Workbook (default since 2007) |
| .xlsm | Macro-enabled Workbook (contains VBA macros) |
| .xls | Older Excel format (97-2003) |
| .csv | Comma-Separated Values (plain text, no formatting) |
| .xltx | Excel Template (pre-designed workbook layout) |
| .xlsb | Excel Binary Workbook (smaller file size) |
Summary Points
| Concept | Key Details |
|---|---|
| File Extension | .xlsx (new), .xls (old) |
| Rows × Columns | 10,48,576 × 16,384 |
| Absolute Ref | 1 — locked, F4 to toggle |
| VLOOKUP | Searches 1st column, FALSE = exact |
| XLOOKUP | Modern, flexible, searches any direction |
| MID | =MID(text, start, length) |
| ROUND | =ROUND(number, decimals) |
| COUNTIF | Counts cells matching condition |
| IF | =IF(condition, true_val, false_val) |
| Pivot Table | Summarizes large datasets |
| Data Validation | Restricts cell input (dropdowns, limits) |
| Conditional Formatting | Auto-highlights based on values |
| Freeze Panes | Keeps headers visible |
| Ctrl+; | Insert current date |
| F4 | Toggle cell reference type |
| SUMIF | =SUMIF(range, criteria, sum_range) — conditional sum |
| SUMIFS | Multiple conditions sum |
| AVERAGEIF | =AVERAGEIF(range, criteria, avg_range) — conditional average |
| CONCAT | Modern replacement for CONCATENATE |
| TEXTJOIN | Joins text with delimiter, ignores empty cells |
| TODAY() | Returns current date (auto-updates) |
| NOW() | Returns current date and time (auto-updates) |
| Goal Seek | What-If Analysis — finds input for desired output |
| Scenario Manager | Saves/compares multiple input sets |
| Flash Fill | Ctrl+E — auto-detects data patterns |
| Name Box | Shows selected cell address (top-left) |
| Formula Bar | Displays cell content or formula |
| Wrap Text | Multi-line display within a cell |
| Merge & Center | Combines cells, centers content |
| .xlsx | Standard Excel Workbook |
| .xlsm | Macro-enabled Workbook |
| .csv | Comma-Separated Values (plain text) |
Lesson Doubts
Ask questions, get expert answers