🧬 QTL Mapping and Future Prospects
Concept, principle, population needs, and breeding value of quantitative trait locus mapping.
QTL mapping is a bridge between classical quantitative genetics and molecular breeding. It helps breeders ask a more precise question: which genomic regions are associated with variation in a complex trait such as yield, quality, or stress tolerance?
What QTL Mapping Means
Quantitative Traits
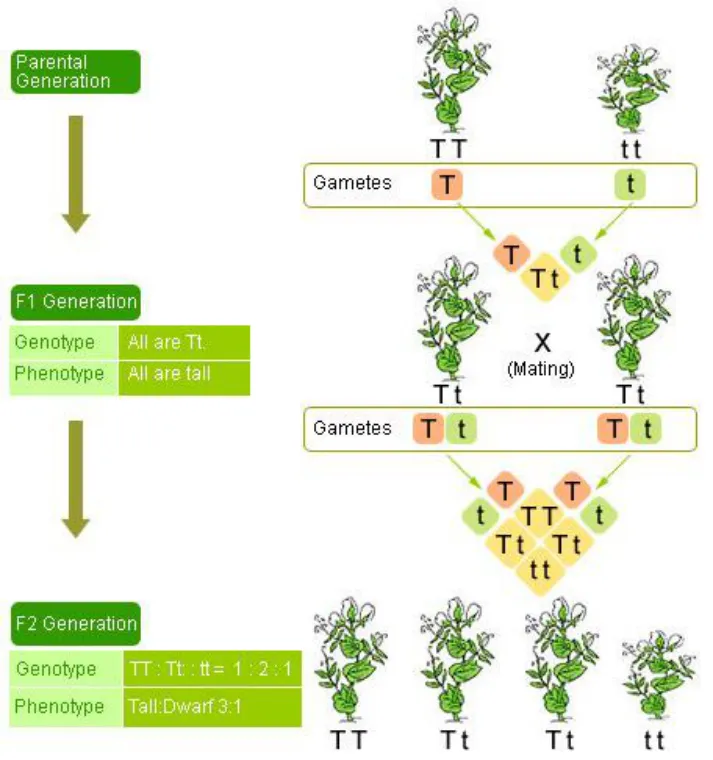
Many traits of agronomic and horticultural interest are controlled by a single gene and fall into a
few distinct phenotypic classes. These classes can be used to predict the genotypes of the
individuals. For example, if we cross a tall and short pea plant and look at F2 plants, we know
the genotype of short plants, and we can give a generalized genotype for the tall plant
phenotype. Furthermore, if we know the genotype we could predict the phenotype of the plant.
These types of phenotypes are called discontinuous traits.
Other traits do not fall into discrete classes. Rather, when a segregating population is analyzed
for these traits, a continuous distribution is found. An example is ear length in corn. Black
Mexican Sweet corn has short ears, whereas Tom Thumb popcorn has long ears. When these
 two inbred lines are crossed, the length of the F1 ears is intermediate to the two parents. Also,
the length does not fall into a tight distribution, but exhibits a bell-shaped distribution.
Furthermore, when the F1 plants are intermated, the distribution of ear length in the F2 ranges
from the short ear Black Mexican Sweet size to the Tom Thumb popcorn size with a distribution
that resembles the bell-shaped curve for a normal distribution. These types of traits are called
continuous traits and cannot be analyzed in the same manner as discontinuous traits. Because
continuous traits are often given a quantitative value, they are often referred to as quantitative
traits, and the area of genetics that studies their mode of inheritance is called quantitative
genetics. Furthermore, the loci controlling these traits are called quantitative trait loci or QTL.
Because many important agricultural traits such as crop yield are quantitative traits, much of the
pioneering research into the modes of inheritance of these traits was performed by agricultural
geneticists. These traits are controlled by multiple genes, each segregating according to
Mendel's laws. These traits can also be affected by the environment to varying degrees.
QTL Mapping
Quantitative characters have been a major area of studying in genetics for over a century, as
they are common feature of natural variation in populations of all eukaryotes, including crop
plants. For most of the period up to 1980, the study of quantitative traits has involved statistical
techniques based on means, variances and covariances of relatives. These studied provided a
conceptual base for portioning the total phenotypic variance into genetic and environmental
variances and further analyzing the genetic variance in terms of additive, dominance and
epistatic effects. From this information, it became feasible to estimate the heritability of the trait
and predict the response of the trait to selection. It was also possible to estimate the minimum
number of genes that controlled the trait of interest. However, little was known about what these
genes were, where they are located, and how they controlled the traits, apart from the fact that
for any given trait, there were several such genes segregating in a Mendelian fashion in any
given population, and in most cases their effects were approximately additive. These genes
were termed polygenes. Sax‟s experiment with beans demonstrated that the effect of an
individual locus affecting a quantitative trait could be isolated though a series of crosses
resulting in randomization of the genetic background with respect to all genes not linked to the
genetic markers under observation. Even though all of the markers used by Sax were
morphological seed markers with complete dominance, he was able to show a significant effect
on seed weight associated with some of his markers. Despite this demonstration, there were
extremely few successful detections of marker-QTL linkage in crop plants during 1930-80s and
of these even fewer were reported. The major limitation was the lack of availability of adequate
polymorphic markers.
Two major developments during the 1980s changed the scenario: (i) the discovery of extensive,
yet easily visualized, variability at the DNA level that could be used as markers; and (ii)
development of statistical packages that can help in analyzing variation in a quantitative trait in
congruence with molecular marker data generated in a segregating population. With
phenomenal improvements in molecular marker technology in the last two decades,
identification and utilization of polymorphic DNA markers as a framework around which the
polygenes could be located, has improved multiple-fold. It is now clear that a genetic map
saturated with polymorphic codominant Mendelian markers can be generated for almost any
species. Nearly saturated genetic maps have already been produced for most species of
economic or scientific interest. We now refer the polygenes as “QTL” (Quantitative Trait Loci), a
term first coined by Gelderman. A QTL is defined as “ a region of the genome that is associated
with an effect on a quantitative trait”. Conceptually, a QTL can be a single gene, or it may be a
cluster of linked genes that affect the trait.
Principle of QTL Mapping
It is not difficult in populations of most crop plants to identify and map a good number of
segregating markers (10 to 50) per chromosome. However, most of these markers would be in
non coding regions of the genome and might not affect the trait interest directly; but a few of
these markers might be linked to genomic regions (QTLs) that do influence the trait of interest.
Where such linkages occur, the marker locus and the QTL will cosegregate. Therefore, the
basic principle of determining whether a QTL is linked to a marker is to partition the mapping
population into different genotypic classes based on genotypes at the marker locus, and the
apply correlative statistics to determine whether the individuals of one genotype differ
significantly with the individuals of other genotype with respect to the trait being measured.
Situations where genes fail to segregate independently are said to display “linkage
disequilibrium”. QTL analysis thus depends on linkage disequilibrium.
With natural populations, consistent association between QTL and marker genotype will not
usually exist, except in a very rare situation where the marker is completely linked to the QTL.
Therefore, QTL analysis is usually undertaken in segregating mapping populations, such as F2
derived populations, recombinant inbred lines (RILs), near-isogenic lines (NILs), double haploid
lines (DHs) and backcross populations.
Objectives of QTL mapping
-
To identify the regions of the genome that affect the trait of interest
-
To analyze the effect of the QTL on the trait
a. How much of the variation for the trait is caused by a specific region?
b. What is the gene action associated with the QTL (additive effect? Dominant
effect?)
c. Which allele is associated with the favourable affect?
Salient requirements for QTL mapping
-
A suitable mapping population generated from phenotypically contrasting parents.
-
A saturated linkage map based on molecular markers
-
Reliable phenotypic screening of mapping population
-
Appropriate statistical package to analyze the genotypic information in combination with
phenotypic information for QTL detection.
Types and size of mapping population
Random mating populations are more difficult for QTL mapping, because linkage disequilibrium
is a key to detecting QTLs with markers. It is essential to develop a suitable experimental
mapping population using parental lines that are highly contrasting phenotypically for the target
trait (ex., highly resistant and susceptible lines). Another important requirement is that these
parental lines should be genetically divergent; this is important to enhance the possibility of
identifying a large set of polymorphic markers that are well distributed across the genome. To
fulfill the second criterion, one may have to carry out molecular polymorphism survey across a
set of potentially useful lines so as to identify the most suitable ones for generation of mapping
population.
The choice of a mapping population could vary based upon the objectives of the experiment, the
timeframe as well as resources available for undertaking QTL analysis. But, the ability to detect
QTLs or the information contained in F2 or F2 derived populations and RILs are relatively higher
than others. The primary advantage of F2:3 families is the ability to measure the effects of
additive and dominance gene actions at specific loci. Because RILs are essentially
homozygous, only additive gene action can be measured. The advantage, though, of the RILs is
the ability to perform larger experiments at several locations and even in multiple years. For
many crops, it is not possible to generate enough seed to perform a multi-location experiment
with population of F2:3 families. Modification of the genetic model is necessary to accommodate
different types of populations.
The size of the mapping population for QTL analysis depends on several factors, including the
type of mapping population employed for analysis, genetic nature of the target trait, objectives of
the experiment, and the resources available for handling a sizable mapping population in terms
of phenotyping and genotyping. While analysis of a large number of individuals (500 or more)
would enable detection of even QTLs having small effects on the target trait, from the practical
point of view (MAS), the basic purpose of QTL mapping would be largely served if one can
detect the QTLs with major effects. This would require, in general, a mapping population of a
size of 200-300 individuals.
Generating a reasonably saturated linkage map
By screening the mapping population using polymorphic molecular markers (popularly called as
genotyping), we can analyze the segregation patterns for each of the markers. The segregation
patterns are usually in consonance with the type of mapping population used. The genotypic
data is then analyzed using a statistical package such as MAPMAKER or JOINMAP, for
construction of a linkage map of the molecular markers analyzed in the study. Mapping means
placing the markers in order, indicating the relative genetic distances between them and
assigning them to their linkage groups on the basis of recombination values from all pairwise
combinations between the markers.
To perform a whole-genome QTL scan, it is desirable to have a saturated marker map. In such
a map, markers are available for each chromosome from one end to the other, and adjacent
markers are spaced sufficiently close that recombination events only rarely occur between
them. For practical purposes, this is generally considered to be less than 10 recombinations per
100 meiosis, or a map distance of less than 10 centiMorgans (cM). In the model plant
Arabidopsis thaliana, which has a particularly small genome, this requires as few as 50 markers.
Several-fold more markers are needed for plant genomes such as wheat and maize. In crops
like maize, a broad „rule-of-the-thumb‟ is to cover each of the chromosomal (bin) locations with
at least one or two polymorphic molecular markers.
Phenotyping of mapping population and sample size
The target quantitative traits have to be measured as precisely as possible and limited amounts
of missing data can be tolerated. The power to resolve the QTL location is limited first by
sample size and then by genetic marker coverage of the genome. Often, the number of
individuals in a sample might appear to be large but missing data or skewed allele frequencies
in the population cause the effective sample size to diminish, thus sacrificing statistical power.
Sometimes, it may be necessary to sacrifice population size in favour of data quality and this
trade off means that only major QTL (with relatively large effect) can be detected. Data is
typically pooled over locations and replications to obtain a single quantitative trait for the line. It
is also preferable to measure the target trait(s) in experiments conducted in multiple (and
appropriate) locations to have a better understanding of the QTL x environment interaction, if
any.
Factors affecting the power of QTL mapping
QTLs are statistically inferred from the data generated in an experiment. However, statistical
influence does not always indicate biological significance due to multiple test problems
associated with QTL mapping. The following factors affect the power of QTL mapping:
-
Number of genes controlling the target trait(s) and their genome positions
-
Distribution of genetic effects and existence of genetic interactions
-
Heritability of the trait
-
Number of genes segregating in a mapping population
-
Type and size of mapping population
-
Density and coverage of markers in the linkage map
-
Statistical methodology employed and significance level used for QTL mapping.
Replicate progeny analysis, selective genotyping, sample pooling and sequential
sampling are some of the suggested approaches for optimization of experimental designs, so as
to enhance the power of QTL detection and estimation of QTL effects.
Mapping QTL with Molecular Markers
The improvement of quantitative traits has been an important goal for many plant breeding
programs. With a pedigree breeding program, the breeder will cross two parents and practice
selection until advanced-generation lines with the best phenotype for the quantitative trait under
selection are identified. These lines will then be entered into a series of replicated trials to
further evaluate the material with the goal of releasing the best lines as a cultivar. It is assumed
that those lines which performed best in these trials have a combination of alleles most
favorable for the fullest expression of the trait.
This type of program, though, requires a large input of labor, land, and money. Therefore plant
breeders are interested in identifying the most promising lines as early as possible in the
selection process. Another way to state this point is that the breeder would like to identify as
early as possible those lines which contain those QTL alleles that contribute to a high value of
the trait under selection. Plant breeders and molecular geneticists have joined efforts to develop
the theory and technique for the application of molecular genetics to the identification of QTLs.
Molecular makers associated with QTLs are identified by first scoring members of a random
segregating population for a quantitative trait. The molecular genotype (homozygous Parent A,
heterozygous, or homozygous parent B) of each member of the population is then determined.
The next step is to determine if an association exists between any of the markers and the
quantitative trait.
The most common method of determining the association is by analyzing phenotypic and
genotypic data by one-way analysis of variance and regression analysis. For each marker, each
of the genotypes is considered a class, and all of the members of the population with that
genotype are considered an observation for that class. (Data is typically pooled over locations
and replications to obtain a single quantitative trait value for the line.) If the variance for the
genotype class is significant, then the molecular marker used to define the genotype class is
considered to be associated with a QTL. For those loci that are significant, the quantitative trait
values are regressed onto the genotype. The R^2 value for the line is considered to be the
amount of total genetic variation that is explained by the specific molecular marker. The final
step is to take those molecular marker loci that are associated the quantitative trait and perform
a multiple regression analysis. From this analysis, you will obtain an R^2 value which gives the
percentage of the total genetic variance explained by all of the markers.
The two types of populations that have been used to identify markers linked to QTLs are F2*3
families (or F3 families from F2 plants) and recombinant inbred lines. Each population type has
advantages and disadvantages. The primary advantage of F2*3 families is the ability to
measure the effects of additive and dominance gene actions at specific loci. Because RI lines
are essentially homozygous, only additive gene action can be measured. The advantage,
though, of the RI lines is the ability to perform larger experiments at several locations and even
in multiple years. For many crops, it is not possible to generate enough seed to perform a multi
location experiment with population of F2*3 families.
Application of molecular markers to selection
Once markers have been detected that are associated with QTLs, the logical next step is to
perform selection on lines within a population. The obvious method would be to only advance
those lines which contain those alleles with a positive effect on the quantitative trait. This type of
experiment has not been performed yet, but analogous experiments may give us an indication
of what we might expect from such selection experiments.
Stuber et al. developed a high-yielding maize population by selecting over ten cycles for
increased yield. They next determined the allelic frequencies for eight isozyme loci that had
been shown to be associated with yield. These frequencies gave them a base-line from which a
new population could be constructed. The new population had essentially the same allelic
frequencies as the high yielding population developed by selection. Next the yield and
ears/plant were measured in the base population, the high-yielding population developed via
selection, and the population constructed based on isozyme frequencies. Data from this
replicated experiment grown in several locations suggested that the gain realized by simply
pooling on allelic frequencies of the high-yield population was equal to two cycles of selection
for yield and one and a half cycles of selection for ears/plant. These results suggest that modest
gains may be realized by simply selecting based on the molecular marker genotype.
Summary Cheat Sheet
Quick Recall Points
- A QTL is a genomic region associated with a quantitative trait.
- Quantitative traits show continuous variation and are influenced by multiple genes plus environment.
- QTL mapping depends on marker-trait association in a suitable segregating population.
- Common mapping populations include F2, RILs, DH lines, NILs, and backcrosses.
Exam Traps
- Do not assume a QTL is always a single gene; it may represent a broader linked genomic region.
- Good phenotyping is just as important as good genotyping in QTL work.
- Marker association suggests linkage, not automatic proof of direct causation.
References
1 source • [1]
References
Standard BSc Agriculture Plant Biotechnology notes
BookLesson Doubts
Ask questions, get expert answers