📊 77th NSO Survey — Land Holdings & Agricultural Households
Key findings from the 77th NSO Survey on land distribution, agricultural household definition, and holding size patterns in rural India
The National Statistical Office (NSO) conducts periodic large-scale surveys to assess the condition of India's farming population. The 77th Round was a landmark because it merged two previously separate surveys — the Land and Livestock Holding Survey (LHS) and the Situation Assessment Survey (SAS) — into a single integrated enquiry for the first time. This makes it the most comprehensive official snapshot of rural India's agrarian structure, covering 17.24 crore rural households, of which 9.31 crore (54%) were agricultural households.
The previous comparable survey was the 70th Round (2012-13). Comparing the two rounds reveals how India's farm economy has evolved over the decade.
Survey Details
| Parameter | Detail |
|---|---|
| Survey period | 1 January 2019 to 31 December 2019 |
| Released | 2021 |
| Subject | "Land and Livestock Holdings and Situation Assessment of Agricultural Households" |
| Coverage | Rural areas only |
Definition of Agricultural Household
An agricultural household must meet both criteria:
Pro Content Locked
Upgrade to Pro to access this lesson and all other premium content.
₹99 charged monthly · Cancel anytime
- All Agriculture & Banking Courses
- AI Lesson Questions (100/day)
- AI Doubt Solver (50/day)
- Glows & Grows Feedback (30/day)
- AI Section Quiz (20/day)
- 22-Language Translation (100/day)
- Recall Questions (20/day)
- AI Quiz (15/day)
- AI Quiz Paper Analysis (100/day)
- AI Step-by-Step Explanations (100/day)
- Spaced Repetition Recall (FSRS)
- AI Tutor
- Immersive Text Questions
- Audio Lessons — Hindi & English
- Mock Tests & Previous Year Papers
- Summary & Mind Maps
- XP, Levels, Leaderboard & Badges
- Generate New Classrooms
- Voice AI Teacher (AgriDots Live)
- AI Revision Assistant
- Knowledge Gap Analysis
- Interactive Revision (LangGraph)
🔒 Secure via Razorpay · Cancel anytime · No hidden fees
The National Statistical Office (NSO) conducts periodic large-scale surveys to assess the condition of India's farming population. The 77th Round was a landmark because it merged two previously separate surveys — the Land and Livestock Holding Survey (LHS) and the Situation Assessment Survey (SAS) — into a single integrated enquiry for the first time. This makes it the most comprehensive official snapshot of rural India's agrarian structure, covering 17.24 crore rural households, of which 9.31 crore (54%) were agricultural households.
The previous comparable survey was the 70th Round (2012-13). Comparing the two rounds reveals how India's farm economy has evolved over the decade.
Survey Details
| Parameter | Detail |
|---|---|
| Survey period | 1 January 2019 to 31 December 2019 |
| Released | 2021 |
| Subject | "Land and Livestock Holdings and Situation Assessment of Agricultural Households" |
| Coverage | Rural areas only |
Definition of Agricultural Household
An agricultural household must meet both criteria:
- Annual income from agricultural activities exceeds Rs 4,000
- At least one member is self-employed in agriculture
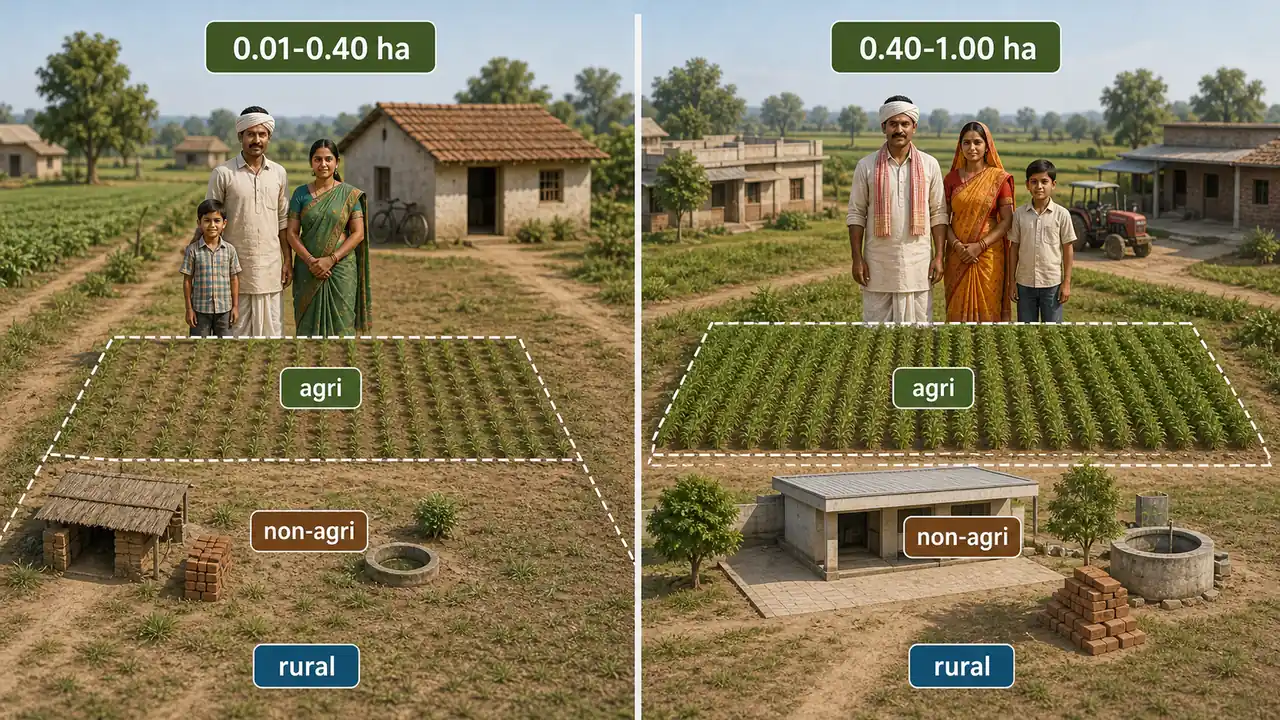
Land Distribution Findings
| Land Holding Size | Agricultural Households | Non-Agricultural Households | Rural Overall |
|---|---|---|---|
| 0.01–0.40 ha | — | 69% (highest) | 50.2% |
| 0.40–1.00 ha | 35.6% (highest) | — | — |
Key takeaways:
- The 0.40–1.00 ha category has the highest proportion of agricultural households at 35.6%
- For non-agricultural households, the 0.01–0.40 ha (marginal) category dominates at 69%
- Overall in rural India, 50.2% of households fall in the 0.01–0.40 ha category
NOTE
This survey is significant for banking and agriculture exams as it provides the latest official data on India's agrarian structure and the dominance of small and marginal holdings.
TIP
Exam trap: Don't confuse the two categories — agricultural households peak at 0.40–1.00 ha (small), while non-agricultural households peak at 0.01–0.40 ha (marginal). The overall rural figure (50.2% in 0.01–0.40 ha) reflects the large number of non-agricultural households pulling the average down.
Household Income (Agricultural Year 2018-19)
| Parameter | Value |
|---|---|
| Average monthly income per agri household | Rs 10,218 |
| Previous (70th Round, 2012-13) | Rs 6,426 |
| Growth | 59% increase over ~6 years |
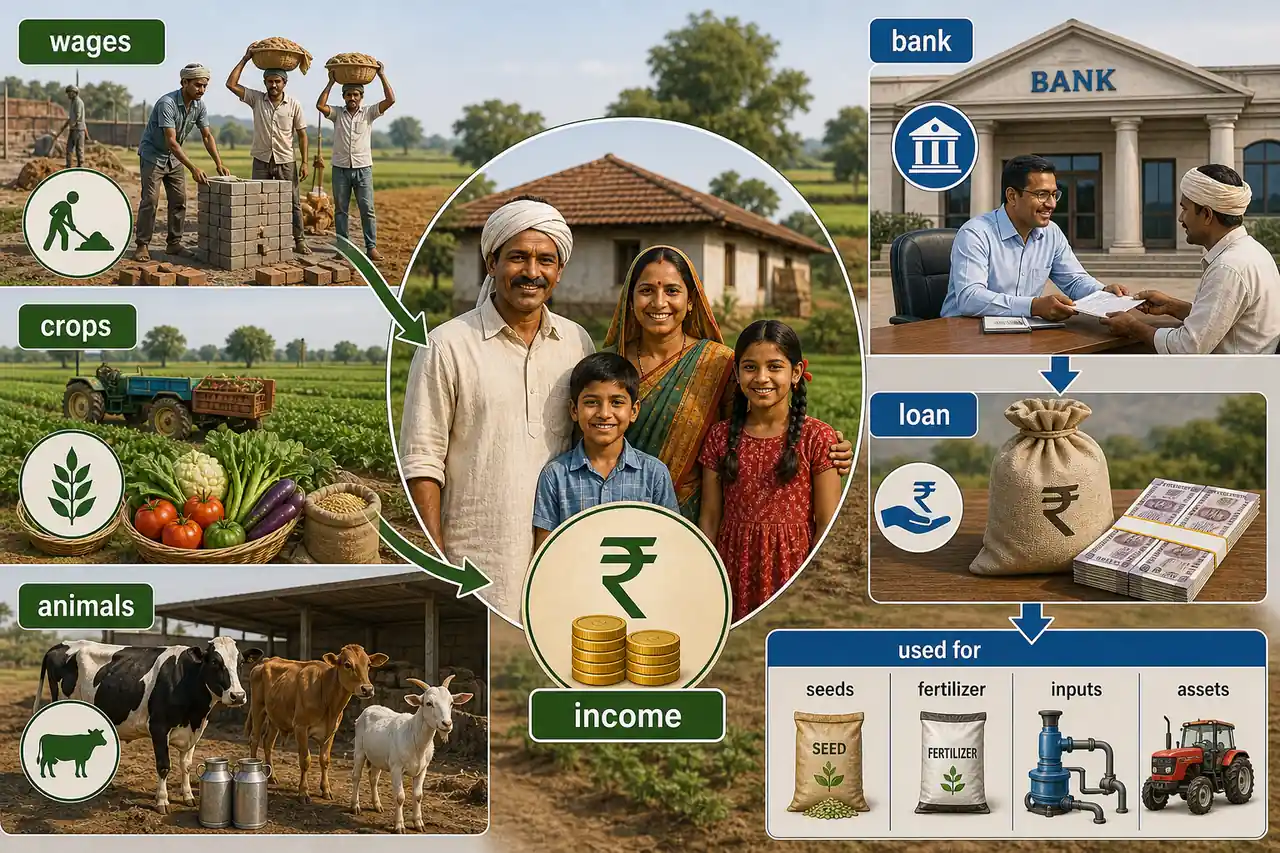
Income Composition
| Source | Share (%) |
|---|---|
| Wages/salary | 40% (largest source) |
| Crop production | 37% |
| Farming of animals | 15% |
| Leasing of land | 1% |
| Non-farm business | 7% |
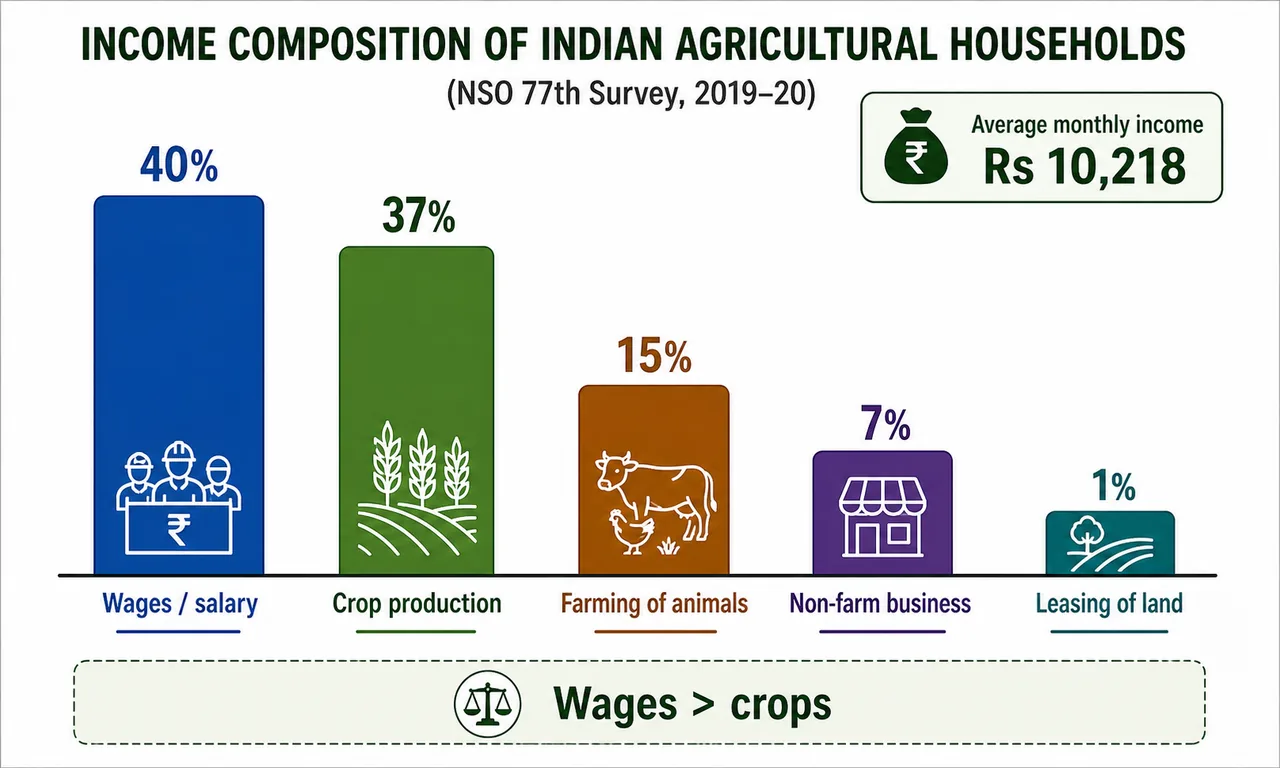
NOTE
Wages, not crops, are the biggest income source for the average Indian agricultural household. This is a frequently tested and counter-intuitive fact — it reflects the prevalence of small holdings where farm income alone is insufficient.
Household Expenditure
| Parameter | Value |
|---|---|
| Average monthly crop production expense | Rs 3,739 |
| Average monthly animal farming expense | Rs 3,018 |
Indebtedness of Agricultural Households
| Parameter | Value |
|---|---|
| % of indebted agri households | 50.2% |
| Average outstanding loan per agri household | Rs 74,121 |
Sources of Outstanding Loans
| Source | Share (%) |
|---|---|
| Commercial banks | 44.5% (largest) |
| Regional Rural Banks (RRBs) | 8.1% |
| Co-operative societies | 6.7% |
| Co-operative banks | 3.9% |
| SHGs | 3.2% |
| Other (insurance, microfinance) | 3.2% |
TIP
Commercial banks dominate agri lending at 44.5% — not moneylenders or co-operatives. This reflects the success of institutional credit expansion, though informal sources still play a role in many states.
Key Structural Facts
- 70.4% of agricultural households possess less than 1 hectare of land
- Only 0.4% have more than 10 hectares
- Total rural households: 17.24 crore (July 2018 – June 2019)
- Agricultural households: 9.31 crore (54%) of total rural
NOTE
The dominance of sub-hectare holdings (70.4%) explains why wage income exceeds crop income — most farms are too small to generate adequate returns from cultivation alone.
Summary Cheat Sheet
| Concept / Topic | Key Details / Explanation |
|---|---|
| 77th NSO Survey – period | 1 January 2019 to 31 December 2019; released 2021 |
| 77th NSO Survey – coverage | Rural areas only; first integrated LHS + SAS survey |
| Total rural households | 17.24 crore; of which 9.31 crore (54%) are agricultural |
| Survey subject | "Land and Livestock Holdings and Situation Assessment of Agricultural Households" |
| Agricultural household definition | Annual agri income > Rs 4,000 AND at least one member self-employed in agriculture |
| Highest % of agri households | 0.40–1.00 ha category — 35.6% of agricultural households |
| Highest % of non-agri households | 0.01–0.40 ha (marginal) — 69% of non-agricultural households |
| Overall rural households | 50.2% fall in 0.01–0.40 ha category |
| Sub-hectare holdings | 70.4% of agri households possess < 1 ha; only 0.4% have > 10 ha |
| Average monthly income | Rs 10,218 (up 59% from Rs 6,426 in 70th Round) |
| Largest income source | Wages/salary: 40%; crop production: 37% |
| Crop production expense | Avg Rs 3,739/month per household |
| % indebted agri households | 50.2% |
| Average outstanding loan | Rs 74,121 per agricultural household |
| Largest loan source | Commercial banks: 44.5%; RRBs: 8.1%; Co-op societies: 6.7% |
References
3 sources • [1] [2] [3]
References
Used for: Official PIB release of 77th Round findings — household counts, land distribution, income, indebtedness
Farmers' Monthly Income jumps to Rs 10,218 in 2018-19 from Rs 6,426 in 2012-13 (PIB, Jan 2023)
OfficialUsed for: PIB release confirming average monthly income per agricultural household and comparison with 70th Round
Used for: Official MoSPI page with full report download and unit-level microdata
Lesson Doubts
Ask questions, get expert answers