📊 Important Economic Terms and Financial Ratios for Farm Management
Master key economic terms — marketable surplus vs marketed surplus, consumer surplus, desire vs demand, economic holding — and essential financial ratios (net capital ratio, working capital, current ratio) with agricultural examples, comparison tables, and exam tips.
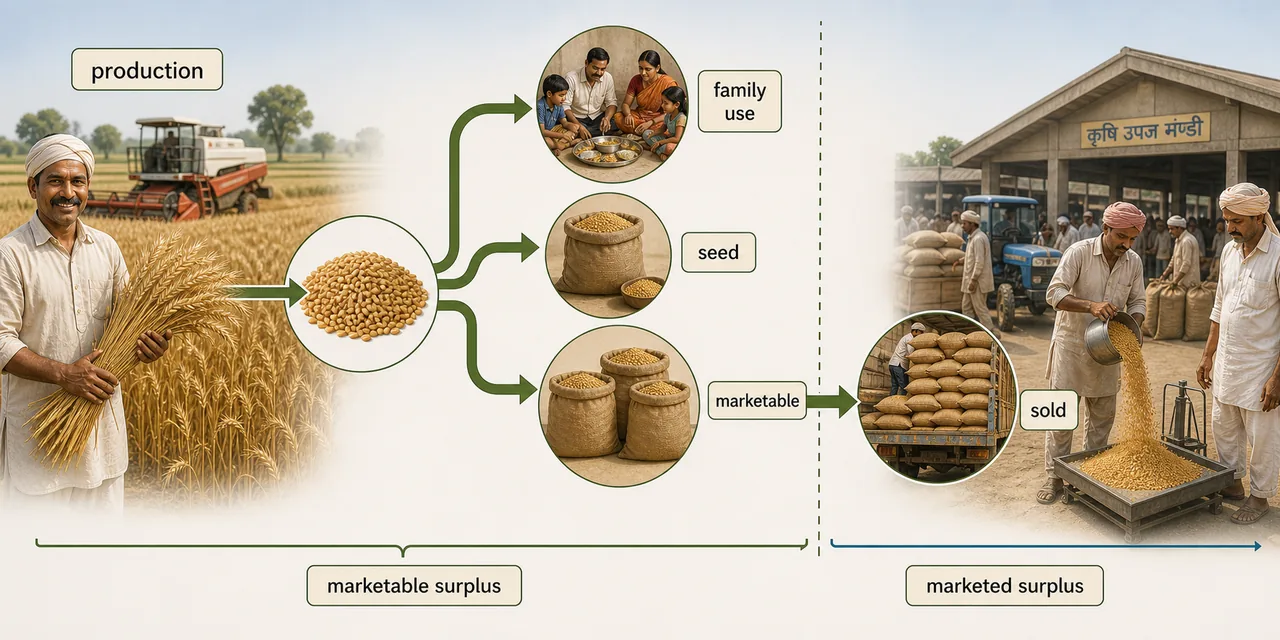
A rice farmer in West Bengal harvests 100 quintals of paddy. After keeping grain for family consumption, seeds for next season, cattle feed, payments to labour in kind, and landlord's share, he has 40 quintals left that could be sold. But he actually takes only 35 quintals to the market. The 40 quintals is the marketable surplus; the 35 quintals is the marketed surplus. This distinction — and several other key economic terms — appears repeatedly in exams, NABARD, and agricultural officer exams.
Key Economic Terms
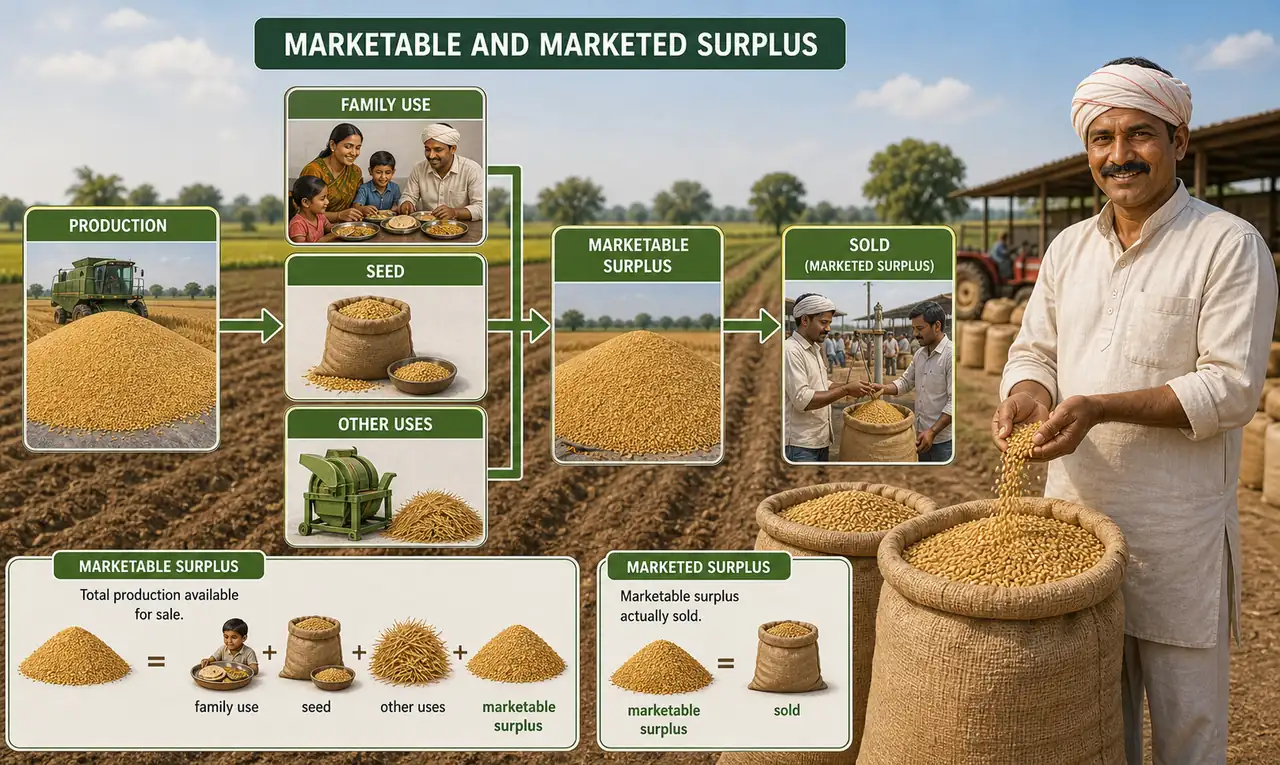
1. Marketable Surplus
The quantity of produce that can be made available to the non-farm population of the country. It is a theoretical concept — what remains after the farmer meets all on-farm requirements.
Deductions from total production:
Pro Content Locked
Upgrade to Pro to access this lesson and all other premium content.
₹99 charged monthly · Cancel anytime
- All Agriculture & Banking Courses
- AI Lesson Questions (100/day)
- AI Doubt Solver (50/day)
- Glows & Grows Feedback (30/day)
- AI Section Quiz (20/day)
- 22-Language Translation (100/day)
- Recall Questions (20/day)
- AI Quiz (15/day)
- AI Quiz Paper Analysis (100/day)
- AI Step-by-Step Explanations (100/day)
- Spaced Repetition Recall (FSRS)
- AI Tutor
- Immersive Text Questions
- Audio Lessons — Hindi & English
- Mock Tests & Previous Year Papers
- Summary & Mind Maps
- XP, Levels, Leaderboard & Badges
- Generate New Classrooms
- Voice AI Teacher (AgriDots Live)
- AI Revision Assistant
- Knowledge Gap Analysis
- Interactive Revision (LangGraph)
🔒 Secure via Razorpay · Cancel anytime · No hidden fees
A rice farmer in West Bengal harvests 100 quintals of paddy. After keeping grain for family consumption, seeds for next season, cattle feed, payments to labour in kind, and landlord's share, he has 40 quintals left that could be sold. But he actually takes only 35 quintals to the market. The 40 quintals is the marketable surplus; the 35 quintals is the marketed surplus. This distinction — and several other key economic terms — appears repeatedly in exams, NABARD, and agricultural officer exams.
Key Economic Terms
1. Marketable Surplus
The quantity of produce that can be made available to the non-farm population of the country. It is a theoretical concept — what remains after the farmer meets all on-farm requirements.
Deductions from total production:
- Family consumption (food for the household)
- Seed for next season
- Feed for cattle
- Payment to labour in kind
- Payment to artisans
- Landlord's share (rent in kind)
- Social and religious obligations
Marketable Surplus (MS) = Total Production (P) - Total Requirement (C)
Agricultural example: A wheat farmer produces 80 quintals. Family needs 15 q for food, 5 q for seed, 3 q for cattle feed, 2 q for labour payments, and 5 q for other obligations = 30 q total requirement. Marketable surplus = 80 - 30 = 50 quintals.
2. Marketed Surplus
The quantity of produce that is actually brought to the market and sold. This is what the farmer actually sells, irrespective of household requirements.
Marketed Surplus = Total Production - (Seed retained + Family consumption)
Key relationship: Marketed surplus may be more than, less than, or equal to the marketable surplus:
| Situation | Marketed vs Marketable | Agricultural Example |
|---|---|---|
| Marketed = Marketable | Farmer sells exactly the surplus | Farmer meets all needs and sells the rest |
| Marketed > Marketable | Farmer sells more than the surplus (under-consumes or distress sale) | A debt-ridden farmer sells grain meant for family food to repay a loan |
| Marketed < Marketable | Farmer sells less than the surplus (holds stock for speculation or storage losses) | Farmer stores wheat expecting higher prices later but sells less now |
Crop-wise patterns:
- Fruits and vegetables: Marketed surplus is nearly 80% (perishable, must be sold quickly)
- Cotton, sugarcane (commercial crops): Very high marketed surplus
- Rice, wheat (subsistence crops): Lower marketed surplus (significant family consumption)
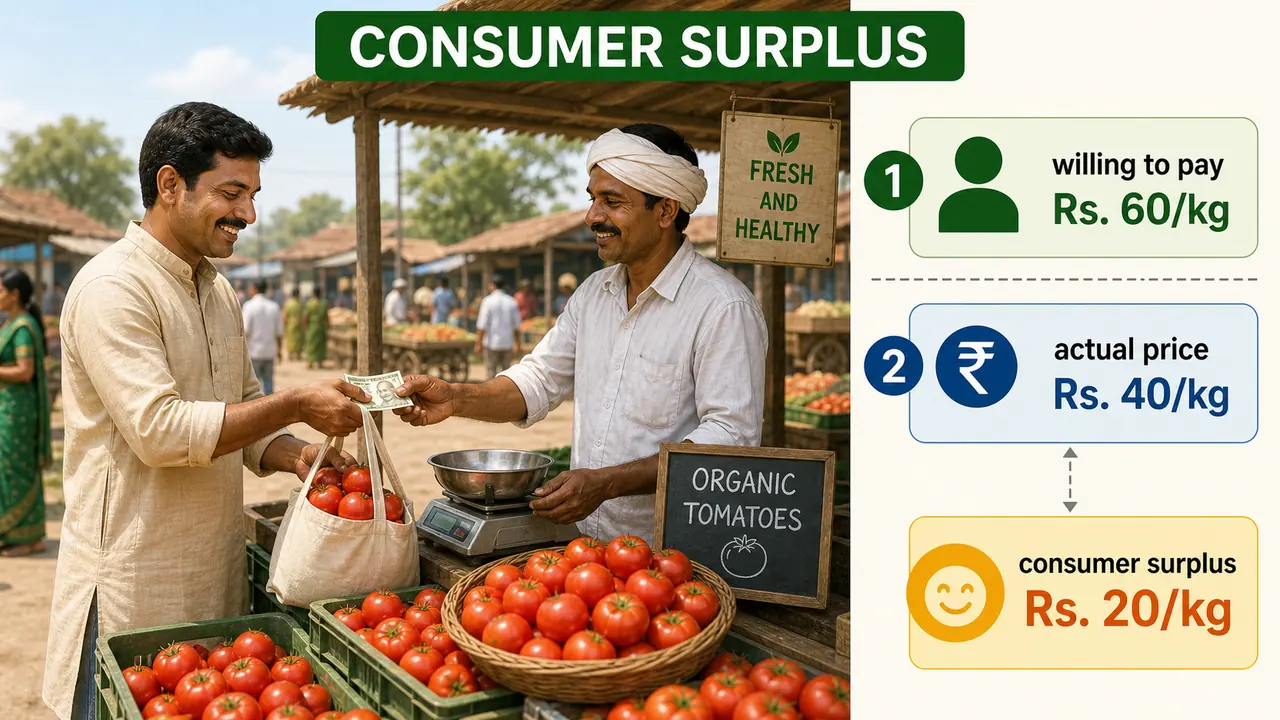
3. Consumer Surplus
The difference between what a consumer is willing to pay and what they actually pay for a commodity. It measures the extra satisfaction or benefit the consumer receives.
Consumer Surplus = Willingness to Pay - Actual Price Paid
Agricultural example: A buyer is willing to pay Rs. 60/kg for organic tomatoes but finds them at Rs. 40/kg in the market. The consumer surplus is Rs. 20/kg — the "bonus" satisfaction from paying less than expected.
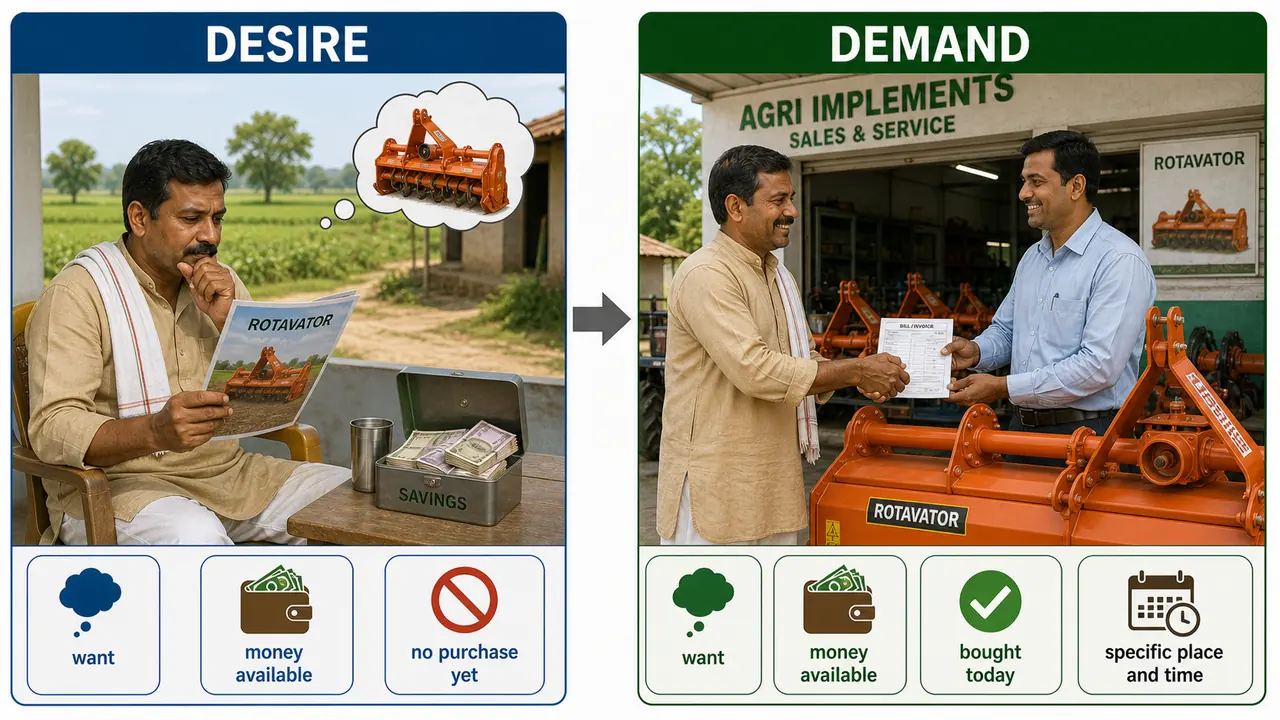
4. Desire vs Demand — A Critical Distinction
These two terms are often confused but have precise economic meanings.
Desire
A want backed by ability to pay — you think of buying something and you have the money, but you have not yet purchased it.
Agricultural example: A farmer wants to buy a rotavator and has Rs. 1,50,000 saved — this is a desire.
Demand
A want backed by ability to pay, exercised at a particular place and time — you actually make the purchase.
Agricultural example: The same farmer goes to an implement dealer in the local mandi and buys the rotavator for Rs. 1,50,000 on Tuesday — this is demand. Demand requires three conditions: want + purchasing power + act of purchase at a specific time and place.
| Feature | Desire | Demand |
|---|---|---|
| Want present? | Yes | Yes |
| Ability to pay? | Yes | Yes |
| Actual purchase made? | No | Yes |
| Time and place specified? | No | Yes — particular place, particular time |
| Agricultural example | Farmer wants and can afford a tractor | Farmer buys the tractor from a dealer today |
Exam Tip: The key differentiator is the act of purchase at a specific time and place. Desire is potential; demand is actual.
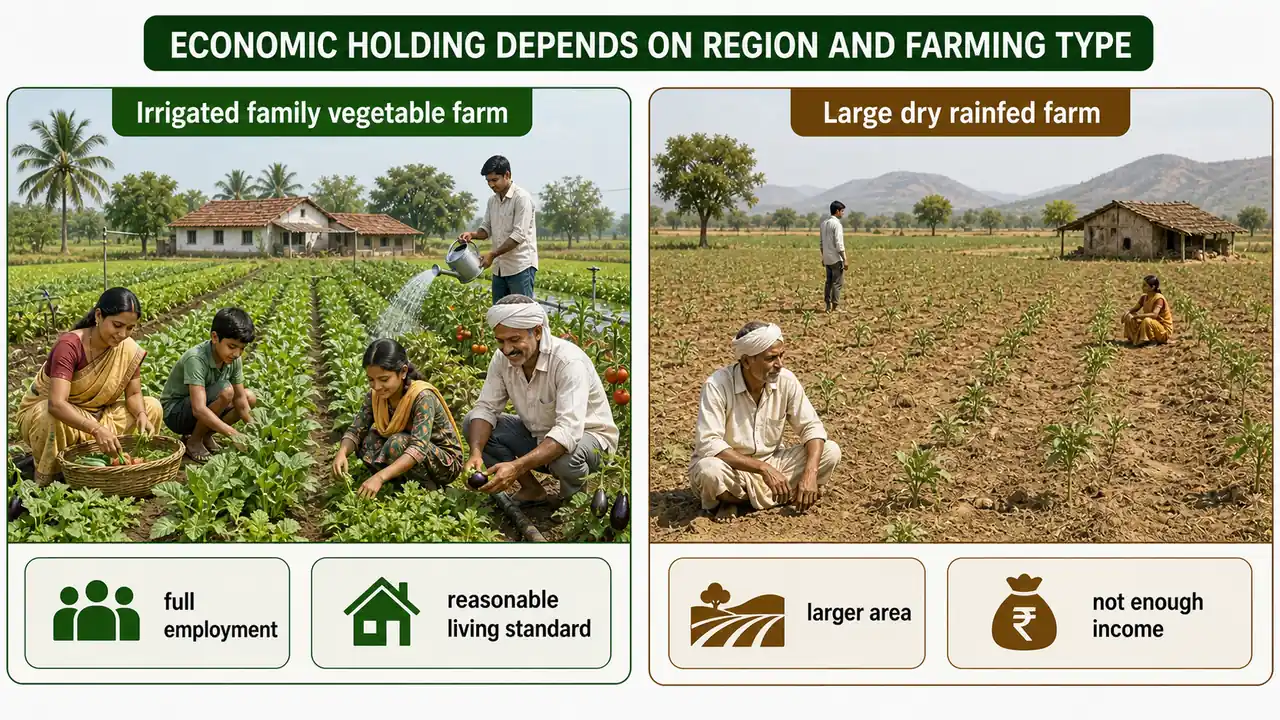
5. Economic Holding
The size of land holding that provides full employment to the farm family and ensures a reasonable standard of living.
Key characteristics:
- Not a fixed area — varies by region, soil quality, irrigation availability, and type of farming
- A 2-hectare irrigated farm with intensive vegetable cultivation may be an economic holding, while a 5-hectare rainfed farm in a dry region may not be
Agricultural example: In Punjab (irrigated, mechanised farming), an economic holding may be around 4-5 hectares. In Rajasthan (rainfed, low productivity), it may be 10+ hectares to provide the same employment and income.
Exam Tip: Economic holding is about full employment + reasonable living standard — not just a minimum area. Always mention that it varies by region and farming type.
Land Holdings Classification in India
| Category | Area (ha) | % of Holdings |
|---|---|---|
| Marginal | 0.50–1.00 | 67% |
| Small | 1.00–2.00 | 18% |
| Semi-medium | 2.00–4.00 | 10% |
| Medium | 4.00–10.00 | 4.3% |
| Large | 10.00+ | 0.7% |
IMPORTANT
67% of Indian holdings are marginal (< 1 ha). Only 0.7% are large (> 10 ha). Average holding size in India is approximately 1.08 ha and declining with each census due to land fragmentation.
Important Financial Ratios
These three ratios measure the financial health of a farm business. They are frequently asked in exams and agricultural economics papers.
| Ratio | Formula | What It Measures | Interpretation |
|---|---|---|---|
| Net Capital Ratio | Total Assets / Total Liabilities | Solvency — can the farm pay all debts if assets are sold? | > 1 means solvent; higher is safer |
| Working Capital Ratio | (Working Assets + Current Assets) / (Intermediary Liabilities + Current Liabilities) | Operational liquidity — can the farm meet medium-term obligations? | > 1 means adequate working capital |
| Current Ratio | Current Assets / Current Liabilities | Short-term liquidity — can the farm pay bills due within one year? | Ideally 2:1; below 1 signals trouble |
Agricultural example for all three ratios:
A farm has:
- Total assets: Rs. 50,00,000 (land, machinery, crops, cash)
- Total liabilities: Rs. 20,00,000 (all loans)
- Current assets: Rs. 8,00,000 (harvested grain, cash, receivables)
- Current liabilities: Rs. 4,00,000 (short-term crop loan, input bills)
| Ratio | Calculation | Result | Verdict |
|---|---|---|---|
| Net Capital Ratio | 50,00,000 / 20,00,000 | 2.5 | Solvent — assets are 2.5x liabilities |
| Current Ratio | 8,00,000 / 4,00,000 | 2.0 | Healthy — can comfortably meet short-term debts |
Exam Tip — Mnemonic: "NCR = Solvency, CR = Liquidity." Net Capital Ratio checks if the farm can survive long-term (solvency). Current Ratio checks if the farm can pay this year's bills (liquidity).
Marketable Surplus vs Marketed Surplus — Exam-Critical Comparison
IMPORTANT
This distinction is one of the most frequently asked questions in exams, NABARD, and agricultural officer exams.
| Feature | Marketable Surplus | Marketed Surplus |
|---|---|---|
| Nature | Theoretical (what CAN be sold) | Actual (what IS sold) |
| Definition | Production minus all on-farm requirements | Production minus only seed and family food retained |
| Depends on | Family size, obligations, retention norms | Farmer's decision, market access, price expectations |
| Relationship | — | Can be more, less, or equal to marketable surplus |
| Commercial crops (cotton, sugarcane) | High | Very high (almost entire output sold) |
| Subsistence crops (rice in eastern India) | Moderate | Low (significant home consumption) |
| Perishable crops (fruits, vegetables) | High | Very high (~80%, must sell quickly) |
Summary Cheat Sheet
| Concept / Topic | Key Details / Explanation |
|---|---|
| Marketable Surplus | Theoretical quantity available for sale = Total Production - all on-farm requirements (food, seed, feed, labour payments, rent, social obligations) |
| Marketed Surplus | Actual quantity the farmer sells in the market; may be more, less, or equal to marketable surplus |
| Marketed > Marketable | Farmer under-consumes or makes distress sale (e.g., sells grain meant for family to repay loan) |
| Marketed < Marketable | Farmer holds stock expecting higher prices later or suffers storage losses |
| Perishable Crops | Fruits and vegetables: marketed surplus nearly 80% (must sell quickly) |
| Commercial Crops | Cotton, sugarcane: very high marketed surplus (almost entire output sold) |
| Consumer Surplus | Willingness to pay - Actual price paid = buyer's "bonus" satisfaction |
| Desire | Want + ability to pay, but purchase not yet made |
| Demand | Want + ability to pay + actual purchase at a specific time and place |
| Desire vs Demand Key | The differentiator is the act of purchase at a specific time and place |
| Economic Holding | Land size providing full employment to farm family and a reasonable standard of living; varies by region |
| Net Capital Ratio | Total Assets / Total Liabilities — measures solvency (can the farm pay all debts?) |
| Working Capital Ratio | (Working + Current Assets) / (Intermediary + Current Liabilities) — measures operational liquidity |
| Current Ratio | Current Assets / Current Liabilities — measures short-term liquidity; ideal: 2:1 |
| NCR vs CR Mnemonic | NCR = Solvency (long-term survival); CR = Liquidity (pay this year's bills) |
Lesson Doubts
Ask questions, get expert answers