🌅 Inflation: Impact on Agriculture and the Economy
Understand inflation — its types, causes, measurement (WPI & CPI), and impact on Indian agriculture. Includes exam-ready tables, mnemonics, and agricultural examples.
Why Should a Farmer Care About Inflation?
Imagine a wheat farmer in Punjab. Last year, a bag of DAP fertiliser cost Rs 1,200. This year, the same bag costs Rs 1,400. Diesel for the tractor is up. Wages for labourers have risen. But the MSP for wheat increased only marginally. The farmer's input costs are rising faster than output prices — this is inflation at work in agriculture.
Inflation affects every part of the farm economy: input costs, credit availability, storage decisions, and final sale prices. Understanding it is essential for any agriculture or banking exam.
What Is Inflation?
At its simplest: when too much money chases too few goods, the value of money falls. This is inflation.
More precisely, inflation is a persistent, appreciable, and general rise in the price level of goods and services over a sustained period.
Three conditions must be met:
- Persistent — sustained over time, not a one-week spike
- Appreciable — significant enough to matter
- General — across the economy, not just one item
Agricultural Example: If onion prices spike for two weeks due to unseasonal rain, that is a temporary supply shock, not inflation. But if prices of fertilisers, seeds, pesticides, fuel, and food grains all rise steadily over several quarters, that is inflation.
Pro Content Locked
Upgrade to Pro to access this lesson and all other premium content.
Charged once for one year · ₹1188 total
Save ₹100/month vs ₹2388/year launch price
- All Agriculture & Banking Courses
- AI Lesson Questions (100/day)
- AI Doubt Solver (50/day)
- Glows & Grows Feedback (30/day)
- AI Section Quiz (20/day)
- 22-Language Translation (100/day)
- Recall Questions (20/day)
- AI Quiz (15/day)
- AI Quiz Paper Analysis (100/day)
- AI Step-by-Step Explanations (100/day)
- Spaced Repetition Recall (FSRS)
- AI Tutor
- Immersive Text Questions
- Audio Lessons — Hindi & English
- Mock Tests & Previous Year Papers
- Summary & Mind Maps
- XP, Levels, Leaderboard & Badges
- Generate New Classrooms
- Voice AI Teacher (AgriDots Live)
- AI Revision Assistant
- Knowledge Gap Analysis
- Interactive Revision (LangGraph)
🔒 Secure one-time yearly payment via Razorpay · No hidden fees
Why Should a Farmer Care About Inflation?
Imagine a wheat farmer in Punjab. Last year, a bag of DAP fertiliser cost Rs 1,200. This year, the same bag costs Rs 1,400. Diesel for the tractor is up. Wages for labourers have risen. But the MSP for wheat increased only marginally. The farmer's input costs are rising faster than output prices — this is inflation at work in agriculture.
Inflation affects every part of the farm economy: input costs, credit availability, storage decisions, and final sale prices. Understanding it is essential for any agriculture or banking exam.
What Is Inflation?
At its simplest: when too much money chases too few goods, the value of money falls. This is inflation.
More precisely, inflation is a persistent, appreciable, and general rise in the price level of goods and services over a sustained period.
Three conditions must be met:
- Persistent — sustained over time, not a one-week spike
- Appreciable — significant enough to matter
- General — across the economy, not just one item
Agricultural Example: If onion prices spike for two weeks due to unseasonal rain, that is a temporary supply shock, not inflation. But if prices of fertilisers, seeds, pesticides, fuel, and food grains all rise steadily over several quarters, that is inflation.
Types of Inflation
By Price Direction
Understanding these terms helps you distinguish between very different economic conditions.
Deflation
Deflation is a sustained fall in the general price level. It sounds good for buyers, but it is harmful.
- Farmers receive lower prices for produce, reducing income
- Businesses cut costs, lay off workers, and reduce investment
- A deflationary spiral begins: falling prices lead to less spending, which causes prices to fall further
Agricultural impact: During deflation, crop prices crash. Farmers who borrowed for inputs cannot repay loans. Rural distress increases sharply.
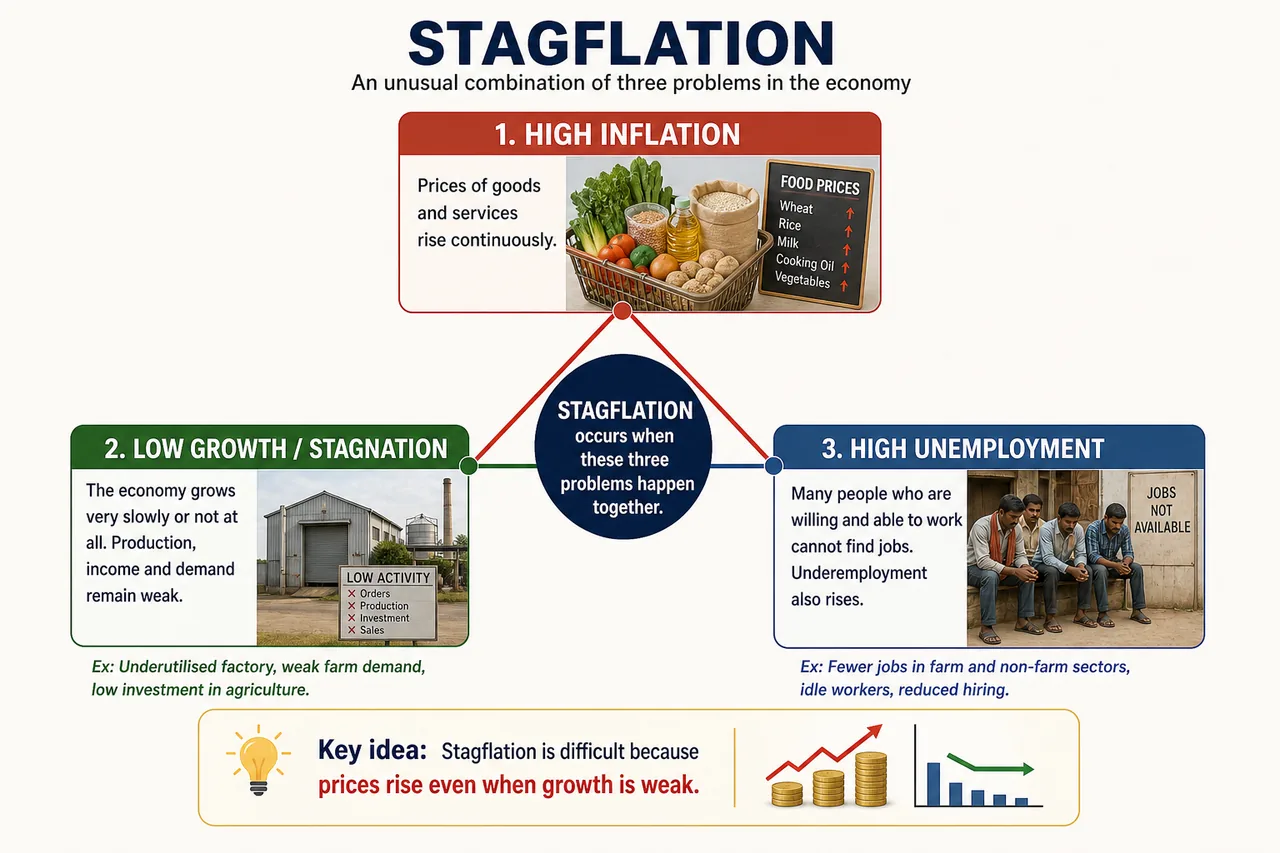
Stagflation (Stagnation + Inflation)
The economy suffers high inflation and high unemployment at the same time. This is the hardest problem to solve because the usual remedies conflict — tightening money supply to control inflation worsens unemployment, and boosting spending to create jobs worsens inflation.
Agricultural example: In the 1970s oil crisis, fuel and fertiliser prices soared (inflation) while industrial output fell (stagnation). Farmers faced rising input costs but shrinking demand for commercial crops.
Mnemonic: STAGnation + inFLATION = STAGFLATION. Think of a stag (deer) stuck in mud — the economy is stuck and overheating at the same time.
Reflation
A deliberate, policy-driven increase in the price level to fight recession. The government or RBI increases money supply or spending to stimulate activity.
Example: After a severe drought, the government may increase rural spending through MGNREGA to put money in farmers' hands and revive demand.
Disinflation
The rate of inflation slows down, but prices are still rising. If inflation drops from 8% to 4%, that is disinflation — not deflation.
Agricultural context: If vegetable prices rose 12% last year but only 5% this year, that is disinflation. Prices are still higher, just rising more slowly.
By Government Control
| Type | Definition | Agricultural Example |
|---|---|---|
| Open Inflation | Prices rise freely without government controls | Market prices of pulses surge during drought; no ceiling imposed |
| Suppressed Inflation | Government controls prices through rationing, subsidies, or price caps | PDS rice sold at Rs 3/kg despite market price being Rs 35/kg; inflationary pressure is hidden |
Key Point: In suppressed inflation, once controls are removed, prices tend to surge sharply — like a compressed spring releasing.
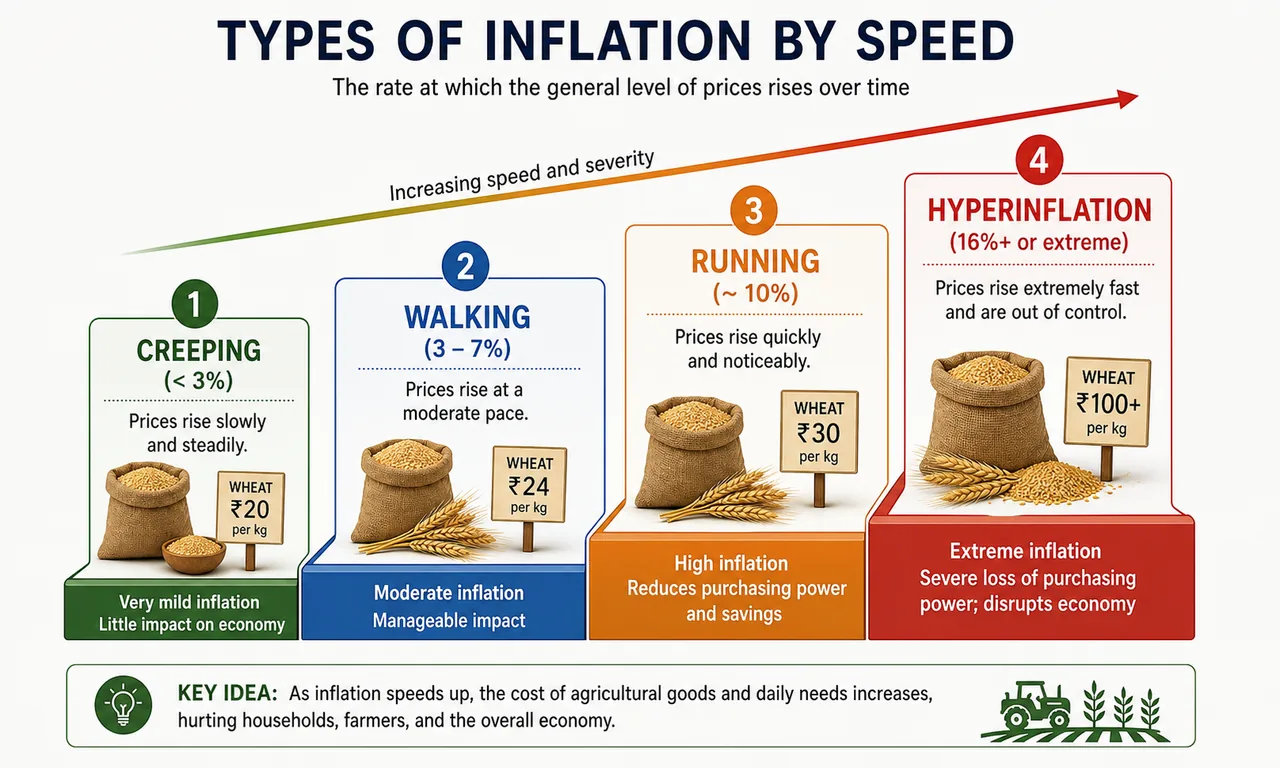
By Rate of Price Rise
This is the most exam-important classification. Learn the rate ranges carefully.
Creeping Inflation (Mild Inflation)
- Rate: less than 3% per annum
- Considered healthy and normal for a growing economy
- Encourages spending and investment
Agricultural angle: A mild annual rise in MSP and input costs is manageable. Farmers can plan and adjust.
Walking Inflation (Trotting Inflation)
- Rate: 3% to 7% per annum
- A warning signal — inflation is heating up
- If unchecked, it can escalate quickly
Agricultural angle: Fertiliser and pesticide prices rise noticeably. Farmers start delaying purchases, hoping prices will fall.
Running Inflation
- Rate: around 10% per annum
- Significantly erodes purchasing power
- Hardest hit: fixed-income groups, pensioners, daily-wage farm labourers
Agricultural angle: A farm labourer earning Rs 300/day finds that the same groceries that cost Rs 250 last year now cost Rs 275. Real wages shrink.
Hyperinflation
- Rate: 16% per annum or more (some economists define it as 50%+ per month)
- The most dangerous and destructive form
- Money becomes virtually worthless; economies can collapse
Historical examples: Post-WWI Germany, Zimbabwe in the 2000s — prices doubled every few hours.
Agricultural impact: Farmers resort to barter. Credit markets collapse. Input supply chains break down entirely.
Inflation Rate Summary Table
| Type | Rate (per annum) | Nature | Mnemonic |
|---|---|---|---|
| Creeping / Mild | Less than 3% | Healthy, normal | A creeping ant moves slowly |
| Walking / Trotting | 3% – 7% | Warning signal | A person walking — moderate pace |
| Running | ~10% | Erodes purchasing power | Running — things are getting fast |
| Hyperinflation | 16%+ (or 50%+/month) | Destructive, economy collapses | Hyper = extreme, out of control |
Exam Tip (Mnemonic — "CWR-H"): Creep → Walk → Run → Hyper. Just like human movement speeds up, inflation accelerates through these stages: 3% → 7% → 10% → 16%+.
Measurement of Inflation in India
Accurate measurement is essential for policymaking, wage negotiations, MSP fixation, and understanding the real health of the farm economy. India uses two main indices.
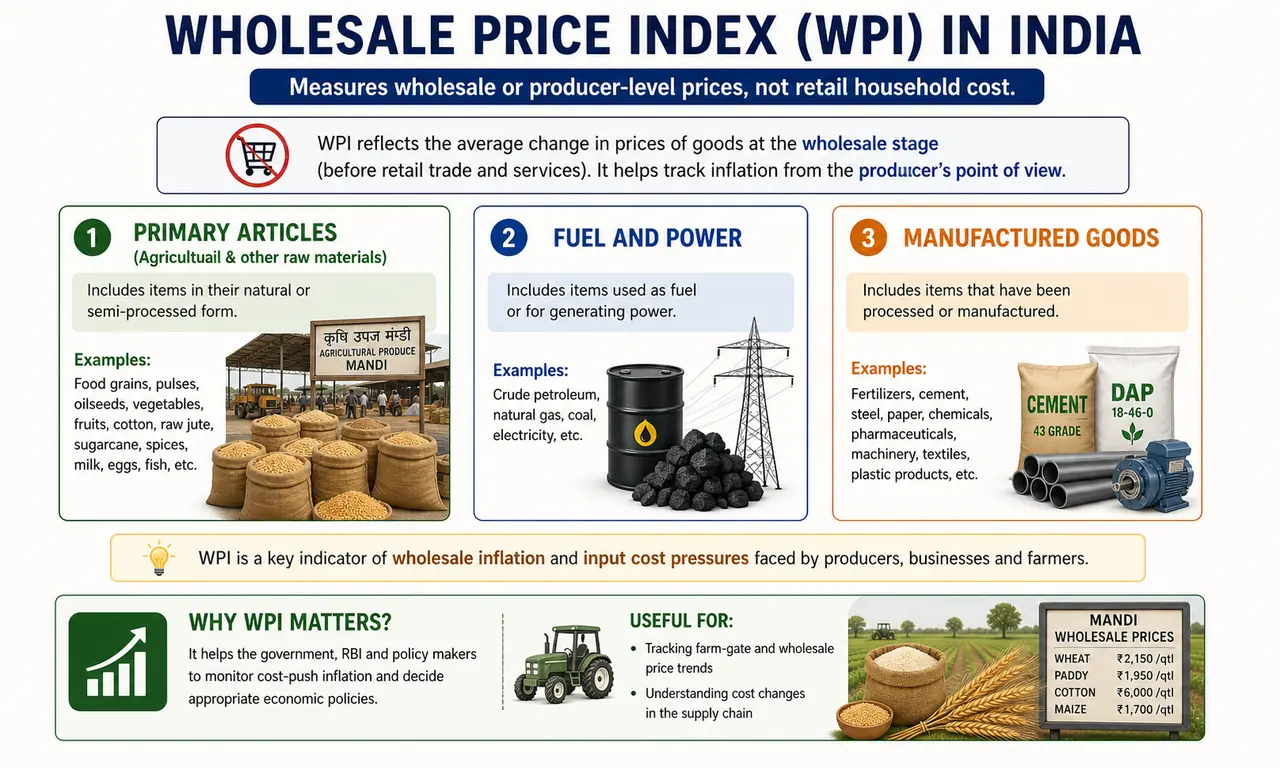
Wholesale Price Index (WPI)
- Tracks price changes at the producer/wholesale level — prices at which goods are traded between businesses before reaching the consumer
- Published by the Office of Economic Adviser, Ministry of Commerce and Industry
- Covers all transactions at the first point of bulk sale in the domestic market
- Base year: 2011-12 (= 100), revised in 2017
Three groups in WPI:
- Primary Articles (includes agricultural commodities)
- Fuel and Power
- Manufactured Goods
Limitation: The general public does not buy at wholesale prices, so WPI may not reflect the actual cost of living.
Agricultural relevance: WPI tracks wholesale mandi prices of wheat, rice, pulses, oilseeds — useful for understanding farm-gate price trends.
Consumer Price Index (CPI)
- Tracks prices from the retail buyer's perspective — what consumers actually pay
- A more accurate measure of the cost of living
- Base year: 2012 (= 100)
Four types of CPI:
| CPI Variant | Compiled By | Ministry |
|---|---|---|
| CPI for Industrial Workers (IW) | Labour Bureau | Ministry of Labour and Employment |
| CPI for Agricultural Labourers (AL) | Labour Bureau | Ministry of Labour and Employment |
| CPI for Rural Labourers (RL) | Labour Bureau | Ministry of Labour and Employment |
| CPI (Rural/Urban/Combined) | CSO | Ministry of Statistics and Programme Implementation (MoSPI) |
Why separate CPIs? Consumption patterns differ across groups. Agricultural labourers spend a much higher share of income on food than industrial workers. A food price spike hits them harder.
Agricultural relevance: CPI-AL is specifically designed to capture the cost of living for farm labourers. It is used for fixing minimum wages in agriculture.
CPI vs WPI: Comparison Table
| Feature | WPI | CPI |
|---|---|---|
| What it measures | Wholesale/producer prices | Retail/consumer prices |
| Published by | Ministry of Commerce & Industry | CSO (MoSPI) / Labour Bureau |
| Base year | 2011-12 | 2012 |
| Includes services? | No | Yes (healthcare, education, rent, transport) |
| Food weightage | Lower | Higher (food price spikes affect CPI more) |
| Groups covered | Primary, Fuel & Power, Manufactured | IW, AL, RL, Rural/Urban/Combined |
| Used by RBI for targeting? | No | Yes — since April 2014 |
| Agricultural use | Tracks mandi/wholesale crop prices | Tracks cost of living for farm labourers |
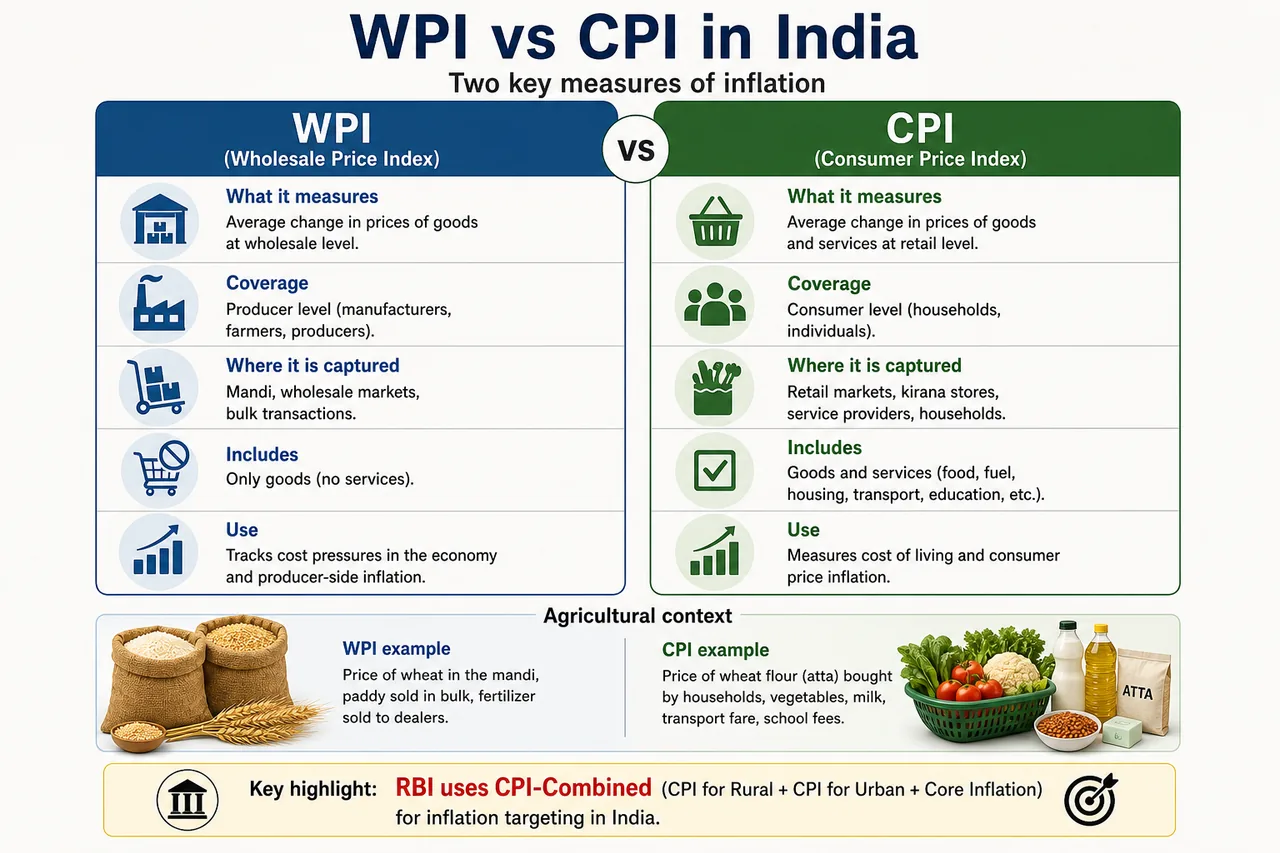
Key Fact for Exams: In April 2014, the RBI adopted CPI-Combined as its key inflation measure under the inflation targeting framework. The target is 4% with a tolerance band of +/- 2% (i.e., 2% to 6%).
How Inflation Affects Indian Agriculture
| Area | Impact |
|---|---|
| Input costs | Fertiliser, diesel, seeds, pesticides become more expensive |
| Credit | Higher interest rates (to control inflation) make farm loans costlier |
| MSP decisions | CACP considers input cost inflation when recommending MSP |
| Storage | Farmers may hoard produce expecting higher future prices, worsening supply shortages |
| Rural wages | MGNREGA wages are linked to CPI-AL; inflation erodes real wages if adjustments lag |
| Terms of trade | If input prices rise faster than output prices, agriculture's terms of trade worsen |
Master Summary Table
| Concept | Key Point | Exam Keyword |
|---|---|---|
| Inflation | Persistent, appreciable, general rise in prices | "Too much money chasing too few goods" |
| Deflation | Falling prices; causes unemployment, depression | Deflationary spiral |
| Stagflation | High inflation + stagnation/unemployment together | Stagnation + Inflation |
| Reflation | Deliberate policy to raise prices during recession | Policy-induced |
| Disinflation | Rate of inflation slows (not price fall) | 8% → 4% |
| Open Inflation | Prices rise freely; no government control | Free market |
| Suppressed Inflation | Government controls prices (rationing, subsidies) | Hidden pressure |
| Creeping | Less than 3%; healthy | Mild inflation |
| Walking | 3–7%; warning signal | Trotting inflation |
| Running | ~10%; erodes purchasing power | Policy action needed |
| Hyperinflation | 16%+; destructive | Germany, Zimbabwe |
| WPI | Wholesale prices; Ministry of Commerce; base 2011-12 | First point of bulk sale |
| CPI | Retail prices; CSO/Labour Bureau; base 2012 | Cost of living |
| RBI Target | CPI-Combined; 4% +/- 2%; since April 2014 | Inflation targeting framework |
Exam Tips
- CWR-H for rates: Creep (less than 3%) → Walk (3-7%) → Run (~10%) → Hyper (16%+)
- WPI vs CPI: WPI = Wholesale, no services. CPI = Consumer, includes services. RBI uses CPI.
- Stagflation trick question: If a question mentions simultaneous unemployment and inflation, the answer is always stagflation.
- Disinflation is NOT deflation: Disinflation = inflation rate decreasing. Deflation = prices actually falling.
- Base years: WPI = 2011-12. CPI = 2012. Remember: WPI came first (2011), CPI next (2012).
- CPI-AL is specific to agricultural labourers — frequently asked in agriculture exams.
Summary Cheat Sheet
| Concept / Topic | Key Details / Explanation |
|---|---|
| Inflation | Persistent, appreciable, general rise in price level; "too much money chasing too few goods" |
| Deflation | Sustained fall in general price level; causes unemployment, depression, deflationary spiral |
| Stagflation | High inflation + high unemployment simultaneously; hardest to solve (stagnation + inflation) |
| Reflation | Deliberate policy-driven price increase to fight recession (e.g., increased MGNREGA spending after drought) |
| Disinflation | Rate of inflation slows down (e.g., 8% → 4%); prices still rising, just more slowly; not deflation |
| Open Inflation | Prices rise freely without government controls |
| Suppressed Inflation | Government controls prices via rationing/subsidies; inflationary pressure is hidden; prices surge when controls removed |
| Creeping / Mild Inflation | Rate < 3% per annum; considered healthy and normal for a growing economy |
| Walking / Trotting Inflation | Rate 3%–7% per annum; a warning signal |
| Running Inflation | Rate ~10% per annum; significantly erodes purchasing power |
| Hyperinflation | Rate 16%+ per annum (or 50%+/month); most destructive; money becomes worthless (e.g., Germany, Zimbabwe) |
| Inflation Rate Mnemonic (CWR-H) | Creep (<3%) → Walk (3-7%) → Run (~10%) → Hyper (16%+) |
| WPI (Wholesale Price Index) | Tracks wholesale/producer prices; published by Ministry of Commerce & Industry; base year 2011-12 |
| WPI Groups | Primary Articles, Fuel & Power, Manufactured Goods |
| CPI (Consumer Price Index) | Tracks retail/consumer prices; more accurate measure of cost of living; base year 2012 |
| CPI Variants | CPI-IW, CPI-AL (Agricultural Labourers), CPI-RL — compiled by Labour Bureau; CPI Rural/Urban/Combined — compiled by CSO (MoSPI) |
| RBI Inflation Target | Uses CPI-Combined since April 2014; target 4% ± 2% (2%–6%) under inflation targeting framework |
| WPI vs CPI | WPI = no services, wholesale level; CPI = includes services, retail level; RBI uses CPI |
| Impact on Agriculture — Input Costs | Fertiliser, diesel, seeds, pesticides become more expensive |
| Impact on Agriculture — Credit | Higher interest rates (to control inflation) make farm loans costlier |
| Impact on Agriculture — MSP | CACP considers input cost inflation when recommending MSP |
| Impact on Agriculture — Wages | MGNREGA wages linked to CPI-AL; inflation erodes real wages if adjustments lag |
| Terms of Trade | If input prices rise faster than output prices, agriculture's terms of trade worsen |
| Base Year Mnemonic | WPI = 2011-12, CPI = 2012 — "WPI came first" |