🌎 Macroeconomics — National Income, GDP, and Economic Measurement
Understand macroeconomic concepts like GDP, GNP, NNP, national income measurement methods, and their relevance to Indian agriculture with exam-focused examples, mnemonics, and comparison tables.
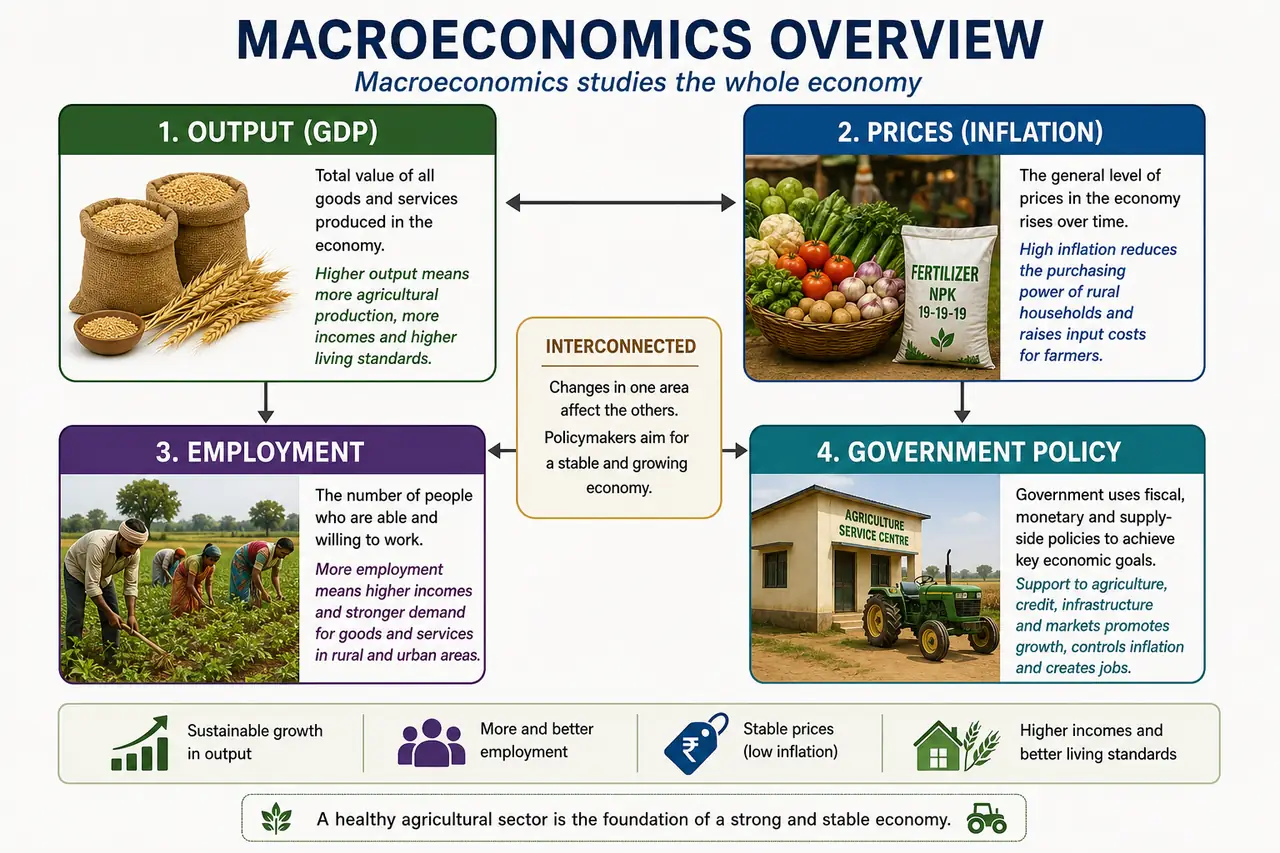
Why Macroeconomics Matters for Agriculture
Imagine a wheat farmer in Punjab. He grows wheat, sells it at the mandi, earns income, and spends that income on fertilisers, seeds, and household goods. The fertiliser dealer pays wages to workers, who in turn buy food. This simple chain — production leads to income, income leads to spending, spending leads to more production — is the heartbeat of macroeconomics.
Macroeconomics studies the economy as a whole: total output, total income, price levels, employment, and growth. For agriculture, macroeconomic policies on subsidies, taxation, government spending, and trade directly shape farm incomes, input costs, and food prices.
The Circular Flow of Income
In every economy, resources flow from households to firms, and goods and services flow back from firms to households.
Pro Content Locked
Upgrade to Pro to access this lesson and all other premium content.
Charged once for one year · ₹1188 total
Save ₹100/month vs ₹2388/year launch price
- All Agriculture & Banking Courses
- AI Lesson Questions (100/day)
- AI Doubt Solver (50/day)
- Glows & Grows Feedback (30/day)
- AI Section Quiz (20/day)
- 22-Language Translation (100/day)
- Recall Questions (20/day)
- AI Quiz (15/day)
- AI Quiz Paper Analysis (100/day)
- AI Step-by-Step Explanations (100/day)
- Spaced Repetition Recall (FSRS)
- AI Tutor
- Immersive Text Questions
- Audio Lessons — Hindi & English
- Mock Tests & Previous Year Papers
- Summary & Mind Maps
- XP, Levels, Leaderboard & Badges
- Generate New Classrooms
- Voice AI Teacher (AgriDots Live)
- AI Revision Assistant
- Knowledge Gap Analysis
- Interactive Revision (LangGraph)
🔒 Secure one-time yearly payment via Razorpay · No hidden fees
Why Macroeconomics Matters for Agriculture
Imagine a wheat farmer in Punjab. He grows wheat, sells it at the mandi, earns income, and spends that income on fertilisers, seeds, and household goods. The fertiliser dealer pays wages to workers, who in turn buy food. This simple chain — production leads to income, income leads to spending, spending leads to more production — is the heartbeat of macroeconomics.
Macroeconomics studies the economy as a whole: total output, total income, price levels, employment, and growth. For agriculture, macroeconomic policies on subsidies, taxation, government spending, and trade directly shape farm incomes, input costs, and food prices.
The Circular Flow of Income
In every economy, resources flow from households to firms, and goods and services flow back from firms to households.
- Households supply land, labour, capital, and enterprise to firms.
- Firms produce goods and services and pay households in return — rent for land, wages for labour, interest for capital, and profit for enterprise.
This continuous cycle is called the Circular Flow Model, also known as the Wheel of Wealth — every rupee spent by one person becomes income for another.
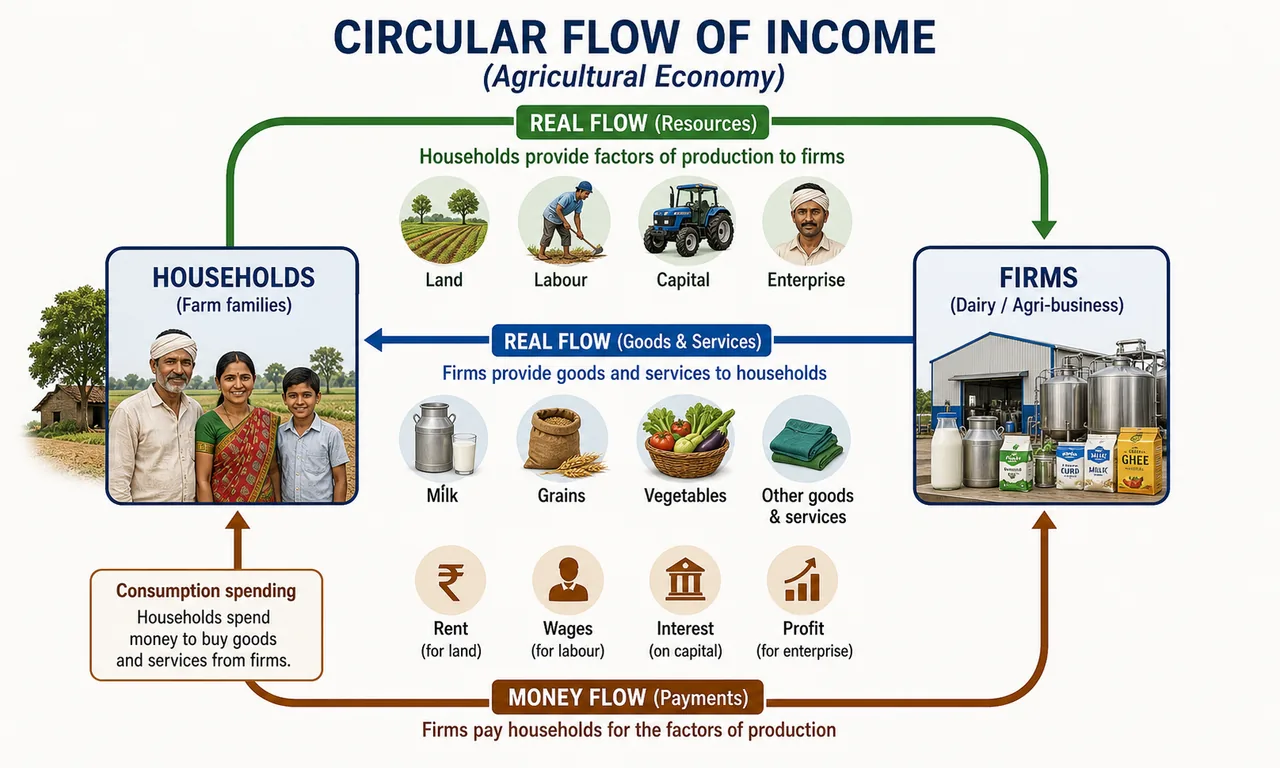
Agricultural example: A dairy farmer (household) supplies milk (product) to Amul (firm). Amul pays the farmer (income). The farmer uses that income to buy cattle feed from another firm. The cycle continues.
Leakages and Injections
The circular flow does not stay at a steady level — it expands or contracts.
| Factor | Leakages (reduce flow) | Injections (increase flow) |
|---|---|---|
| Savings & Investment | Savings withdrawn from spending | Investment adds new spending |
| Government | Taxes taken out of income | Government spending (subsidies, MGNREGA wages) pumped in |
| Foreign Trade | Imports send money abroad | Exports bring money in |
When injections exceed leakages, the economy grows. When leakages exceed injections, it contracts.
Exam Tip: Remember leakages as STI (Savings, Taxes, Imports) and injections as IGE (Investment, Government spending, Exports).
National Income — Definition
"National Income is that part of objective income of the community, including income derived from abroad, which can be measured in money." — A.C. Pigou
National income is the total monetary value of all goods and services produced by a country's residents in a given year. It serves as the primary indicator of economic health and standard of living.
Concepts of National Income — From Broadest to Narrowest
The major national income concepts form a logical chain, each derived from the previous one by making specific adjustments.
| # | Concept | What it measures |
|---|---|---|
| 1 | GDP | Total output within domestic territory |
| 2 | GNP | GDP + Net factor income from abroad |
| 3 | NNP at Market Price | GNP − Depreciation |
| 4 | NNP at Factor Cost (National Income) | NNP at MP − Indirect Taxes + Subsidies |
| 5 | Personal Income | Income actually received by individuals |
| 6 | Disposable Income | Personal Income − Personal Taxes |
Mnemonic — "Great Grapes Need Not Perish Dry": GDP → GNP → NNP → National Income → Personal Income → Disposable Income.
1. Gross Domestic Product (GDP)
GDP is the total market value of all final goods and services produced within the domestic territory of a country in a year.
- The key word is "domestic territory" — GDP counts everything produced within national borders, regardless of who produces it.
- Only final goods are counted. Intermediate goods (wheat used by a flour mill) are excluded because their value is already embedded in the final product (flour or bread).
- Double counting (counting both intermediate and final goods) would inflate GDP and must be avoided.
Agricultural example: If a sugarcane farmer sells cane worth Rs 5,000 to a sugar mill, and the mill produces sugar worth Rs 8,000, only Rs 8,000 (the final product) enters GDP — not Rs 13,000.
What is NOT included in GDP
| Excluded Item | Reason | Agricultural Example |
|---|---|---|
| Unpaid/free services | No market transaction | A farmer's wife tending the kitchen garden for home use |
| Sale of old goods | Not current production | Resale of a second-hand tractor |
| Transfer payments | No goods/services produced in return | Old-age pension, PM-KISAN instalments |
| Share/bond transactions | Mere ownership transfers | Buying shares of a fertiliser company |
| Capital gains/losses | Not new production | Rise in land price due to nearby highway construction |
2. Gross National Product (GNP)
GNP extends GDP by including income earned by a country's residents abroad and excluding income earned by foreigners within the country.
GNP = GDP + Net Factor Income from Abroad
Where:
Net Factor Income from Abroad = Income received by Indians abroad − Income paid to foreigners in India
Agricultural example: An Indian agricultural scientist working at IRRI (Philippines) contributes to the Philippines' GDP but to India's GNP. Conversely, a Dutch expert working at ICAR in India contributes to India's GDP but the Netherlands' GNP.
| Measure | Counts production by... | Key word |
|---|---|---|
| GDP | Location (domestic territory) | Where |
| GNP | Nationality (citizens) | Who |
3. Net National Product (NNP) at Market Price
NNP accounts for the wear and tear of capital goods used during production.
NNP = GNP − Depreciation
Depreciation (also called capital consumption allowance) is the loss in value of fixed capital due to wear and tear.
Agricultural example: A farmer buys a tractor for Rs 8 lakh. Each year, the tractor loses about Rs 80,000 in value due to use. This Rs 80,000 is depreciation. NNP deducts this to show the true net output available for consumption and new investment.
The NNP formula can also be expanded as:
NNP = C + I + G + (X − M)
Where C = Personal Consumption, I = Net Domestic Private Investment, G = Government Expenditure, X − M = Net Exports.
Exam Tip: If a problem does not specify "at factor cost," assume market price by default.
4. NNP at Factor Cost (National Income)
This is National Income in the strictest sense — the sum of all incomes earned by factors of production (land, labour, capital, enterprise) for their contribution to net output.
NNP at Factor Cost = NNP at Market Price − Indirect Taxes + Subsidies
- Indirect taxes (GST, excise duty) raise market prices above what producers receive.
- Subsidies (fertiliser subsidy, food subsidy) lower market prices below cost.
Agricultural example: If a bag of urea has a market price of Rs 266 but its actual cost is Rs 1,700, the difference is a government subsidy. NNP at factor cost adjusts for this by adding subsidies back and removing taxes.
5. Personal Income
Personal income is the sum of all incomes actually received by individuals in a year — not just earned.
Personal Income = National Income − Social Security Contributions − Corporate Income Taxes − Undistributed Corporate Profits + Transfer Payments
| Adjustment | Direction | Example |
|---|---|---|
| Social security contributions | Subtract (earned but not received) | EPF deductions from a farm manager's salary |
| Corporate taxes | Subtract (earned but not received) | Tax paid by ITC on its agri-business profits |
| Undistributed profits | Subtract (earned but not received) | Profits retained by Amul for expansion |
| Transfer payments | Add (received but not earned) | PM-KISAN Rs 6,000/year to farmers |
6. Disposable Income
Disposable income is the amount individuals actually have available to spend or save after paying personal taxes.
Disposable Income = Personal Income − Personal Taxes
Disposable Income = Consumption Expenditure + Savings
Every rupee of disposable income is either spent or saved. The ratio between the two has major implications for economic growth — higher savings can fuel agricultural investment (new equipment, irrigation), while higher consumption drives demand for farm produce.
Three Methods of Measuring National Income
Production generates income, which is spent on goods and services. Therefore, national income can be measured from three angles — and all three should yield the same figure.
| Method | Approach | Measures |
|---|---|---|
| Production (Value-Added) Method | Output side | Value added at each stage of production |
| Income Method | Distribution side | Total factor incomes earned |
| Expenditure Method | Spending side | Total spending on final goods and services |
Mnemonic — "PIE": Production, Income, Expenditure — three slices of the same national income pie.
A. Production (Value-Added) Method
The economy is divided into sectors (agriculture, mining, manufacturing, services, etc.), and the value added at each stage of production is summed up.
Value Added = Value of Output − Value of Intermediate Inputs
Agricultural example — Rice production chain:
| Stage | Output Value (Rs) | Intermediate Input (Rs) | Value Added (Rs) |
|---|---|---|---|
| Paddy farmer | 2,000 | 500 (seeds, fertiliser) | 1,500 |
| Rice mill | 3,200 | 2,000 (paddy) | 1,200 |
| Retailer | 4,000 | 3,200 (milled rice) | 800 |
| Total | 3,500 |
GDP by value-added method = Rs 3,500 (not Rs 9,200 — which would be double counting).
B. Income Method
All factor incomes generated in the production process are summed up.
| Component | Included/Excluded | Agricultural Example |
|---|---|---|
| Wages and salaries | Included | Farm labourers' wages |
| Rent | Included | Rent paid for agricultural land |
| Interest | Included | Interest on KCC (Kisan Credit Card) loan |
| Mixed income (self-employed) | Included | Income of a small farmer who is owner, manager, and labourer |
| Corporate profits | Included | Profits of Rallis India (agrochemicals) |
| Indirect taxes | Included | GST on pesticides |
| Depreciation | Included | Wear and tear on farm machinery |
| Transfer payments | Excluded (deducted) | PM-KISAN, old-age pension |
GDP (Income Method) = Wages + Rent + Interest + Profits + Indirect Taxes + Depreciation − Transfer Payments
C. Expenditure Method
All spending on final goods and services is summed up under four heads.
(i) Personal Consumption Expenditure (C)
- The largest component of GDP in most economies.
- Includes spending on durable goods (tractors, TV), non-durable goods (food, clothing), and services (doctors, transport).
- A house is classified as investment, not consumption, because it provides services over many years.
(ii) Gross Domestic Private Investment (I)
- Spending on new capital goods — machinery, buildings, equipment.
- Only real investment (new productive assets) counts, not financial investment (buying existing shares).
- Drives economic growth by expanding productive capacity.
Agricultural example: A farmer buying a new combine harvester is real investment. Buying shares of Mahindra Tractors is financial investment (not counted here).
(iii) Net Foreign Investment (X − M)
- Net Exports = Exports − Imports.
- A trade surplus (positive) adds to GDP; a trade deficit (negative) subtracts from it.
Agricultural example: India exports Rs 50,000 crore of basmati rice and imports Rs 70,000 crore of edible oils. Net agricultural trade = −Rs 20,000 crore (deficit, subtracted from GDP).
(iv) Government Expenditure on Goods and Services (G)
- Government purchases of goods and investment in infrastructure.
- Transfer payments (subsidies, pensions) are excluded — they are redistribution of income, not payment for new production.
Agricultural example: Government spending on building a canal irrigation system is included. PM-KISAN cash transfer is excluded.
GDP = C + I + (X − M) + G
This is the fundamental GDP identity — the most important equation in macroeconomics.
Exam Tip: Remember the components as CIGG-X — Consumption, Investment, Government spending, Government transfers (excluded!), net eXports.
Difficulties in Measuring National Income
| Difficulty | Explanation | Agricultural Relevance |
|---|---|---|
| Non-monetised transactions | Output consumed at home, never sold | Subsistence farmers eating their own grain |
| Illiteracy | Poor record-keeping | Small farmers unable to maintain accounts |
| Multiple occupations | Income classification is hard | A farmer who also does casual labour and petty trading |
| Lack of statistical data | Incomplete surveys | Remote tribal farming areas |
| Inventory valuation | Difficult to value raw material stocks | Stored grain whose price fluctuates seasonally |
| Depreciation estimation | Subjective and complex | Estimating wear on bullocks, hand tools, or pump sets |
Uses of National Income Data
National income data helps:
- Policymakers — identify which sectors (agriculture, industry, services) need support.
- Economists — analyse structural changes (e.g., agriculture's share of GDP declining from 52% in 1950 to ~18% today).
- International organisations — compare economic performance across countries.
- Agricultural planners — allocate resources for irrigation, credit, and rural development.
National Income Measurement in India
| Parameter | Detail |
|---|---|
| Calculating agency | National Statistical Office (NSO) (formerly Central Statistical Organisation, CSO) |
| Base year for GDP | 2011-12 |
| India's GDP rank | 5th largest economy globally |
| Methodology change (2015) | Shifted from GDP at factor cost to GDP at market price and Gross Value Added (GVA) |
| Standard followed | UN System of National Accounts 2008 |
GDP at Market Price = GDP at Factor Cost + Indirect Taxes − Subsidies
Gross Value Added (GVA)
GVA measures the total output and income of the economy after deducting the cost of intermediate inputs. It is especially useful for sector-level analysis.
GVA = GDP + Subsidies on Products − Taxes on Products
Agricultural example: If the agriculture sector produces output worth Rs 40 lakh crore, uses inputs worth Rs 15 lakh crore, and receives subsidies of Rs 2 lakh crore, then agricultural GVA = Rs 40 − Rs 15 + Rs 2 = Rs 27 lakh crore.
GDP vs GVA — Comparison
| Parameter | GDP | GVA |
|---|---|---|
| Perspective | Demand side (consumers) | Supply side (producers) |
| Tax effect | Influenced by tax changes | Not distorted by tax changes |
| Sector analysis | Overall economy | Sector-specific breakdown |
| International comparison | Preferred for cross-country comparison | Less commonly used internationally |
| Policy use | Broad economic health | Targeted sector-specific policies |
Why GVA is useful for agriculture: If GVA from agriculture declines while services GVA grows, the government can redirect policy attention (more credit, better MSP, irrigation investment) to revive the farm sector — something aggregate GDP alone would not reveal.
Summary Cheat Sheet
| Concept / Topic | Key Details / Explanation |
|---|---|
| Circular Flow of Income | Resources flow from households to firms; goods/services flow back; every rupee spent = income for another (Wheel of Wealth) |
| Leakages (STI) | Savings, Taxes, Imports — reduce the circular flow |
| Injections (IGE) | Investment, Government spending, Exports — increase the circular flow |
| National Income (Pigou) | Total monetary value of goods/services produced by a country's residents in a year, including income from abroad |
| GDP | Total market value of all final goods/services within domestic territory in a year; key word = "where" |
| Not included in GDP | Unpaid services, sale of old goods, transfer payments (PM-KISAN), share/bond transactions, capital gains |
| Double Counting | Counting both intermediate and final goods; avoided by using value-added method |
| GNP | GDP + Net Factor Income from Abroad (NFIA); key word = "who" (nationality) |
| NNP at Market Price | GNP − Depreciation; also = C + I + G + (X − M) |
| Depreciation | Loss in value of fixed capital due to wear and tear; also called capital consumption allowance |
| NNP at Factor Cost = National Income | NNP at MP − Indirect Taxes + Subsidies; removes tax distortion |
| Personal Income | NI − Social Security Contributions − Corporate Tax − Undistributed Profits + Transfer Payments |
| Disposable Income | PI − Personal Taxes = Consumption Expenditure + Savings |
| Production (Value-Added) Method | Sums value added at each production stage; Value Added = Output − Intermediate Inputs; avoids double counting |
| Income Method | Sums all factor incomes: Wages + Rent + Interest + Profits + Indirect Taxes + Depreciation − Transfer Payments |
| Expenditure Method | GDP = C + I + (X − M) + G; C = consumption (largest component), I = investment, G = government, X−M = net exports |
| Transfer Payments | Excluded from GDP — redistribution of income, not payment for new production (e.g., PM-KISAN, pensions) |
| Real vs Financial Investment | Only real investment (new productive assets) counts in GDP; buying existing shares does not count |
| Measurement Difficulties | Non-monetised transactions, illiteracy, multiple occupations, lack of statistical data, depreciation estimation |
| NSO (formerly CSO) | National Statistical Office — calculates India's national income |
| GDP Base Year | 2011-12; India is the 5th largest economy globally |
| 2015 Methodology Change | Shifted from GDP at factor cost to GDP at market price and Gross Value Added (GVA) |
| GVA | GDP + Subsidies − Taxes on Products; measures from supply side; useful for sector-level analysis |
| GDP vs GVA | GDP = demand side (consumers); GVA = supply side (producers); GVA not distorted by tax changes |
| GDP at Market Price Formula | GDP at Factor Cost + Indirect Taxes − Subsidies |
| National Income Chain Mnemonic | GDP → (+NFIA) → GNP → (−Dep) → NNP at MP → (−IT+Sub) → NI → PI → (−Tax) → DI |
| PIE Mnemonic | Production, Income, Expenditure — three methods of measuring national income |