📈 Introduction to Statistics
Foundations of statistics in agriculture — data types, variables, classification, frequency distribution, biometry, and vital statistics
Imagine a farmer growing ten different rice varieties across his fields. At harvest, he records yields from every plot — but a pile of raw numbers tells him nothing until he organises, summarises, and interprets them. This is precisely what statistics does for agriculture: it transforms raw field data into actionable decisions.
What Is Statistics?
- Statistics is a branch of science that deals with collection, presentation, analysis, and interpretation of data. These four pillars form the foundation of all statistical work in agriculture, economics, and every other field.
- Statistics can be used either as plural or singular.
- When used as plural, it refers to a systematic presentation of facts and figures — production of food grains in different years, area under cereal crops, per capita income at different times, etc. These figures are generally published in trade journals, statistical bulletins, and newspapers.
- When used as singular, it is a complete science dealing with collection, classification, tabulation, analysis, and interpretation of data — with its own methods and theories.
IMPORTANT
Pro Content Locked
Upgrade to Pro to access this lesson and all other premium content.
₹99 charged monthly · Cancel anytime
- All Agriculture & Banking Courses
- AI Lesson Questions (100/day)
- AI Doubt Solver (50/day)
- Glows & Grows Feedback (30/day)
- AI Section Quiz (20/day)
- 22-Language Translation (100/day)
- Recall Questions (20/day)
- AI Quiz (15/day)
- AI Quiz Paper Analysis (100/day)
- AI Step-by-Step Explanations (100/day)
- Spaced Repetition Recall (FSRS)
- AI Tutor
- Immersive Text Questions
- Audio Lessons — Hindi & English
- Mock Tests & Previous Year Papers
- Summary & Mind Maps
- XP, Levels, Leaderboard & Badges
- Generate New Classrooms
- Voice AI Teacher (AgriDots Live)
- AI Revision Assistant
- Knowledge Gap Analysis
- Interactive Revision (LangGraph)
🔒 Secure via Razorpay · Cancel anytime · No hidden fees
Imagine a farmer growing ten different rice varieties across his fields. At harvest, he records yields from every plot — but a pile of raw numbers tells him nothing until he organises, summarises, and interprets them. This is precisely what statistics does for agriculture: it transforms raw field data into actionable decisions.
What Is Statistics?
- Statistics is a branch of science that deals with collection, presentation, analysis, and interpretation of data. These four pillars form the foundation of all statistical work in agriculture, economics, and every other field.
- Statistics can be used either as plural or singular.
- When used as plural, it refers to a systematic presentation of facts and figures — production of food grains in different years, area under cereal crops, per capita income at different times, etc. These figures are generally published in trade journals, statistical bulletins, and newspapers.
- When used as singular, it is a complete science dealing with collection, classification, tabulation, analysis, and interpretation of data — with its own methods and theories.
IMPORTANT
The flow of statistical work: Collection → Classification → Tabulation → Analysis → Interpretation
- The first step of summarising data is classification — grouping raw data into meaningful categories before any further analysis.
Application of Statistics in Agriculture
Statistics plays an indispensable role in agricultural research and planning:
- Planning — National resource allocation for agriculture depends on statistical data about production, consumption, and trade.
- Business — Market research, production forecasting, and quality control of agricultural inputs rely on statistical methods.
- Economics — Comparing crop yields across regions, correlating rainfall with production, and estimating demand-supply gaps all require statistical tools.
- Administration — Population data, military strength, and governance indicators depend on statistics — it is regarded as the eyes of administration.
- Insurance and Banking — Crop insurance companies use yield statistics and loss probability data; banks use statistics to plan agricultural credit disbursement.
Agricultural Applications
| Area | Statistical Application |
|---|---|
| Land classification | Dry lands, wet lands, irrigated areas, rainfed areas |
| Irrigation | Estimating water requirement per crop per day |
| Soil science | Classifying soils based on chemical analysis |
| Entomology | Estimating yield losses from pest attacks |
| Agricultural economics | Demand-supply forecasting, regression analysis |
| Animal science | Analysing feeding trials, milk yield data |
| Agricultural engineering | Irrigation research, machinery design |
Biometry
- The application of statistical concepts and procedures to study biological problems. Biometry bridges biological sciences and mathematics, enabling researchers to quantify and analyse living systems.
Vital Statistics
- Numerical records of marriage, births, sickness, and death by which a community's health and growth may be studied.
- It is a branch of biometry dealing with data and laws of human mortality, morbidity, and demography. These records are essential for healthcare planning and population policy.
- Father of vital statistics: Captain John Grant.
Limitations of Statistics
WARNING
Understanding limitations is as important as knowing applications. These are frequently asked in exams.
| Limitation | Explanation |
|---|---|
| Not for qualitative phenomena | Cannot directly measure beauty, honesty, or intelligence |
| Not for individuals | Always deals with aggregate data — a single observation has no statistical significance |
| Not exact laws | Conclusions are based on probabilities, not certainties |
| Not complete information | Shows trends and patterns, not the full picture |
| Liable to misuse | Selective or incorrect use of data leads to misleading conclusions |
| Valid only on average | Conclusions hold on an average basis, not for every individual case |
TIP
Mnemonic for limitations: "Q-I-E-C-M-A" — Qualitative (no), Individuals (no), Exact (no), Complete (no), Misuse (yes), Average (only).
Types of Data
TIP
Remember: Primary = collected by you (first-hand), Secondary = collected by others (second-hand).
- Primary Data: Collected by the investigator himself — fresh, original, and specifically for the study at hand. Example: a researcher personally recording wheat yields from experimental plots.
- Secondary Data: Collected from secondary sources like newspapers, trade journals, and statistical bulletins. Example: using government crop production data published by the Directorate of Economics and Statistics.
Variables and Attributes
- Variable: A quantitative or qualitative characteristic that varies from observation to observation within the same group. All statistical analysis revolves around measuring and explaining variation.
- A single observation or measurement is called a variate.
- Quantitative variables use interval scales; qualitative variables use nominal scales.
Interval Scale
Nominal Scale

- Conventionally, quantitative variables are termed variables and qualitative variables are termed attributes.
- Variables: yield of a crop, available nitrogen in soil, daily temperature, number of leaves per plant, number of eggs laid by insects.
- Attributes: crop varieties, soil types, shape of seeds, seasons, sex of insects — these cannot be measured numerically but are classified into distinct categories.
Continuous and Discrete Variables
| Feature | Continuous Variable | Discrete Variable |
|---|---|---|
| Definition | Fractional measurements are possible | Only whole number values |
| Agricultural example | Yield: 7.15 kg, 7.024 kg | Grains per panicle: 79, 80, 81 |
| Nature | Can take any value in a range | Only integer values |
| Notation | Denoted by X, Y | Denoted by X, Y |
Construction of Frequency Distribution Table
A frequency distribution organises raw data into groups (classes), each showing the count (frequency) of observations within that interval. It is one of the first steps in making sense of field data.
Steps for construction:
-
Step 1: Decide the number of classes using Yule's formula:
Number of classes = 2.5 x n1/4 Where 'n' is the total number of observations.
-
Step 2: Determine the class interval:

-
Step 3: Count frequencies using tally marks.
-
Step 4: Construct the table using either the Exclusive or Inclusive method.
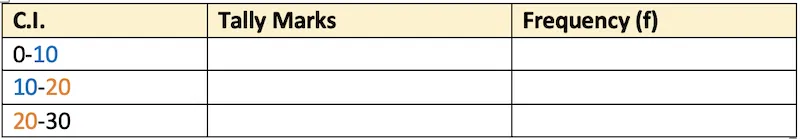
a) Exclusive Method
- The upper limit of one class equals the lower limit of the next — no gap between classes. Every observation falls into exactly one class.
- It is a continuous distribution.
b) Inclusive Method
- A gap exists between the upper limit of one class and the lower limit of the next.
- It is a discontinuous distribution.
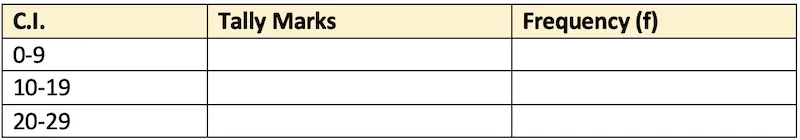
- To convert discontinuous to continuous distribution: subtract 0.5 from the lower limit and add 0.5 to the upper limit. This correction factor ensures no data values fall between classes.
Key terms:
- Class: A group in the frequency table
- Frequency: Number of observations in a class
- Class interval: Difference between upper and lower limits (should be uniform)
- Mid value: Average of the two limits of a class
Worked Example
Problem: Construct a frequency distribution table for: 25, 32, 45, 8, 24, 42, 22, 12, 9, 15, 26, 35, 23, 41, 47, 18, 44, 37, 27, 46, 38, 24, 43, 46, 10, 21, 36, 45, 22, 18.
Solution:
- n = 30
- Number of classes = 2.5 x 301/4 = 2.5 x 2.3 = 5.8 ≈ 6
- C.I. = (46 - 8)/6 = 6.3 ≈ 6
Exclusive method
| C.I. | Tally marks | Frequency (f) |
|---|---|---|
| 7.5-14.5 | |||| | 4 |
| 14.5-21.5 | |||| | 4 |
| 21.5-28.5 | 8 | |
| 28.5-35.5 | || | 2 |
| 35.5-42.5 | 5 | |
| 42.5-49.5 | 7 | |
| Total | 30 |
Inclusive method
| C.I. | Tally marks | Frequency (f) |
|---|---|---|
| 8-14 | |||| | 4 |
| 15-21 | |||| | 4 |
| 22-28 | 8 | |
| 29-35 | || | 2 |
| 36-42 | 5 | |
| 42-49 | 7 | |
| Total | 30 |
Exam Tips and Summary
TIP
High-frequency exam points from this chapter:
- First step of summarising data = Classification
- Father of vital statistics = Captain John Grant
- Yule's formula = 2.5 x n1/4
- Correction factor for inclusive to exclusive = subtract/add 0.5
- Statistics deals with aggregates, not individuals
| Concept | Key Point |
|---|---|
| Statistics (plural) | Facts and figures |
| Statistics (singular) | Complete science of data |
| Primary data | Collected first-hand by investigator |
| Secondary data | From published sources |
| Variable | Quantitative characteristic (yield, weight) |
| Attribute | Qualitative characteristic (variety, soil type) |
| Continuous variable | Fractional values possible (yield in kg) |
| Discrete variable | Whole numbers only (grains per panicle) |
| Biometry | Statistics applied to biology |
| Vital statistics | Records of births, deaths, marriages |
| Yule's formula | Number of classes = 2.5 x n1/4 |
Summary Cheat Sheet
| Concept / Topic | Key Details |
|---|---|
| Statistics (plural) | Systematic presentation of facts and figures — production data, area, income |
| Statistics (singular) | Complete science of collection, classification, tabulation, analysis, interpretation |
| First step of summarising data | Classification — grouping raw data into categories |
| Father of Vital Statistics | Captain John Grant |
| Biometry | Application of statistics to biological problems |
| Vital statistics | Numerical records of marriage, births, sickness, death |
| Primary data | Collected first-hand by the investigator |
| Secondary data | Collected from published sources (journals, bulletins) |
| Variable | Quantitative characteristic — yield, weight, temperature |
| Attribute | Qualitative characteristic — variety, soil type, season |
| Continuous variable | Fractional values possible (e.g., yield 7.15 kg) |
| Discrete variable | Only whole number values (e.g., grains per panicle) |
| Interval scale | Used for quantitative variables |
| Nominal scale | Used for qualitative variables |
| Yule's formula | Number of classes = 2.5 x n^(1/4) |
| Class interval | (Max value - Min value) / Number of classes |
| Exclusive method | Upper limit of one class = lower limit of next; continuous distribution |
| Inclusive method | Gap exists between classes; discontinuous distribution |
| Correction factor | Subtract 0.5 from lower limit, add 0.5 to upper limit |
| Limitations of statistics | Cannot measure qualitative phenomena; deals with aggregates only |
| Statistics cannot give | Exact laws — conclusions based on probabilities |
| Statistics is liable to | Misuse if data is selectively or incorrectly used |
| Applications in agriculture | Planning, land classification, irrigation, entomology, economics |
| Mid value | Average of upper and lower class limits |
| Frequency | Number of observations falling in a class |