🌐 Atmospheric Layers & Lapse Rates: The Atmosphere Above Our Fields
Vertical structure of the atmosphere from troposphere to exosphere, ozone layer, environmental and adiabatic lapse rates — with agricultural significance and exam mnemonics
Why Farmers Should Care About Atmospheric Layers
In the previous lesson, we established the foundations of meteorology — atmospheric composition, weather vs climate, seasons, and iso-lines. Now we look upward: how is the atmosphere structured vertically, and why does temperature change with altitude?
When a cold wave descends on north Indian wheat fields in January, the damage depends on how temperature changes with altitude. When cloud seeding aircraft fly into clouds to induce rain for drought-hit crops, they operate in a specific atmospheric layer. Understanding the vertical structure of the atmosphere helps explain frost formation, cloud behaviour, rainfall patterns, and radiation reaching crop canopies.
This lesson covers:
- Atmospheric composition and mass distribution — where the atmosphere's weight is concentrated
- Five atmospheric layers — Troposphere through Exosphere, with agricultural relevance
- Lapse rates — Normal, Dry Adiabatic, and Wet Adiabatic — and their role in weather stability
All topics are high-yield for IBPS AFO, NABARD Grade A, and FCI exams.
The Atmosphere — An Introduction
The atmosphere is the blanket of gases surrounding Earth, held in place by gravity. It extends to about 1600 km, but 99% of its total mass is concentrated within just 32 km of the surface. It contains O₂ for animal respiration, CO₂ for plant photosynthesis, water vapour for cloud formation and precipitation, and dust particles that serve as condensation nuclei for rain. The atmosphere also blocks harmful ultraviolet radiation and maintains a suitable temperature range for life.
Atmospheric Composition
| Constituent | By Volume (%) | By Weight (%) |
|---|---|---|
| Nitrogen (N₂) | 78.088 | 75.527 |
| Oxygen (O₂) | 20.949 | 23.134 |
| Argon (Ar) | 0.930 | 1.282 |
| Carbon Dioxide (CO₂) | 0.030 | 0.045 |
| Total | 99.997 | 99.997 |
| Gas | Role in Agriculture |
|---|---|
| Nitrogen (N₂) | Raw material for biological nitrogen fixation by Rhizobium and other N-fixing organisms |
| Oxygen (O₂) | Essential for root and seed respiration; soil aeration critical for crop growth |
| Carbon Dioxide (CO₂) | Primary input for photosynthesis; rising levels affect crop growth and water-use efficiency |
| Water Vapour | Drives cloud formation and precipitation; controls humidity affecting transpiration |
| Argon (Ar) | Inert — no agricultural role |
TIP
Exam tip: Although CO₂ and water vapour are present in trace amounts, they have disproportionately large effects on weather and climate due to their greenhouse properties.
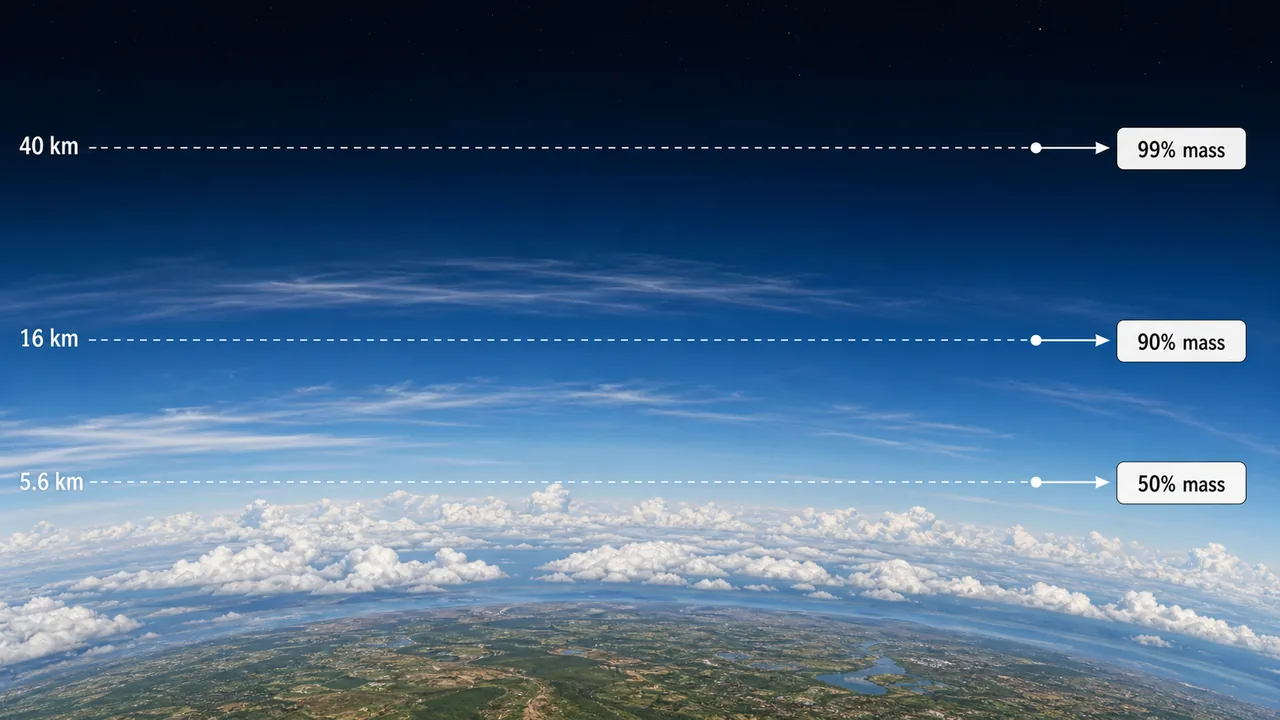
Mass Distribution
- 50% of atmospheric mass lies below 5.6 km
- 90% of atmospheric mass lies below 16 km
- 99% of atmospheric mass lies below 40 km
- Air density at sea level: 1.2 kg/m³
IMPORTANT
Exam fact: Nearly all the atmosphere's mass is packed into a thin shell close to the surface. This is why the troposphere (0–18 km) contains 75% of atmospheric gases and is the densest layer — it is where all weather and agriculture happen.
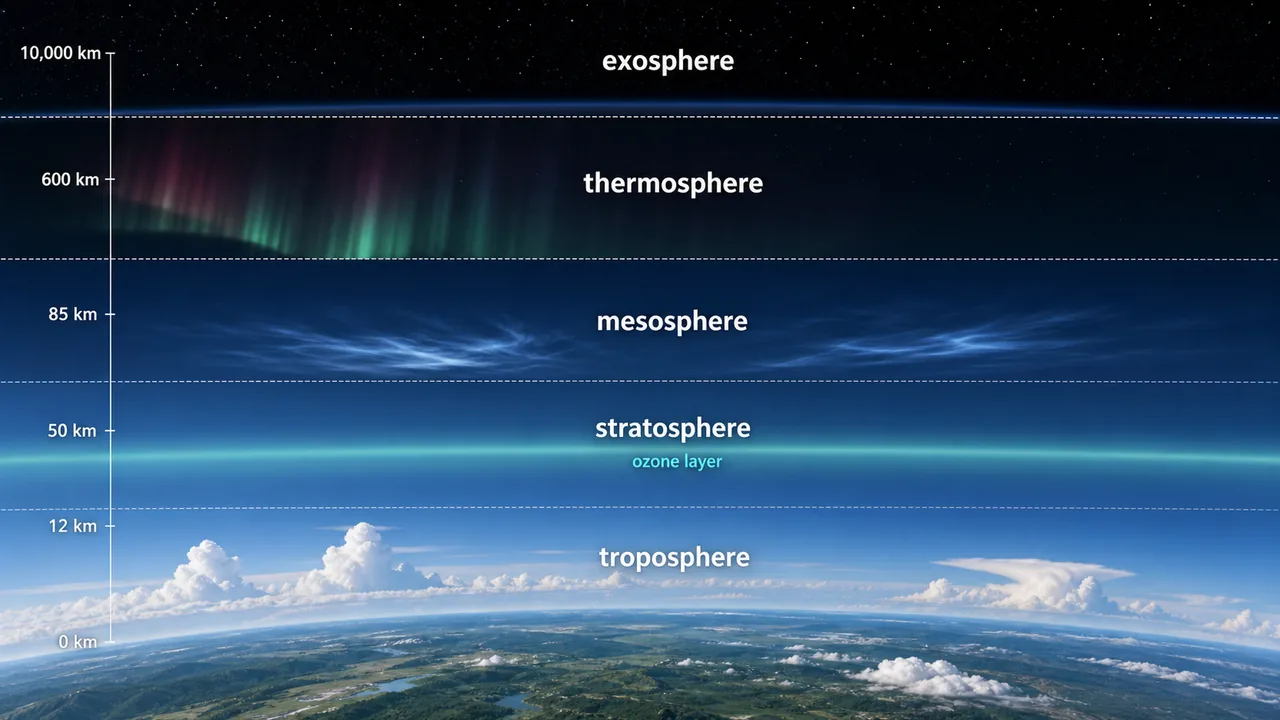
Overview of Atmospheric Layers
The atmosphere is divided into layers based on how temperature changes with altitude. Each layer has distinct properties that affect weather, radiation, and ultimately agriculture.
| Layer | Altitude | Key Feature | Temperature Trend | Agricultural Relevance |
|---|---|---|---|---|
| Troposphere | 0–18 km (avg) | Seat of weather phenomena | Decreases with height | All weather affecting crops occurs here |
| Stratosphere | ~20–55 km | Seat of photochemical reactions; ozone layer | Increases with height | Ozone filters UV that would destroy crops |
| Mesosphere | 50–80 km | Coldest region; chemosphere | Decreases with height | No direct agricultural impact |
| Thermosphere (Ionosphere) | 80–400 km | Radio communication; aurora | Increases rapidly | Satellite communication for weather forecasting |
| Exosphere | 400–1000 km | H and He escape to space | — | Remote sensing satellites orbit here |
TIP
Mnemonic — "The Soil Makes Things Easy": Troposphere → Stratosphere → Mesosphere → Thermosphere → Exosphere. Each boundary is named by adding "-pause" to the layer below it (tropopause, stratopause, mesopause).
A. Troposphere — Where All Weather Happens
The troposphere is the most important layer for agriculture because all weather phenomena occur here.
Key Facts
- Temperature decreases with altitude in this layer.
- Average height: about 18 km above mean sea level.
- At the equator: 16–18 km; at the poles: 7–8 km.
- The word "Trop" means mixing or turbulence; "sphere" means region.
- Contains about 75 per cent of total atmospheric gases and most moisture and dust particles.
- The densest part of the atmosphere.
- Called the "seat of weather phenomena" — clouds, thunderstorms, cyclones, and anticyclones all occur here.
Tropopause
The thin boundary separating the troposphere from the stratosphere is the tropopause.
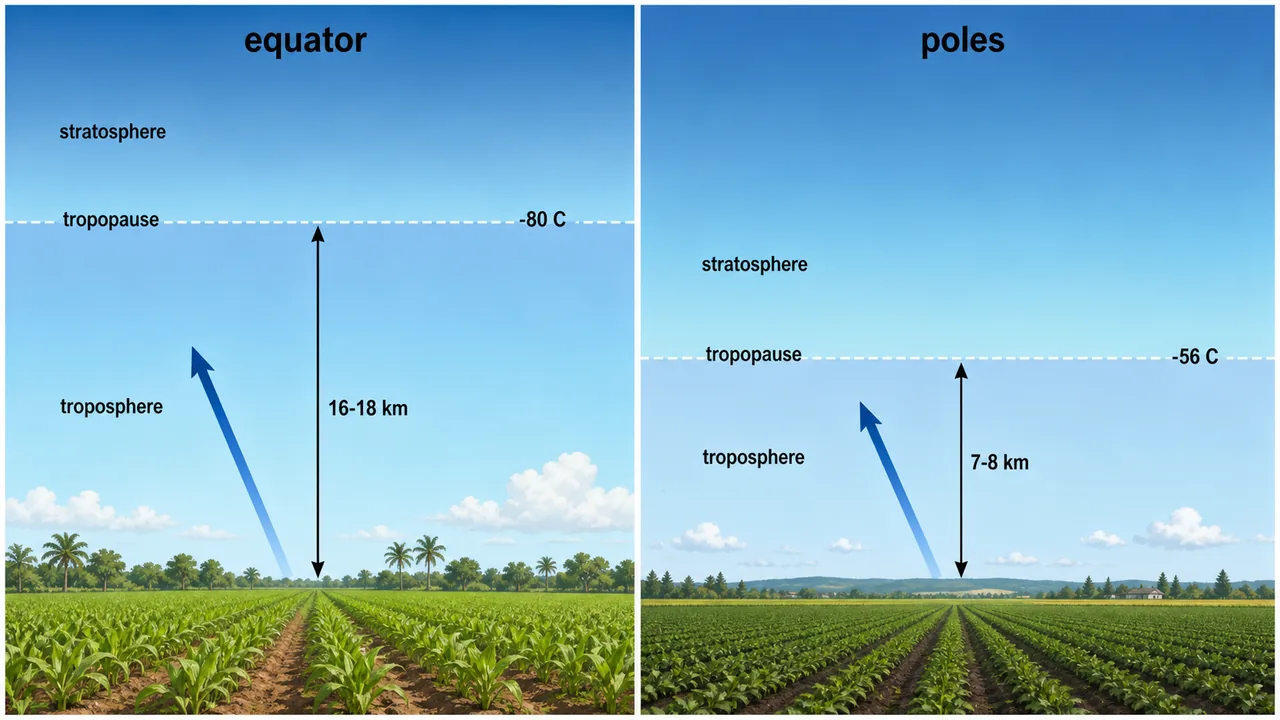
| Location | Temperature at Tropopause |
|---|---|
| Over the equator | -80°C |
| Over the poles | -56°C |
IMPORTANT
Counter-intuitive exam fact: The tropopause is colder over the equator (-80°C) than over the poles (-56°C), even though the equator is warmer at the surface. This happens because the troposphere is much taller at the equator, so air rises higher and cools more.
Agricultural significance: All precipitation, wind patterns, temperature variations, frost events, and monsoon systems that affect crops operate within the troposphere.
B. Stratosphere — The Protective Shield
The stratosphere lies above the tropopause and extends from about 20 km to 50–55 km.
Key Facts
- Called the "seat of photochemical reactions".
- It is dust-free, cloud-free, and the warmest layer (at its upper boundary).
- Pressure is 1/1000th of sea level.
- Temperature near the tropopause is isothermal (constant), then increases with height due to ozone absorbing UV radiation.
- Less convection occurs because the layer is warm at the top and cold at the bottom (stable arrangement).
- The upper boundary is the stratopause.
- Occasionally experiences explosive warming — a sudden rise of 30–40°C in a few days, mainly at higher latitudes.
Ozone Layer
| Property | Value |
|---|---|
| Location | Within the stratosphere |
| Ozone concentration | 90% of atmospheric ozone is here |
| Peak concentration altitude | ~32 km (20 miles) |
| Peak concentration | Up to 15 ppm |
| Key function | Absorbs UV rays, protecting life on earth |
| Temperature effect | Ozonosphere is warm due to UV absorption |
WARNING
Common exam confusion: The ozone layer is in the stratosphere, but the ozone peak concentration is at ~32 km. The stratosphere itself extends from ~20 to 55 km.
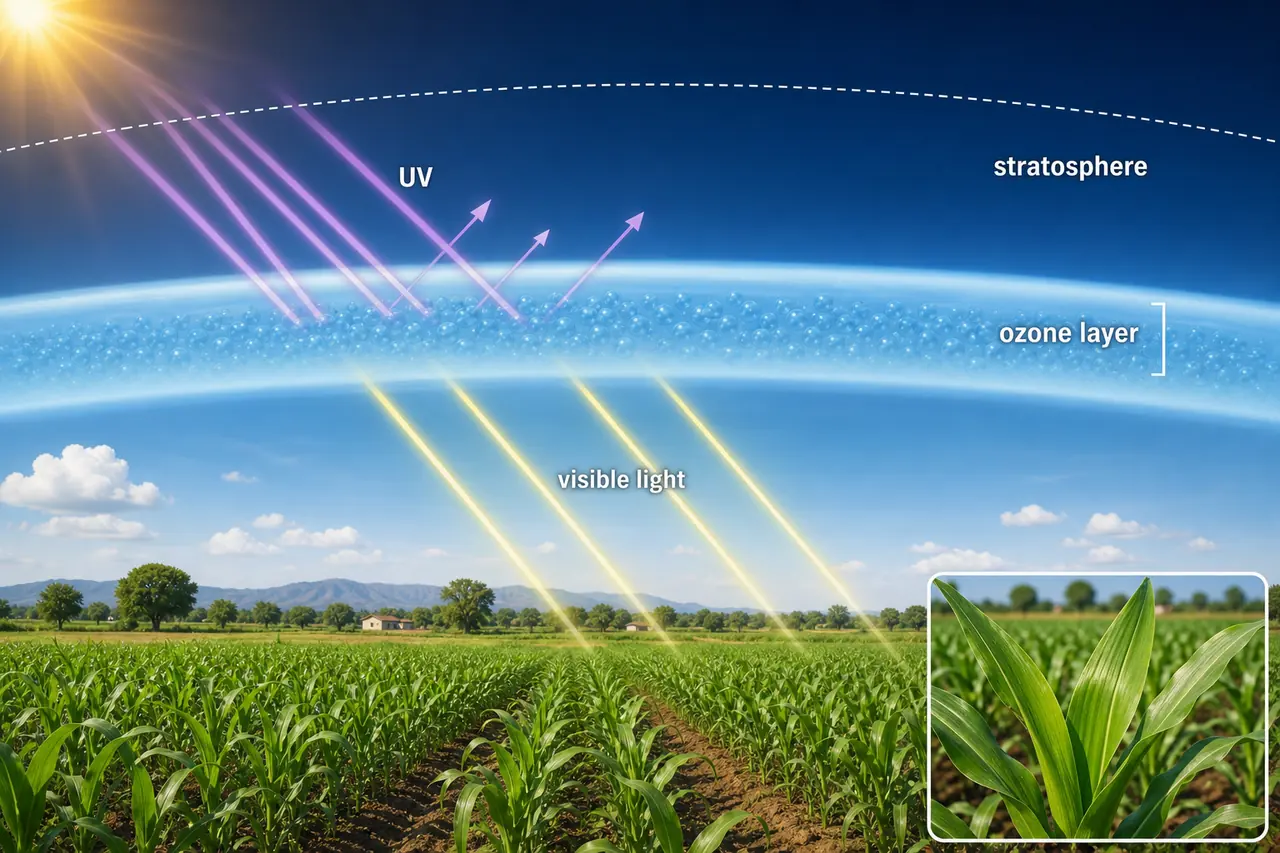
Agricultural significance: Without the ozone layer, UV radiation would reach the earth's surface and destroy crops, kill beneficial soil microbes, and make agriculture impossible. Ozone depletion increases UV-B radiation, which can damage plant DNA and reduce photosynthesis.
C. Mesosphere — The Coldest Region
The mesosphere extends from 50 to 80 km above the earth's surface.
Key Facts
- Also called the "chemosphere" due to the dominance of chemical processes.
- Temperature decreases with height in this layer.
- The coldest region in the atmosphere — temperature drops to nearly -95°C at the mesopause (80 km).
- Noctilucent clouds (the highest clouds in Earth's atmosphere) are observed here.
- The upper boundary is the mesopause.
Agricultural significance: No direct impact on farming, but understanding this layer helps in weather modelling and satellite-based crop monitoring.
D. Thermosphere (Ionosphere) — Communication Layer
The thermosphere extends from 80 km to about 400 km.
Key Facts
- The atmosphere here is partly ionised — enriched ion zones exist as distinct layers, hence called the ionosphere.
- Temperature rises rapidly, reaching nearly 1000°C by about 300 km.
- Radio communication is made possible by radio waves bouncing off ionised layers.
- The International Space Station orbits in this layer.
- Aurora (borealis in the north, australis in the south) occurs here.
TIP
Exam quick-fire: Ionosphere = radio waves bounce back, temperature ~1000°C at 300 km, ISS orbits here, auroras visible here.
Agricultural significance: Weather satellites in this zone provide real-time data for crop weather advisories, monsoon tracking, and drought monitoring — essential for modern agriculture.
E. Exosphere — The Outermost Layer
The exosphere extends from 400 to 1000 km.
Key Facts
- The outermost layer of Earth's atmosphere.
- Extremely low density of atoms.
- Hydrogen and Helium gases predominate.
- At 500–600 km, atmospheric density is so low that particle collisions become extremely rare.
- This is the transition zone between Earth's atmosphere and interplanetary space.
Agricultural significance: Remote sensing satellites (like Landsat, Sentinel) orbiting in or near this zone provide crop health imagery, soil moisture maps, and vegetation indices used in precision agriculture.
Comparison of All Atmospheric Layers
| Property | Troposphere | Stratosphere | Mesosphere | Thermosphere | Exosphere |
|---|---|---|---|---|---|
| Altitude | 0–18 km | 20–55 km | 50–80 km | 80–400 km | 400–1000 km |
| Temperature trend | Decreases | Increases | Decreases | Increases | — |
| Special name | Seat of weather | Seat of photochemistry | Chemosphere | Ionosphere | — |
| Composition | All gases, moisture, dust | Ozone-rich, dust-free | Chemical processes | Ionised gases | H₂, He |
| Clouds | All weather clouds | None (cloud-free) | Noctilucent clouds | None | None |
| Coldest point | — | — | Mesopause (-95°C) | — | — |
Lapse Rate
The atmospheric layers above are defined by how temperature changes with altitude. The lapse rate quantifies this change — and it is one of the most important concepts in meteorology because it determines atmospheric stability, cloud formation, and rainfall.
Normal (environmental) lapse rate = 6.5°C/km
Farm example: If a valley floor is at 30°C, a hillside farm 1 km higher will be approximately 23.5°C. This is why tea grows on hills (cooler) while rice grows in valleys (warmer).
Adiabatic Lapse Rate
When an air mass rises or descends, its temperature changes through an adiabatic process — a thermodynamic change that occurs without exchange of heat with the surrounding environment.
The rate of temperature change depends on whether the air is saturated (containing moisture at capacity) or unsaturated:
| Type | Rate | Condition | Why Different? |
|---|---|---|---|
| Dry Adiabatic Lapse Rate (DALR) | 10°C/km | Unsaturated air (no condensation) | No latent heat released |
| Wet/Saturated Adiabatic Lapse Rate (WALR/SALR) | 6°C/km | Saturated air (condensation occurring) | Latent heat released during condensation partially offsets cooling |
The Three Lapse Rates — Comparison
| Lapse Rate | Value | Mnemonic Aid |
|---|---|---|
| Dry Adiabatic (DALR) | 10°C/km | Dry = highest (10) |
| Normal/Environmental | 6.5°C/km | Normal = middle (6.5) |
| Wet Adiabatic (WALR) | 6°C/km | Wet = lowest (6) |
IMPORTANT
Critical order for exams: DALR (10) > Normal (6.5) > WALR (6). This order determines atmospheric stability — when the environmental lapse rate exceeds DALR, the atmosphere is unstable and convective rainfall is likely.
Agricultural significance:
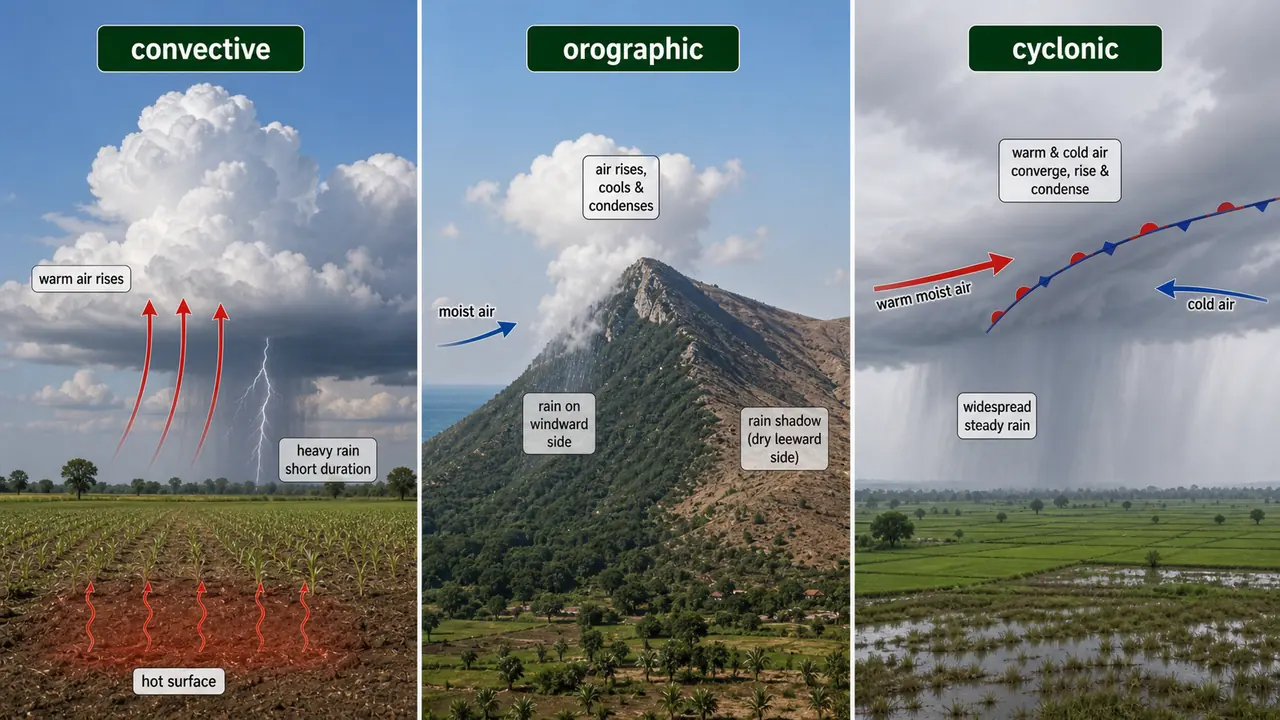
- Unstable atmosphere (steep lapse rate) → convective clouds form → afternoon thundershowers benefit kharif crops
- Stable atmosphere (shallow lapse rate) → fog and mist form → frost risk increases for rabi crops
- Orographic rainfall on Western Ghats follows the WALR as moist air rises over mountains, bringing rain to coffee and spice plantations on the windward side
Summary Table
| Topic | Key Fact | Exam Value |
|---|---|---|
| Atmosphere extent | ~1600 km total; 99% mass within 32 km | Basic definition |
| Atmospheric composition | N₂ 78%, O₂ 21%, Ar 0.93%, CO₂ 0.03% | Volume % frequently asked |
| Mass distribution | 50% below 5.6 km; 90% below 16 km; 99% below 40 km | Numerical question |
| Air density at sea level | 1.2 kg/m³ | Quick fact |
| Troposphere height | Average 18 km; equator 16–18 km; poles 7–8 km | Frequently asked |
| Troposphere | Seat of weather phenomena; 75% of atmospheric gases | Definition question |
| Tropopause temperature | Equator: -80°C; Poles: -56°C (colder at equator) | Counter-intuitive fact |
| Stratosphere | Seat of photochemical reactions; dust-free, cloud-free | Characteristic question |
| Ozone layer | 90% ozone in stratosphere; peak at 32 km; absorbs UV | Location question |
| Mesosphere | Coldest region (-95°C at mesopause); chemosphere | Coldest layer question |
| Thermosphere | Ionosphere; 1000°C at 300 km; radio communication; aurora | Multiple facts tested |
| Exosphere | 400–1000 km; H₂ and He; transition to space | Outermost layer question |
| Normal lapse rate | 6.5°C/km | Numerical question |
| DALR | 10°C/km (unsaturated air) | Numerical question |
| WALR/SALR | 6°C/km (saturated air) | Numerical question |
| Lapse rate order | DALR (10) > Normal (6.5) > WALR (6) | Comparison question |
TIP
Next: Lesson 03 covers monsoon systems and precipitation — the SW and NE monsoons, types of rainfall, frost vs dew, and El Nino/La Nina effects on Indian agriculture.
Summary Cheat Sheet
| Concept / Topic | Key Details / Explanation |
|---|---|
| Atmosphere Extent | ~1600 km total; 99% of mass concentrated within 32 km of surface |
| Atmospheric Composition (by volume) | N₂ 78.088%, O₂ 20.949%, Ar 0.930%, CO₂ 0.030% |
| Mass Distribution | 50% below 5.6 km; 90% below 16 km; 99% below 40 km |
| Air Density at Sea Level | 1.2 kg/m³ |
| Troposphere | 0–18 km avg (equator 16–18 km; poles 7–8 km); seat of all weather phenomena; contains 75% of atmospheric gases |
| Tropopause Temperature | Equator: −80°C; Poles: −56°C (equator is colder — counter-intuitive) |
| Stratosphere | 20–55 km; seat of photochemical reactions; dust-free and cloud-free; contains ozone layer |
| Ozone Layer | Located in stratosphere; 90% of ozone here; peak concentration at 32 km; absorbs harmful UV radiation; 15 ppm concentration |
| Mesosphere | 50–80 km; coldest region (−95°C at mesopause); also called chemosphere |
| Thermosphere | 80–400 km; ionosphere; temperature ~1000°C at 300 km; enables radio communication; site of aurora |
| Exosphere | 400–1000 km; composed of H₂ and He; transition zone to outer space |
| Normal (Environmental) Lapse Rate | 6.5°C per 1000 m (6.5°C/km) |
| Dry Adiabatic Lapse Rate (DALR) | 10°C/km — rate for unsaturated (dry) rising air |
| Wet Adiabatic Lapse Rate (WALR/SALR) | 6°C/km — rate for saturated (moist) rising air |
| Lapse Rate Order | DALR (10) > Normal (6.5) > WALR (6) |
| Agricultural Significance of Lapse Rates | Determines atmospheric stability, frost risk, cold wave intensity affecting crops |
Lesson Doubts
Ask questions, get expert answers