🌧️ Monsoon Systems & Precipitation: India's Rainfall Lifeline
Indian monsoon systems (SW and NE), types and forms of precipitation, frost vs dew, isohyets, rainfall classification, and climatic scales — with agricultural applications and exam mnemonics
Why the Monsoon Defines Indian Agriculture
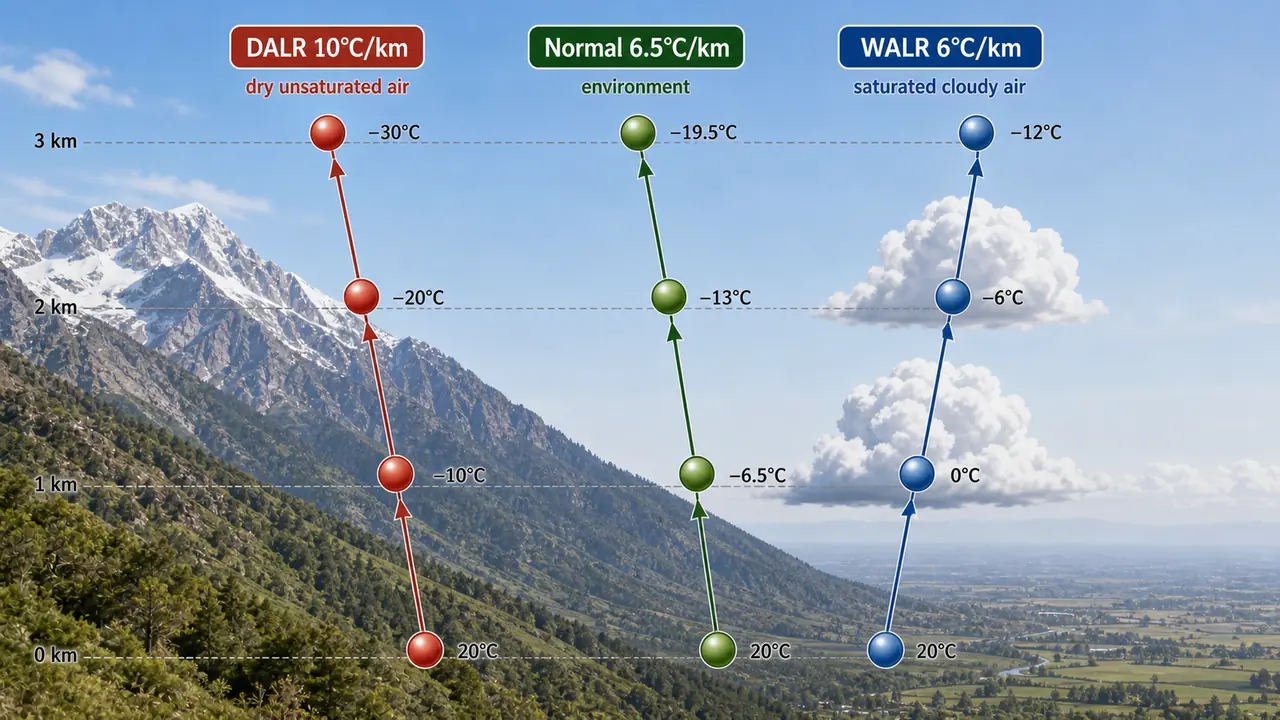
In the previous lesson, we explored the vertical structure of the atmosphere — the five layers, lapse rates, and how temperature changes with altitude determine weather stability. Now we turn to the most critical weather system for Indian farming: the monsoon.
India's 140 million hectares of rainfed farmland depend almost entirely on the monsoon. A week's delay in monsoon onset can push back rice transplanting across millions of hectares. A premature withdrawal can cause terminal drought in standing sorghum and groundnut. Understanding monsoon systems and precipitation types is fundamental to agricultural planning in India.
This lesson covers:
- Monsoon rainfall — the four rainy seasons and SW/NE monsoon branches
- El Nino and La Nina — Pacific Ocean effects on Indian monsoon strength
- Western disturbances — winter rainfall for rabi crops
- Types and forms of precipitation — cyclonic, orographic, convective; rain, hail, snow
- Frost vs Dew — the freezing-point distinction
- Rainfall measurement — rainy day thresholds and isohyets
- Rainfall-based climatic regions — arid to humid classification
All topics are high-yield for IBPS AFO, NABARD Grade A, and FCI exams.
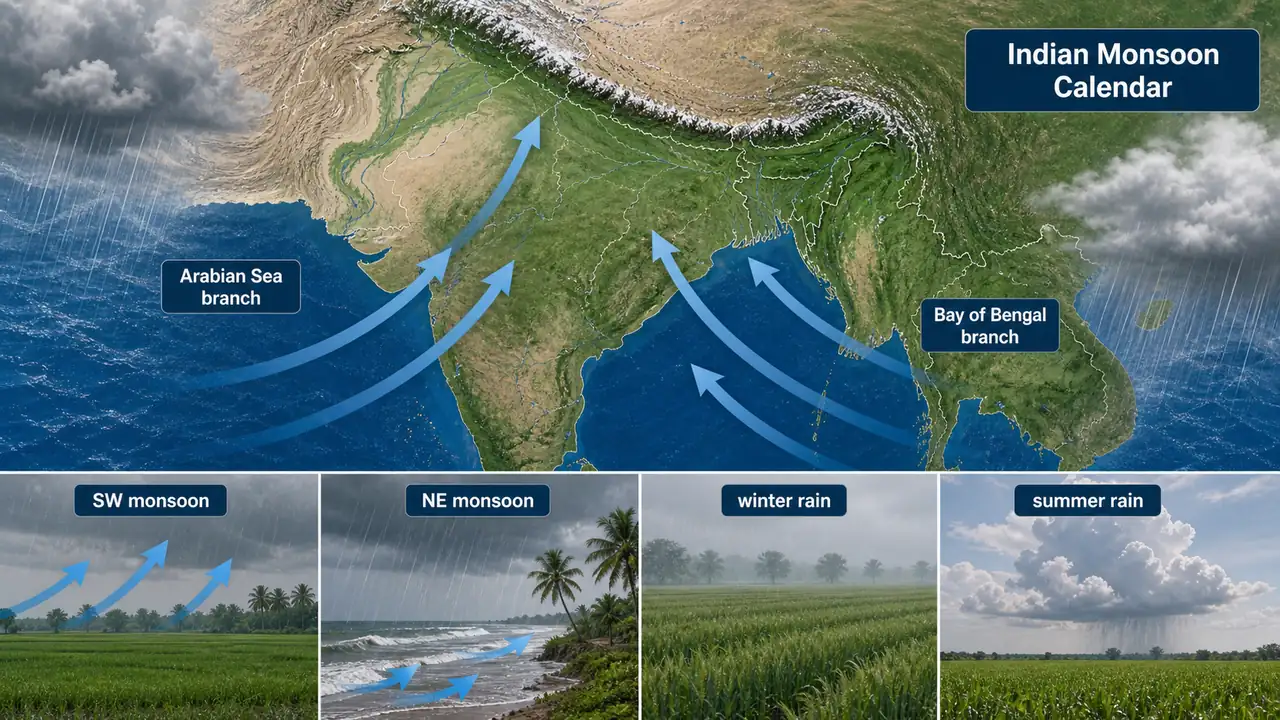
Monsoon Rainfall — The Four Rainy Seasons
India receives rainfall through a system called the monsoon, which consists of cyclones arising in the Indian Ocean. IMD recognises four distinct rainy seasons:
| Season | Period | Contribution | Agricultural Significance |
|---|---|---|---|
| South West (SW) Monsoon | June to September | 80–95% of total rainfall | Main kharif season — rice, maize, sorghum, groundnut, cotton. Covers ~300 m-ha |
| North East (NE) Monsoon | October to December | Major for TN and coastal AP | Samba rice in Tamil Nadu, rabi planting in south India. Covers ~100 m-ha |
| Winter Rainfall | January to February | Limited to north India | Beneficial for wheat and mustard in Punjab, Haryana |
| Summer Rainfall | March to May | Local storms | Mango showers in Kerala and Karnataka |
IMPORTANT
The SW monsoon is the most important — it contributes 75–95% of India's annual rainfall and is called the "grand period of rainfall".
South West Monsoon (June–September) — In Detail
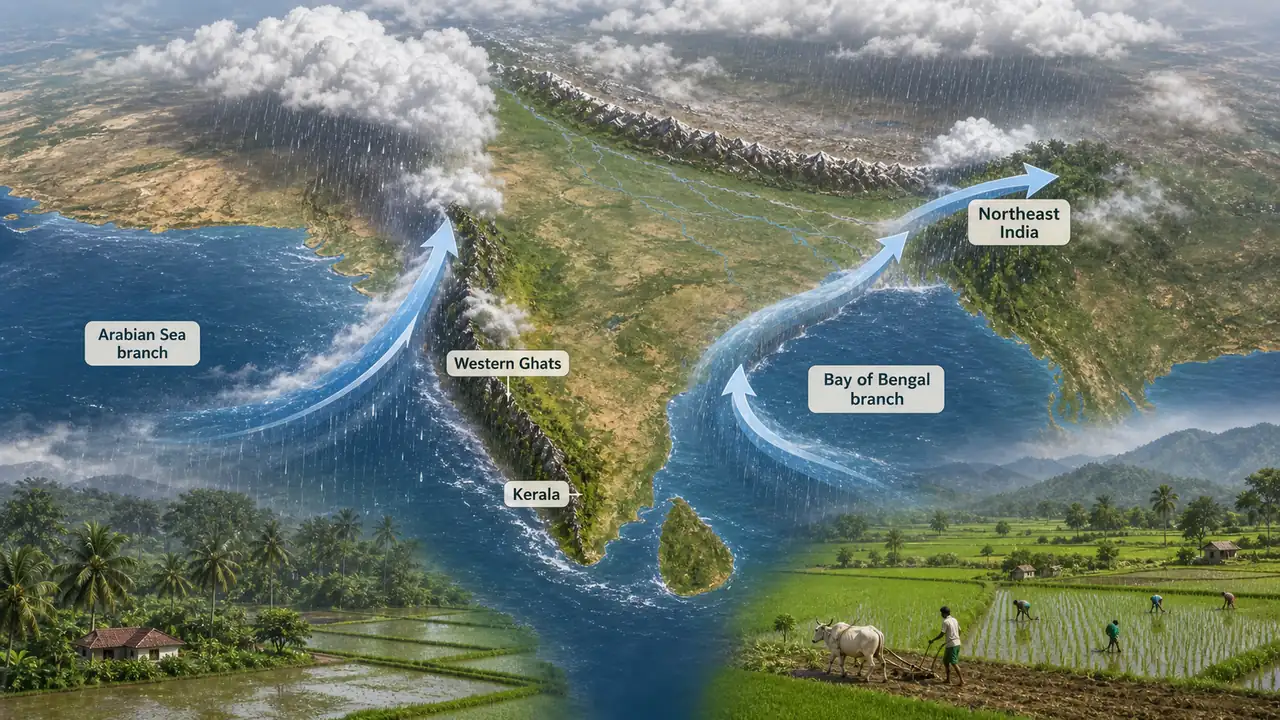
The SW monsoon has two branches that enter India from different directions:
Arabian Sea Branch
- First brings rainfall to the Western Ghats and the coast of Kerala.
- Kerala is the first state to receive SW monsoon rainfall.
- Moves northward along the Western Ghats.
Agricultural impact: Coffee, cardamom, pepper, and rubber plantations in Kerala and Karnataka depend on this branch.
Bay of Bengal Branch
- Operates simultaneously in the Bay of Bengal.
- Carries rain to Burma, north-eastern India, Bengal, Assam, and the whole of North India.
- Areas under this branch receive more than 1000 mm average annual rainfall.
Agricultural impact: Rice cultivation in the Gangetic plains, jute in Bengal, and tea in Assam depend on this branch.
Key SW Monsoon Facts
| Fact | Detail |
|---|---|
| Normal onset date | 1st June (Kerala) |
| Covers entire country by | 15th July |
| Contribution to annual rainfall | 74.9% of annual rainfall |
| LPA of SW Monsoon (1971–2020) | 868.6 mm (87 cm) |
| Annual Rainfall 2024 | 1206.6 mm (104% of LPA) |
| Average annual precipitation over India | 4000 BCM (Billion Cubic Metres) |
| Western Rajasthan rainfall | Less than 100 mm (monsoon barely reaches) |
Normal Monsoon Onset & Withdrawal Dates
| Location | Normal Date |
|---|---|
| South Andaman Sea | 20 May |
| Kerala | 1 June |
| Mumbai | 10 June |
| New Delhi | 29 June |
| Entire country covered | 15 July |
| Withdrawal from W. Rajasthan | 15 September |
Monthly Contribution of SW Monsoon
| Month | % Contribution |
|---|---|
| June | 19.1% |
| July | 32.3% (highest) |
| August | 29.4% |
| September | 19.3% |
State-Specific Monsoon Dependence
| State | Key Rainfall Pattern |
|---|---|
| Gujarat | 96% rainfall from SW Monsoon |
| Tamil Nadu | 48% rainfall from Post-Monsoon (NE Monsoon, Oct–Dec) |
Seasonal Normal Rainfall (1971–2020)
| Season | Months | Rainfall (mm) | % of Annual |
|---|---|---|---|
| Winter | Jan–Feb | 39.8 | 3.4% |
| Pre-Monsoon | Mar–May | 130.6 | 11.3% |
| SW Monsoon | Jun–Sep | 868.6 | 74.9% |
| Post-Monsoon | Oct–Dec | 121.0 | 10.4% |
TIP
July = 32.3% — highest monthly share of SW monsoon rainfall. Gujarat is almost entirely SW monsoon dependent (96%), while Tamil Nadu uniquely depends on NE monsoon (48%).
North East Monsoon (October–December)
- Also called the winter monsoon or retreating monsoon.
- Brings rainfall to Jammu & Kashmir, Tamil Nadu (TN), and southern Andhra Pradesh (AP).
Agricultural impact: Tamil Nadu's samba paddy season depends entirely on the NE monsoon. Failure of NE monsoon causes severe drought in coastal Tamil Nadu.
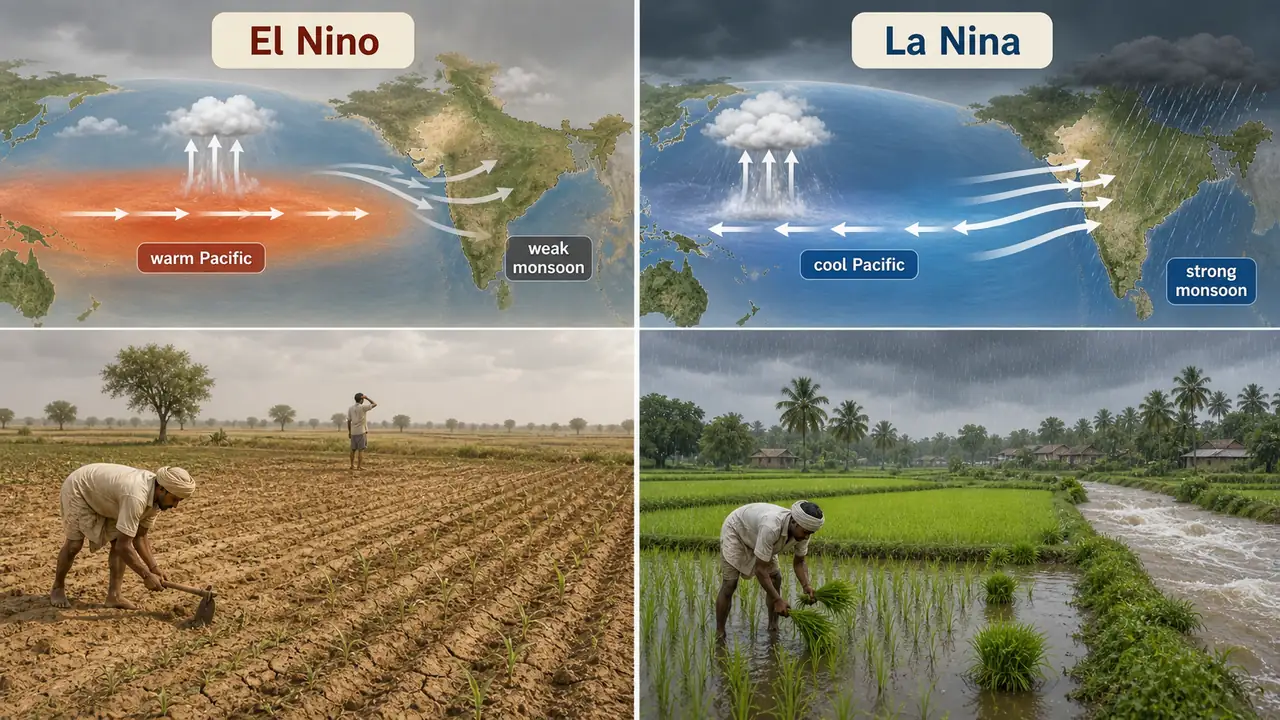
El Niño and La Niña
The strength of the Indian monsoon is strongly influenced by sea surface temperatures in the Eastern Pacific Ocean. Two opposite phenomena — El Niño and La Niña — can make or break a monsoon season.
| Feature | El Niño | La Niña |
|---|---|---|
| Pacific Ocean change | Warming of Eastern Pacific | Cooling of Eastern Pacific |
| Effect on Indian monsoon | Weakens monsoon | Strengthens monsoon |
| Rainfall impact | Below-normal rainfall | Above-normal rainfall |
| Agricultural risk | Drought risk — reduced kharif yields, delayed sowing | Flood risk — waterlogging, crop submergence |
| Frequency | Every 2–7 years | Often follows an El Niño event |
How it works: During El Niño, the warm waters shift eastward toward South America, reducing the temperature gradient that drives the monsoon winds toward India. During La Niña, the opposite happens — cooler Eastern Pacific waters strengthen the pressure gradient, pulling stronger monsoon winds toward the Indian subcontinent.
IMPORTANT
Exam memory aid: El Niño = Warming = Weak monsoon = Drought. La Niña = Cooling = Strong monsoon = Floods. El Niño years are associated with major drought events in India (e.g., 2002, 2009, 2015).
Winter Rainfall (September–November)
- Restricted mainly to northern India.
- Received as snow on hills and rain in the plains of Punjab, Rajasthan, and Central India.
- Western disturbance is the dominant factor for this rainfall.
Summer Rainfall (March–May)
- Received as local storms from March to May.
- Includes pre-monsoon showers beneficial for land preparation.
Agricultural impact: "Mango showers" in Kerala help mango flowering; "Nor'westers" in Bengal benefit pre-kharif crops.
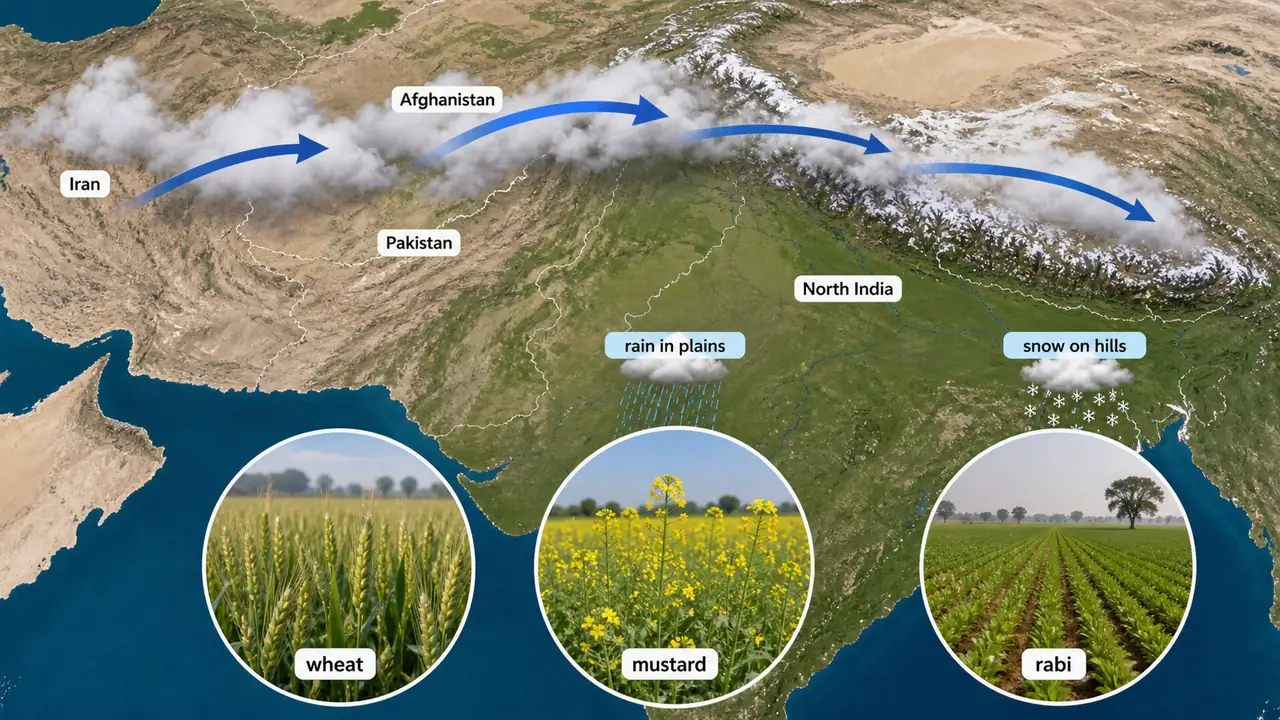
Western Disturbances (October–March)
Western disturbances are weather systems that bring winter and early spring rain to north-western India.
| Feature | Detail |
|---|---|
| Origin | Enters India through Iran, Afghanistan, and Pakistan |
| Direction | Moves eastward across northern India and Assam |
| Local name | Mhawat |
| Agricultural benefit | Critical for rabi crops (wheat, mustard, gram) |
NOTE
Cyclonic rainfall occurs in coastal areas during the pre-monsoon period (April–June) and the post-monsoon period (October–December), often causing damage to standing crops.
Types of Precipitation
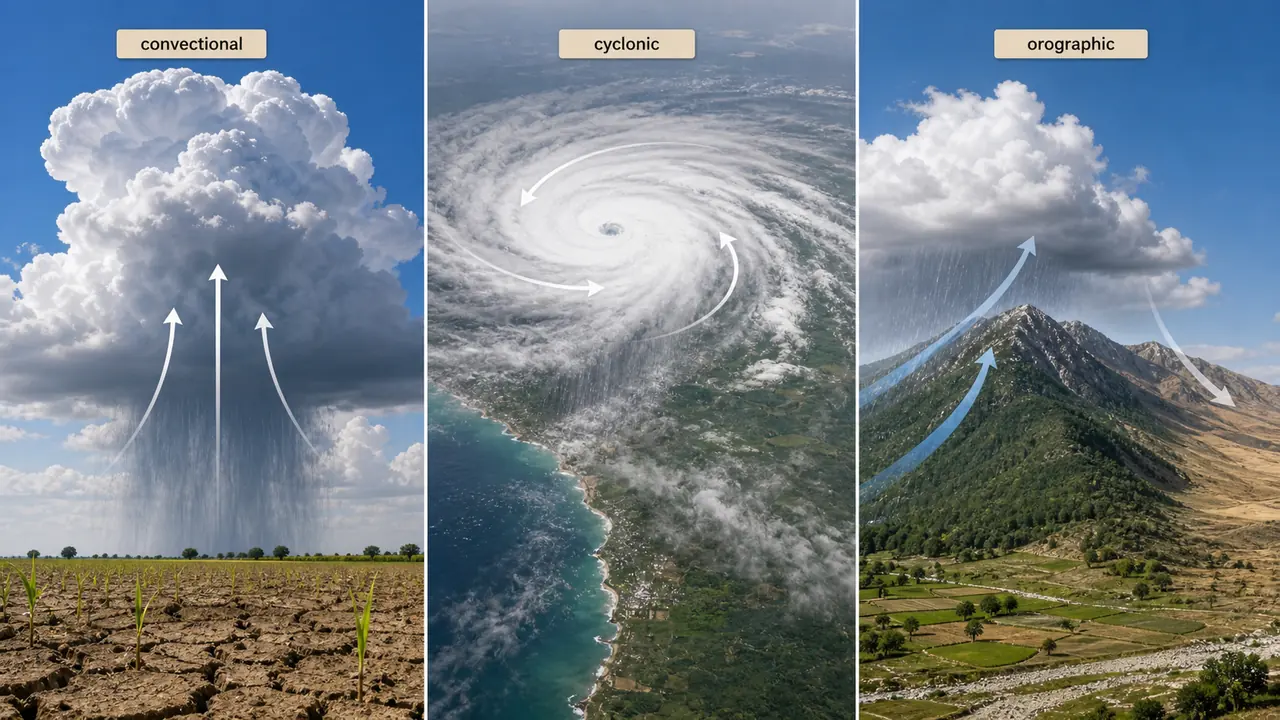
Precipitation occurs when atmospheric moisture condenses and falls to the earth. There are three main types, each caused by different mechanisms:
| Type | Mechanism | Where It Occurs | Agricultural Example |
|---|---|---|---|
| Cyclonic / Frontal | Lifting of air mass due to pressure difference; contact of warm and cold air masses | Coastal areas, plains | Cyclonic rains during October in Odisha affecting paddy harvest |
| Orographic / Relief | Moist air strikes mountains, rises, cools, and precipitates | Mountain regions | Western Ghats receive heavy rain (windward); Deccan Plateau is dry (leeward) |
| Convective | Upward movement of locally heated air; warmer than surroundings | Tropics on hot days | Afternoon thundershowers during summer in interior Karnataka |
Cyclonic vs Anticyclonic Systems
| Feature | Cyclone | Anticyclone |
|---|---|---|
| Pressure | Low in the center | High in the center |
| Circulation (NH) | Anticlockwise | Clockwise |
| Weather | Cloudy, rainy, stormy | Clear, dry, calm |
| Agricultural impact | Heavy rain, flooding, crop damage | Dry spells, frost risk in winter |
TIP
Mnemonic: Cyclone = Counter-clockwise (in Northern Hemisphere) = Cloudy weather.
Orographic Rainfall — The Rain Shadow Effect
- The windward side of mountains receives heavy rainfall (e.g., Malabar Coast: >3000 mm).
- The leeward side receives very little precipitation — this is the rain shadow effect (e.g., Deccan Plateau: 500–700 mm).
Agricultural example: Cherrapunji (windward side of Khasi Hills) receives >11,000 mm rainfall, while Shillong (leeward) receives only ~2,000 mm.
Forms of Precipitation
The types above describe why precipitation occurs (the lifting mechanism). The forms below describe what actually falls from the clouds — and each form has different consequences for agriculture.
| Form | Description | Size/Feature | Agricultural Impact |
|---|---|---|---|
| Rain | Liquid water drops | Diameter > 0.5 mm | Primary water source for crops |
| Drizzle | Fine, uniform drops | 0.2–0.5 mm; seems to float | Light moisture; beneficial for seedlings |
| Mist | Drizzle that evaporates before reaching ground | Does not reach surface | No direct benefit; reduces visibility |
| Hail | Large frozen raindrops from thunderstorms | Ice pellets, variable size | Severe crop damage — destroys fruits, vegetables, standing cereals |
| Snow | White, opaque ice grains | Branched hexagonal crystals | Moisture source for rabi in hills; insulates soil |
| Sleet | Frozen raindrops that bounce on impact | ≤ 5 mm diameter | Damages tender crops; ices over branches |
WARNING
Hailstorms are among the most destructive weather events for agriculture. They occur before the onset and after the withdrawal of monsoon and can destroy entire orchards and vegetable fields in minutes.
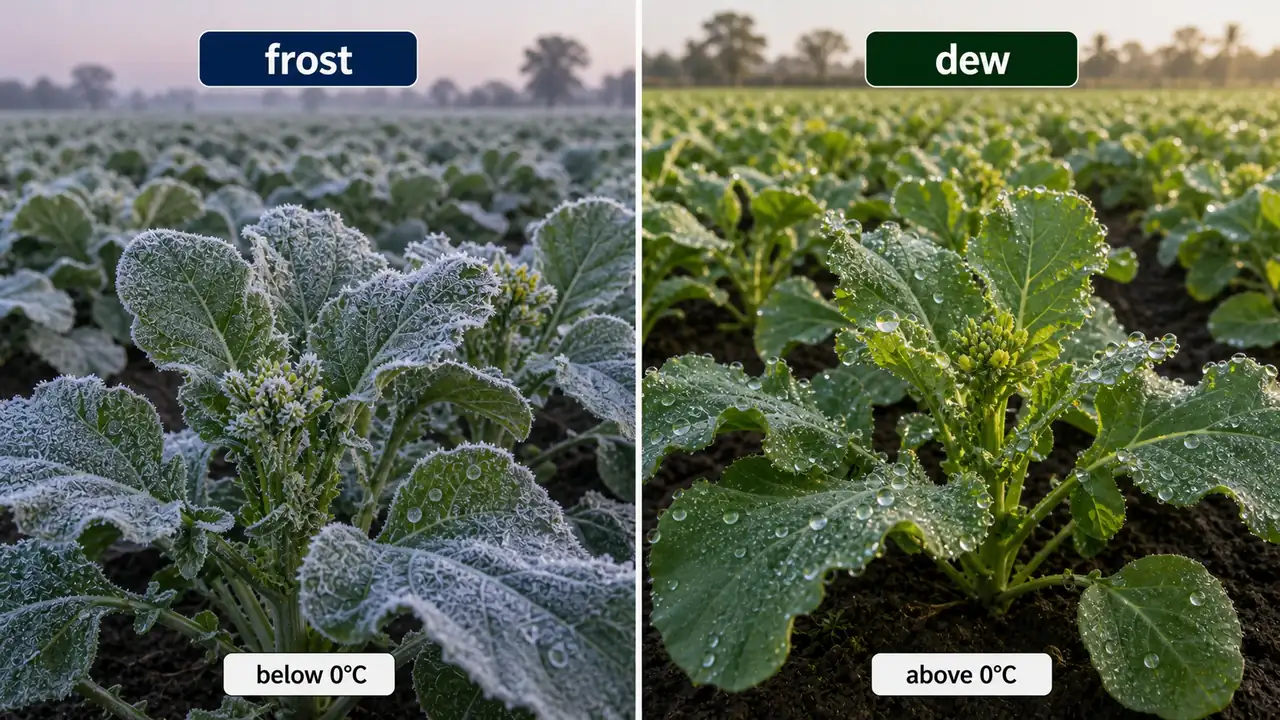
Frost vs Dew — A Critical Distinction
Both frost and dew form when atmospheric moisture condenses on surfaces, but the key difference is the temperature relative to freezing point.
| Feature | Frost | Dew |
|---|---|---|
| Process | Sublimation (vapour → ice directly) | Condensation (vapour → liquid) |
| Temperature | Forms when temperature is below freezing point (0°C) | Forms when temperature is above freezing point |
| Appearance | Feathery or thin deposit of ice | Small liquid water drops on surfaces |
| Agricultural impact | Damages crops — kills tender tissues of potato, tomato, peas | Beneficial to dryland winter crops — provides moisture |
| Soil type most affected | Sandy soils (poor heat retention) | All soils |
TIP
Exam memory aid: Frost = Freezing (below 0°C, ice). Dew = Drops (above 0°C, liquid). Frost damages; dew benefits dryland crops.
Rainfall Measurement and Classification
Knowing how much rain falls is as important as knowing when it falls. IMD uses specific thresholds to categorise rainy days, and these definitions are frequently tested in exams.
Rainy Day Definitions
| Category | Threshold | Agricultural Use |
|---|---|---|
| Meteorological rainy day | Rainfall ≥ 2.5 mm in a day | Used by IMD for rainfall statistics |
| Crop rainy day | Rainfall > 5 mm in a day | Minimum useful rainfall for crop growth |
| Effective rainfall | 5 mm in a day | Amount actually available for crop use |
IMPORTANT
Exam trap: Meteorological rainy day = 2.5 mm. Crop rainy day = 5 mm. These are different thresholds — do not confuse them.
Isolated vs Scattered Rain
IMD uses specific terms to describe the spatial extent of rainfall over a forecast area:
| Term | Definition |
|---|---|
| Isolated rain | 1/3 of the area receives rain |
| Scattered rain | 2/3 of the area receives rain |
Agricultural relevance: When IMD forecasts "isolated rain," most of the district remains dry — farmers should not rely on it for sowing. "Scattered rain" is more dependable for rainfed operations.
Mean Rainfall
- Amount collected by a rain gauge in 24 hours = mean daily rainfall.
- For mean annual rainfall in India, the mean of 35 years is used.
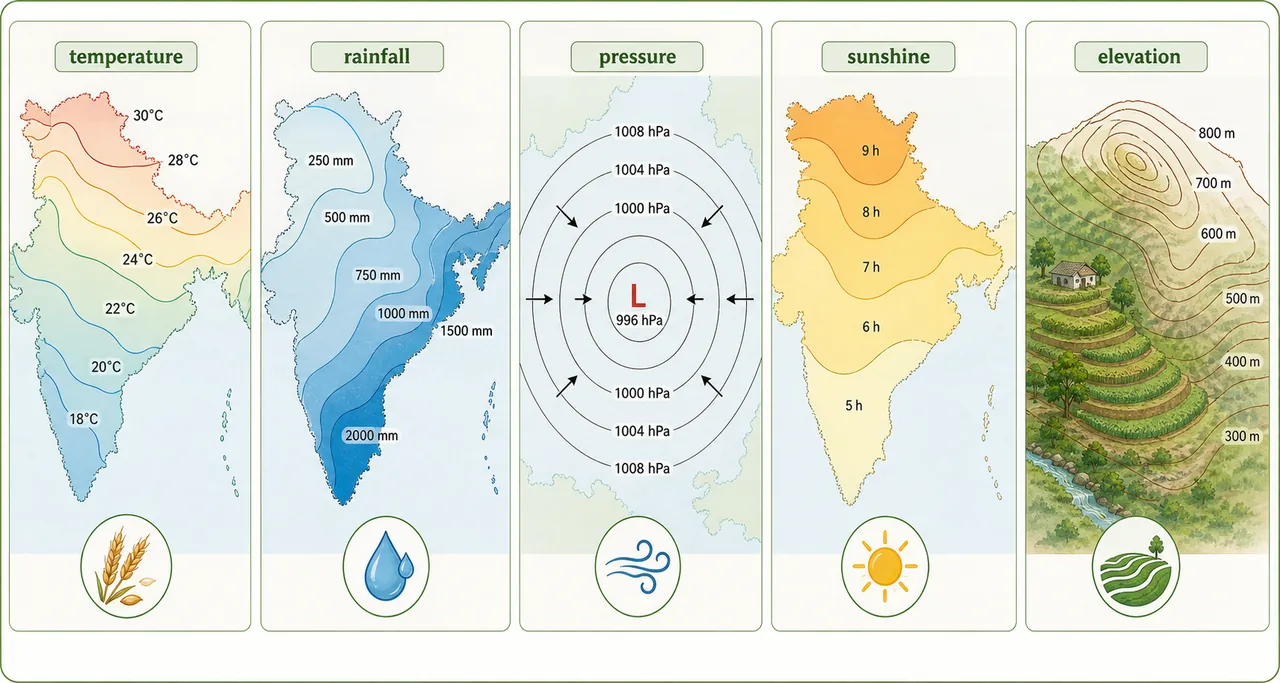
Isohyets
Isohyets are lines connecting locations with equal amounts of precipitation. They are used to create rainfall maps that guide crop planning at regional and national levels.
Precipitation and Crop Associations
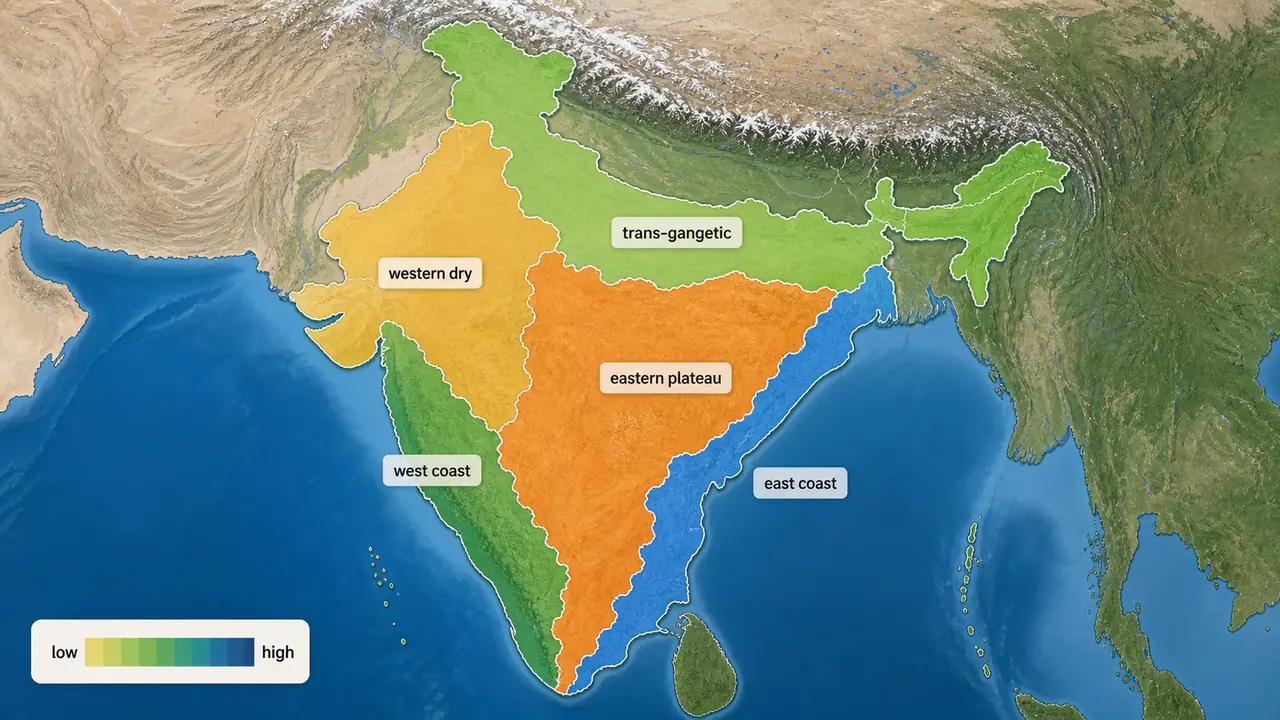
The pattern of rainfall — both amount and distribution — determines which crops dominate a region:
| Rainfall Pattern | Crops | Regions |
|---|---|---|
| Heavy, evenly distributed rainfall | Rice (plains), Tea, Coffee, Rubber (Western Ghats) | Coastal Kerala, Assam, Bengal |
| Low, uneven rainfall | Pearl millet, Sorghum, Minor millets (dryland farming) | Western Rajasthan, Deccan Plateau, rainfed Karnataka |
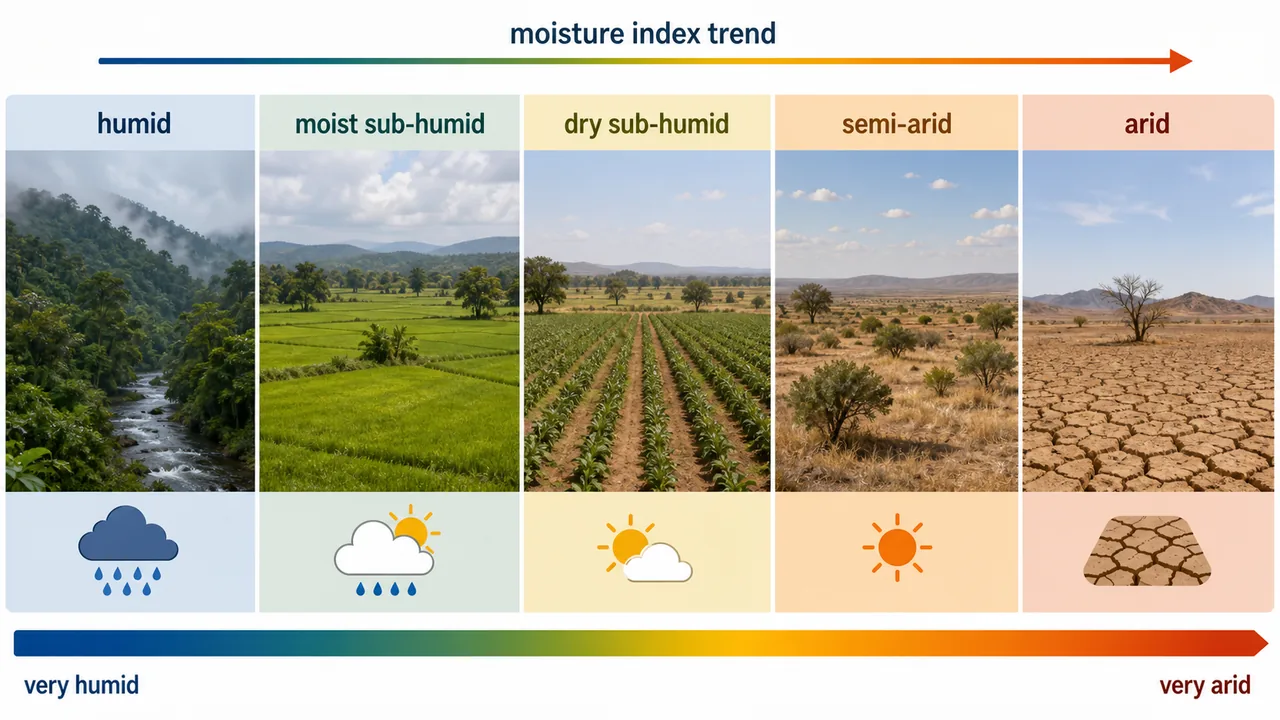
Rainfall-Based Climatic Regions
| Rainfall (mm) | Climatic Region | Typical Crops |
|---|---|---|
| < 500 | Arid | Bajra, moth bean, guar |
| 500–750 | Semi-arid | Sorghum, groundnut, sunflower |
| 750–1000 | Sub-humid | Wheat, maize, sugarcane |
| > 1000 | Humid | Rice, jute, tea, rubber |
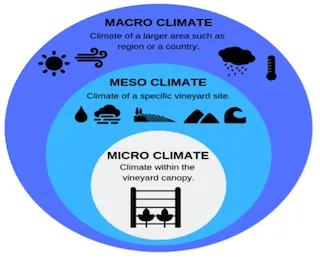
Scales of Climate
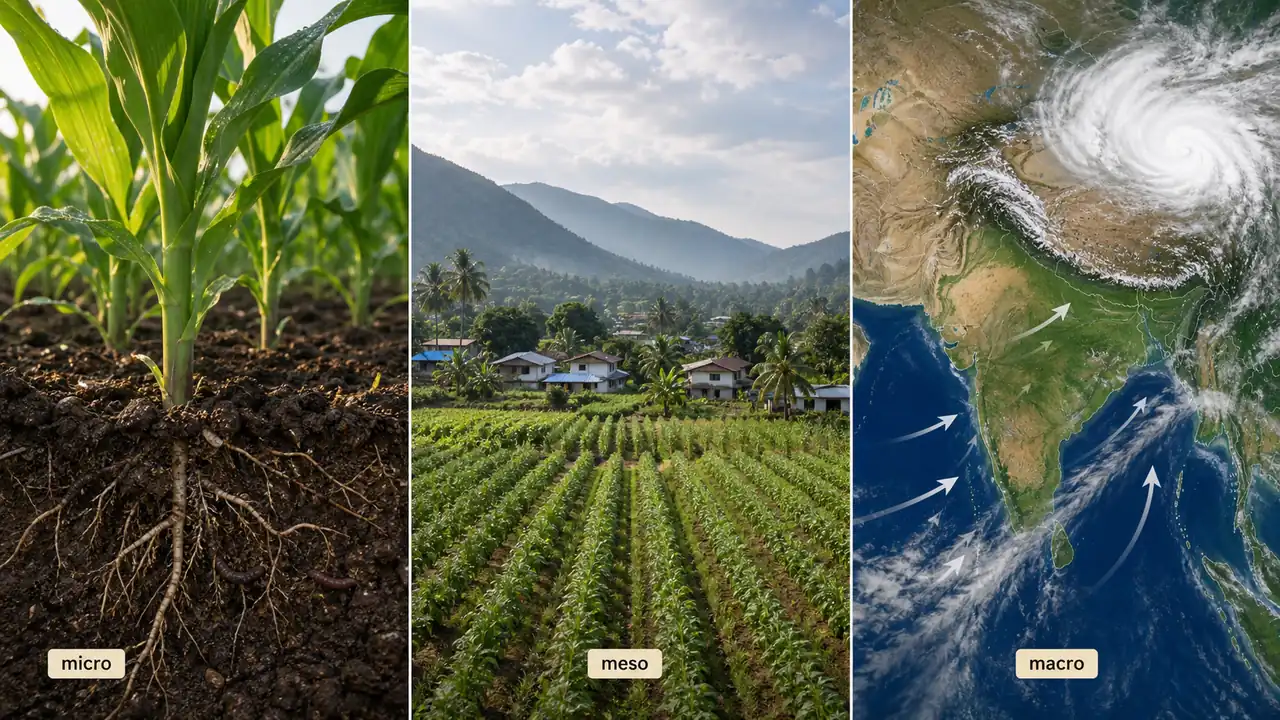
Climate can be studied at three scales, each relevant to different agricultural decisions:
| Scale | Coverage | Example |
|---|---|---|
| Microclimate | Small areas; air layer near the ground | Temperature inside a crop canopy; effect of mulching |
| Mesoclimate | 10–100 km across | Climate of a river valley or watershed |
| Macroclimate | Large areas; large-scale atmospheric motions | National agro-climatic zones of India |
Farm example: A farmer creating a microclimate by using row covers to protect strawberries from frost is applying the same principle that defines the macroclimate difference between the Western Ghats and the Deccan Plateau.
Troll's Modified Classification
| Climate | Humid Months | % of India's Area |
|---|---|---|
| Arid | < 2.0 | 17% |
| Semi-arid (dry) | 2.0–4.5 | 57.17% |
| Semi-arid (wet) | 4.5–7.0 | 12.31% |
| Humid | > 7.0 | 1.10% |
NOTE
Semi-arid (dry) covers the largest geographical area of India at 57.17%, which is why dryland farming dominates Indian agriculture.
Soil Type and Climate
Climate is not just determined by rainfall and temperature — the soil itself modifies local conditions. Soil colour affects local climate through heat absorption:
| Soil Colour | Radiation Behaviour | Climate Effect | Agricultural Implication |
|---|---|---|---|
| White/Light | Reflects radiation | Cooler areas | Lower soil temperatures; slower germination |
| Black | Absorbs more radiation | Hotter areas | Higher soil temperatures; good for cotton (black soil belt) |
| Red | Moderate absorption | Comparatively cooler | Suited for millets, groundnut |
Summary Table
| Topic | Key Fact | Exam Value |
|---|---|---|
| SW Monsoon period | June to September | Frequently asked |
| SW Monsoon contribution | 75–95% of India's annual rainfall | Percentage question |
| First state to receive SW monsoon | Kerala (onset: 1st June) | Fact question |
| Full country coverage | By 15th July | Date question |
| NE Monsoon | October–December; important for Tamil Nadu | Regional question |
| Western disturbance | Enters from Iran/Afghanistan; local name Mhawat | Definition question |
| Cyclonic precipitation | Lifting due to pressure difference | Mechanism question |
| Orographic precipitation | Air strikes mountains; rain shadow on leeward side | Concept question |
| Convective precipitation | Locally heated air rises; tropical thundershowers | Mechanism question |
| Cyclone (NH) | Low pressure center; anticlockwise circulation | Direction question |
| Rain vs Drizzle | Rain > 0.5 mm; Drizzle 0.2–0.5 mm | Size threshold |
| Snow crystals | Branched hexagonal shape | Shape question |
| Frost | Below freezing; sublimation; damages crops | Comparison question |
| Dew | Above freezing; condensation; benefits dryland crops | Comparison question |
| Meteorological rainy day | ≥ 2.5 mm | Threshold question |
| Crop rainy day | > 5 mm | Threshold question |
| Isohyet | Lines of equal rainfall | Definition question |
| El Niño | Warming of E. Pacific; weakens monsoon; drought risk | Definition + impact |
| La Niña | Cooling of E. Pacific; strengthens monsoon; flood risk | Definition + impact |
| SW Monsoon area | ~300 m-ha | Coverage question |
| NE Monsoon area | ~100 m-ha | Coverage question |
| Isolated rain | 1/3 of area receives rain | Definition question |
| Scattered rain | 2/3 of area receives rain | Definition question |
| Heavy rainfall crops | Rice, Tea, Coffee, Rubber | Crop association |
| Low rainfall crops | Pearl millet, Sorghum, Minor millets | Crop association |
| Semi-arid dry (Troll) | 57.17% of India's area | Area percentage |
Summary Cheat Sheet
| Concept / Topic | Key Details |
|---|---|
| SW Monsoon period | June to September |
| SW Monsoon contribution | 75-95% of India's annual rainfall |
| First state to receive SW monsoon | Kerala (onset: 1st June) |
| Full country coverage | By 15th July |
| NE Monsoon | October-December; important for Tamil Nadu |
| Western disturbance | Enters from Iran/Afghanistan; local name Mhawat |
| Cyclonic precipitation | Lifting due to pressure difference |
| Orographic precipitation | Air strikes mountains; rain shadow on leeward side |
| Convective precipitation | Locally heated air rises; tropical thundershowers |
| Cyclone (NH) | Low pressure center; anticlockwise circulation |
| Rain vs Drizzle | Rain > 0.5 mm; Drizzle 0.2-0.5 mm |
| Snow crystals | Branched hexagonal shape |
| Frost | Below freezing; sublimation; damages crops |
| Dew | Above freezing; condensation; benefits dryland crops |
| Meteorological rainy day | ≥ 2.5 mm |
| Crop rainy day | > 5 mm |
| Semi-arid dry (Troll) | 57.17% of India's area |
| White/light soil | Reflects radiation — cooler areas |
| El Niño | Warming of E. Pacific; weakens monsoon; drought risk |
| La Niña | Cooling of E. Pacific; strengthens monsoon; flood risk |
| SW Monsoon area | ~300 m-ha |
| NE Monsoon area | ~100 m-ha |
| Isolated rain | 1/3 of area receives rain |
| Scattered rain | 2/3 of area receives rain |
| Heavy rainfall crops | Rice, Tea, Coffee, Rubber |
| Low rainfall crops | Pearl millet, Sorghum, Minor millets |
| Black soil | Absorbs more radiation — hotter areas; good for cotton |
TIP
Next: Lesson 04 dives deeper into solar radiation and temperature — the solar constant, albedo, PAR, photoperiodism, cardinal temperatures, and heat/cold injuries to crops.
Lesson Doubts
Ask questions, get expert answers