☀️ Solar Radiation & Temperature: Energy for Crop Growth
Heat transfer, solar constant, albedo, light spectrum, PAR, light compensation and saturation points, cardinal temperatures, heat and cold injuries — with agricultural examples and exam tips
Why Solar Radiation Matters to Farmers
In the previous lesson, we covered monsoon systems and precipitation — the SW and NE monsoons, types of rainfall, and how moisture reaches crops. Now we examine the other side of the energy equation: solar radiation and temperature, which together determine how efficiently crops use that moisture.
A sugarcane farmer in Maharashtra knows that his crop needs intense sunlight to convert solar energy into sugar. A betel vine grower in West Bengal deliberately provides shade because his crop wilts under direct sun. Every crop has specific light and temperature requirements — understanding solar radiation is the starting point for matching crops to environments.
This lesson covers:
- Heat transfer — conduction, convection, radiation, and latent heat
- Solar constant and albedo — how much energy arrives and how much is reflected
- Earth's energy budget — the 100% incoming radiation balance
- Light spectrum and PAR — which wavelengths drive photosynthesis
- Photoperiodism — short-day, long-day, and day-neutral crops
- Temperature and crop growth — cardinal temperatures, heat injuries, and cold injuries
- Oasis effect — local cooling from vegetation
All topics are high-yield for IBPS AFO, NABARD Grade A, and FCI exams.
Transfer of Heat
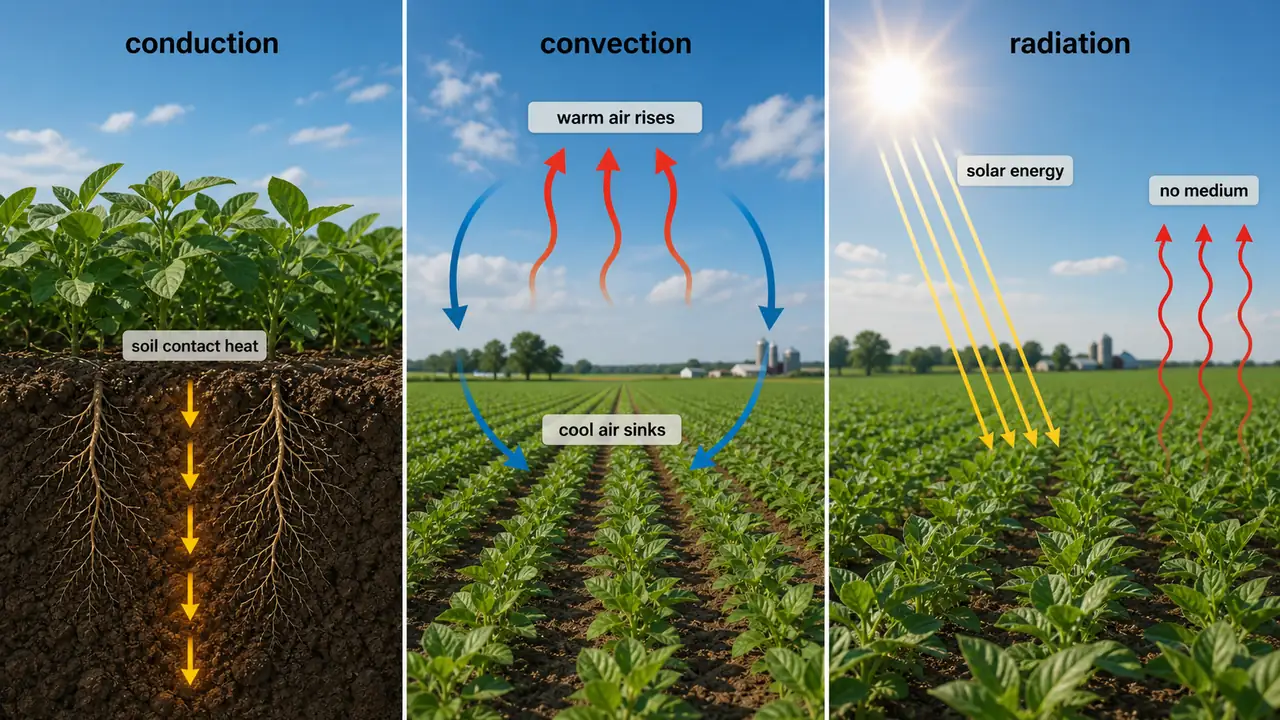
All matter above absolute zero emits energy. Three processes transfer heat:
| Process | Mechanism | Example | Agricultural Relevance |
|---|---|---|---|
| Conduction | Heat flows through matter without movement of the substance | Heat passing through an iron rod | Soil heat transfer — surface warming reaches roots by conduction |
| Convection | Heat transfer through actual movement of molecules | Boiling water in a beaker | Predominant form of energy transfer on earth; drives all weather processes affecting crops |
| Radiation | Energy transfer without any material medium | Sun's energy reaching earth through space | Solar radiation reaching crop canopies; basis of photosynthesis |
TIP
Exam mnemonic — "CCR": Conduction = Contact, Convection = Circulation (movement), Radiation = Remote (no medium needed). Convection is the most important for weather.
Latent Heat
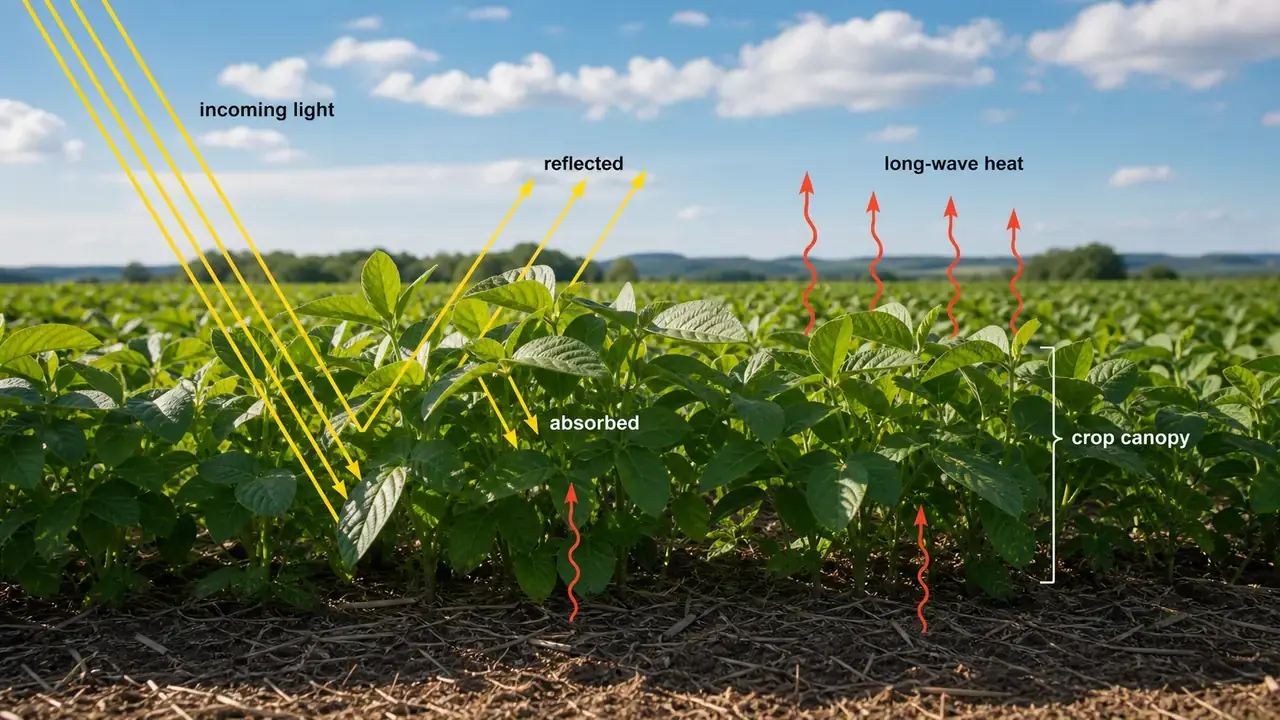
When solar radiation hits a surface, it is partly absorbed, partly reflected, and partly transmitted.
Latent heat is the energy required to change a substance to a higher state of matter (solid → liquid → gas). The same energy is released in the reverse process.
Agricultural example: When water evaporates from a rice paddy field, it absorbs latent heat from the surroundings, cooling the field. When this moisture condenses into clouds, latent heat is released — this is why the wet adiabatic lapse rate (6°C/km) is lower than the dry rate (10°C/km).
Solar Constant
Solar constant is the energy received on a unit area at the outermost boundary of the earth's atmosphere, held perpendicular to the sun's direction, at the mean distance between the sun and the earth.
IMPORTANT
Solar constant = 1.94 cal/cm²/min (also called 1 Langley per minute)
Agricultural significance: The solar constant sets the upper limit of energy available for photosynthesis. Only about 1% of incoming light energy is converted into biochemical energy by crops, and the most efficient crop (sugarcane) uses only 10–12% of total solar energy.
Albedo
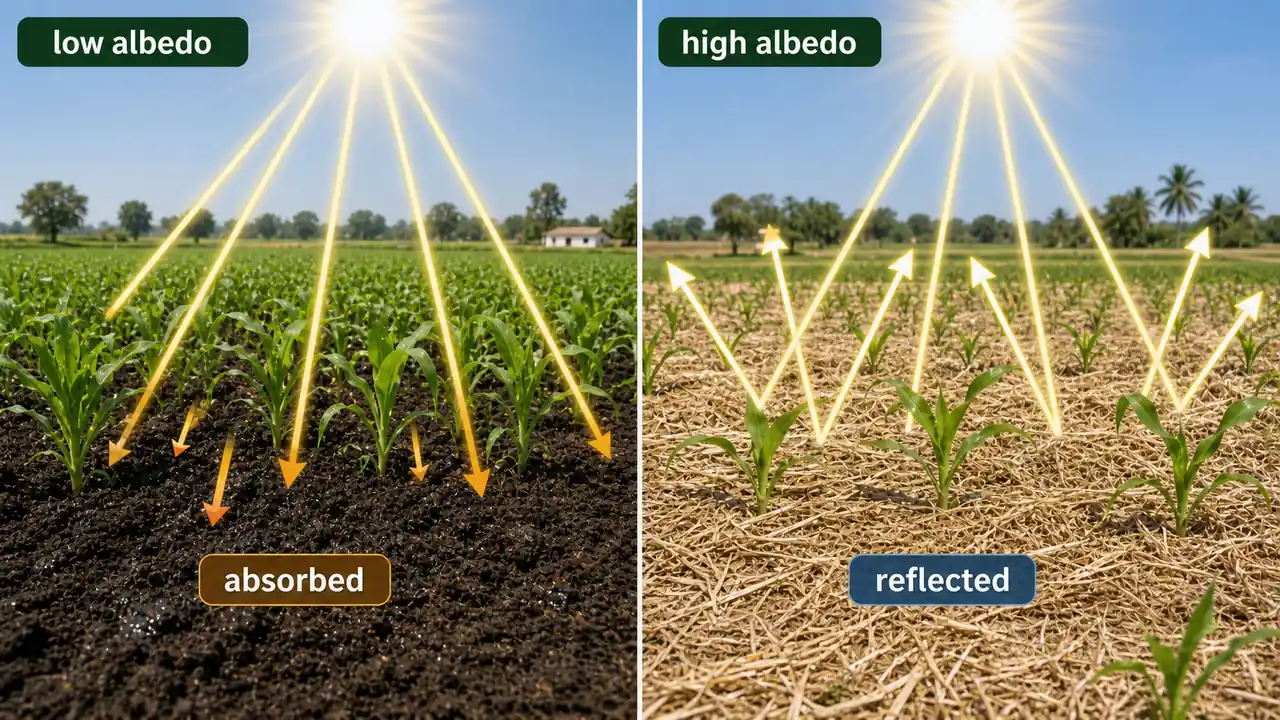
Albedo is the percentage of reflected radiation to the incident radiation. A high albedo means more reflection and less absorption.
Albedo Values of Different Surfaces
| Surface | Albedo (%) | Surface | Albedo (%) |
|---|---|---|---|
| Ice | 90 (highest) | Wheat | 23–25 |
| Indian soil | 35 | Rice | 12 |
| Average of earth | 30 | Potato | 19 |
| Meadows | 10–20 | Pearl Millet (Bajra) | 24 |
| Ploughed soil | 14–17 | Moong | 26 |
| Black dry soil | 14 | Crop plants (general) | 15–25 |
| Black moist soil | 08 (lowest) | Lucerne | 23–32 |
| Grey dry soil | 25–30 | Grey moist soil | 10–12 |
TIP
Exam fact: Ice = highest albedo (90%). Black moist soil = lowest (8%). Earth's average = 30%. Most soils have albedo of 0.10 to 0.15.
Agricultural significance: A freshly ploughed dark field (low albedo) absorbs more heat and warms up faster, promoting early germination. Mulching with light-coloured straw (higher albedo) keeps soil cooler — useful in summer vegetable cultivation.
Earth's Energy Budget
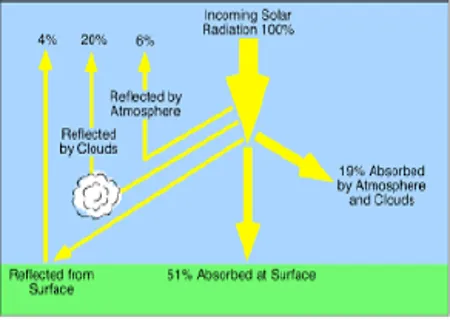
Not all solar energy reaching Earth is available to crops. The atmosphere, clouds, and surface all interact with incoming radiation. Of the total incoming solar energy (100%):
Incoming Radiation
| Component | Percentage |
|---|---|
| Absorbed by land and oceans | 51% |
| Reflected by clouds | 20% |
| Absorbed by atmosphere | 16% |
| Reflected by atmosphere | 6% |
| Reflected from earth's surface | 4% |
| Absorbed by clouds | 3% |
| Total reflected back to space | 30% |
Outgoing Radiation
| Component | Percentage |
|---|---|
| Radiated to space from clouds and atmosphere | 64% |
| Radiated directly to space from earth | 6% |
| Radiation absorbed by atmosphere | 15% |
| Carried to clouds by latent heat in water vapour | 23% |
| Conduction and rising air | 7% |
IMPORTANT
51% of incoming solar radiation is absorbed by land and oceans. 30% is reflected back to space (albedo). Only a tiny fraction of the absorbed energy is used by plants for photosynthesis.
Agricultural insight: Incoming radiation from the sun is short-wave radiation (visible). Outgoing radiation from the earth's surface is long-wave radiation (infrared, not visible). Greenhouse gases trap this outgoing long-wave radiation, causing global warming.
Light — The Visible Spectrum
Light is the visible portion of the solar spectrum with wavelength range from 0.39 to 0.76 micron (390–760 nm).
Light lies between UV and IR radiation. Three properties of light matter for crops: intensity, quality (wavelength), and duration (photoperiod).
Effects of Light on Plants
| Effect | Detail | Agricultural Example |
|---|---|---|
| Photosynthesis | Light is indispensable for photosynthesis | All crop production depends on it |
| Plant structure | Affects tillers, culm strength, leaf size, root development | Rice tillering increases with adequate light |
| Poor light effects | Causes plant abnormalities, weak stems, elongated internodes | Lodging in shaded rice crops |
Plants Classified by Light Response
| Type | Description | Examples |
|---|---|---|
| Sciophytes (shade-loving) | Grow better under partial shade | Betel vine, buckwheat, ginger, turmeric |
| Heliophytes (sun-loving) | Produce maximum dry matter under high light with adequate moisture | Maize, sorghum, rice, sugarcane, cotton |
Spectrum of Radiation
Solar radiation spans a wide range of wavelengths, from cosmic rays to infrared:
| Band | Spectrum | Wavelength (micron) | Effect on Agriculture |
|---|---|---|---|
| Ultra | Cosmic rays | < 0.005 | Lethal; filtered by atmosphere |
| Ultra | Gamma rays, X-rays | 0.005–0.20 | Lethal; filtered by atmosphere |
| Ultra | Ultraviolet rays | 0.20–0.39 | Kills bacteria and fungi; used in seed sterilisation |
| Visible (PAR) | Violet | 0.39–0.45 | Strong formative effect on plant tissue |
| Visible (PAR) | Blue | 0.45–0.49 | Strong chlorophyll absorption; photosynthesis |
| Visible (PAR) | Green | 0.49–0.57 | Low absorption (reflected — why plants look green) |
| Visible (PAR) | Yellow | 0.57–0.59 | Low photosynthetic effectiveness |
| Visible (PAR) | Orange | 0.59–0.62 | Moderate photosynthetic activity |
| Visible (PAR) | Red | 0.62–0.75 | Most favourable for growth; highest photosynthesis |
| Infrared | Infrared rays | > 0.75 | Thermal energy; source of heat for plants |
NOTE
Key exam facts: Red light is the most favourable for plant growth, followed by violet-blue. UV kills bacteria and fungi. Infrared provides heat but excess is detrimental.
Wavelength Effects on Plants — Detailed
| Band | Wavelength (nm) | Effect on Crops |
|---|---|---|
| 1 | > 1000 | No specific effect; absorbed radiation converts to heat |
| 2 | 720–1000 | Plant elongation; far-red (700–920 nm) affects photoperiodism, seed germination, flowering, fruit colour |
| 3 | 510–720 | Strongly absorbed by chlorophyll; maximum photosynthesis and photoperiod response |
| 4 | 510–610 | Green-yellow; low photosynthetic effectiveness |
| 5 | 400–510 | Strongest chlorophyll and yellow pigment absorption; strong formative effect on tissue |
| 6 | 315–400 | Formative effects; thickening of leaf tissue |
| 7 | 280–315 | Detrimental to most plants |
| 8 | < 280 | Lethal — UV germicidal action kills plants |
Light Intensity
- Light intensity is measured by comparing with a standard candle. The oldest unit is Lux.
- About 1% of light energy is converted into biochemical energy through photosynthesis.
Effects of Extreme Light
| Condition | Effect | Agricultural Example |
|---|---|---|
| Very low light | Reduces photosynthesis; weak growth | Shaded lower leaves in dense maize canopy |
| Very high light | Increases respiration; causes solarisation (photo-oxidation) — oxidation of cell contents | Leaf scorching in transplanted seedlings |
Critical Light Stages for Crops
| Crop | Critical Period for Light | Significance |
|---|---|---|
| Maize | Third month after sowing | Grain filling; light shortage reduces yield |
| Rice | 25 days prior to flowering | Panicle development; cloudy weather reduces grain number |
| Barley | At flowering period | Pollination and grain set |
Photosynthetically Active Radiation (PAR)
PAR ranges between 400–700 nm — the same as visible light — and is the radiation used in photosynthesis.
| Property | Detail |
|---|---|
| PAR range | 400–700 nm |
| Strongest photosynthetic bands | Red and Blue |
| Highest photosynthesis | Red light band |
| Energy conversion | Only ~1% of PAR is converted to plant biomass |
Light Compensation Point
The minimum light intensity at which the rate of respiration equals the rate of photosynthesis. Below this point, the plant consumes more energy than it produces.
| Property | Value |
|---|---|
| Directly proportional to | Temperature |
| Heliophytes (general) | 50 ft candle |
| Rice at 16°C | 600 ft candle |
| Rice at 27°C | 1400 ft candle |
| C3 vs C4 | Light compensation point: C3 > C4 |
Light Saturation Point
The maximum light intensity at which the rate of photosynthesis reaches its maximum. Beyond this, more light does not increase photosynthesis.
| Crop Type | Light Saturation (ft candle) |
|---|---|
| Heliophytes (field crops) | ~2500 |
| Sciophytes (shade species) | ~1000 |
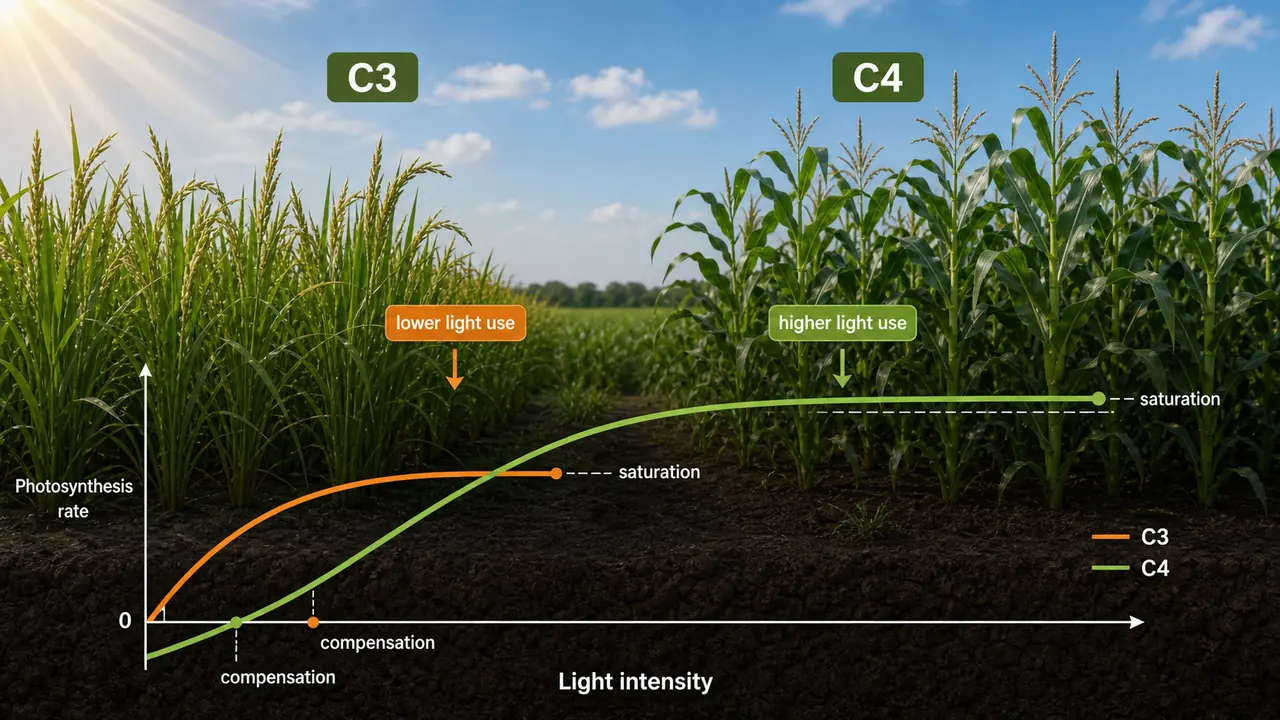
C3 vs C4 Plants — Light Response Comparison
| Property | C3 Plants | C4 Plants |
|---|---|---|
| Light compensation point | Higher | Lower |
| Light saturation | 2,500–5,000 ft candle | 8,000–10,000 ft candle |
| Photosynthetic rate | Lower | About twice that of C3 |
| Examples | Rice, wheat, barley, soybean | Maize, sorghum, sugarcane, bajra |
Light Saturation of Specific Crops
| Crop | Light Saturation (ft candle) | C3 or C4 |
|---|---|---|
| Sugarcane | 6000 | C4 |
| Rice | 5000–6000 | C3 |
| Wheat | 5300 | C3 |
| Sugar beet | 4400 | C3 |
| Potato | 3000 | C3 |
| Maize | 2500–3000 | C4 |
TIP
Sugarcane and Rice have the highest light saturation values (5000–6000 ft candle). Sugarcane utilizes up to 10–12% of total solar energy — the highest among crops.
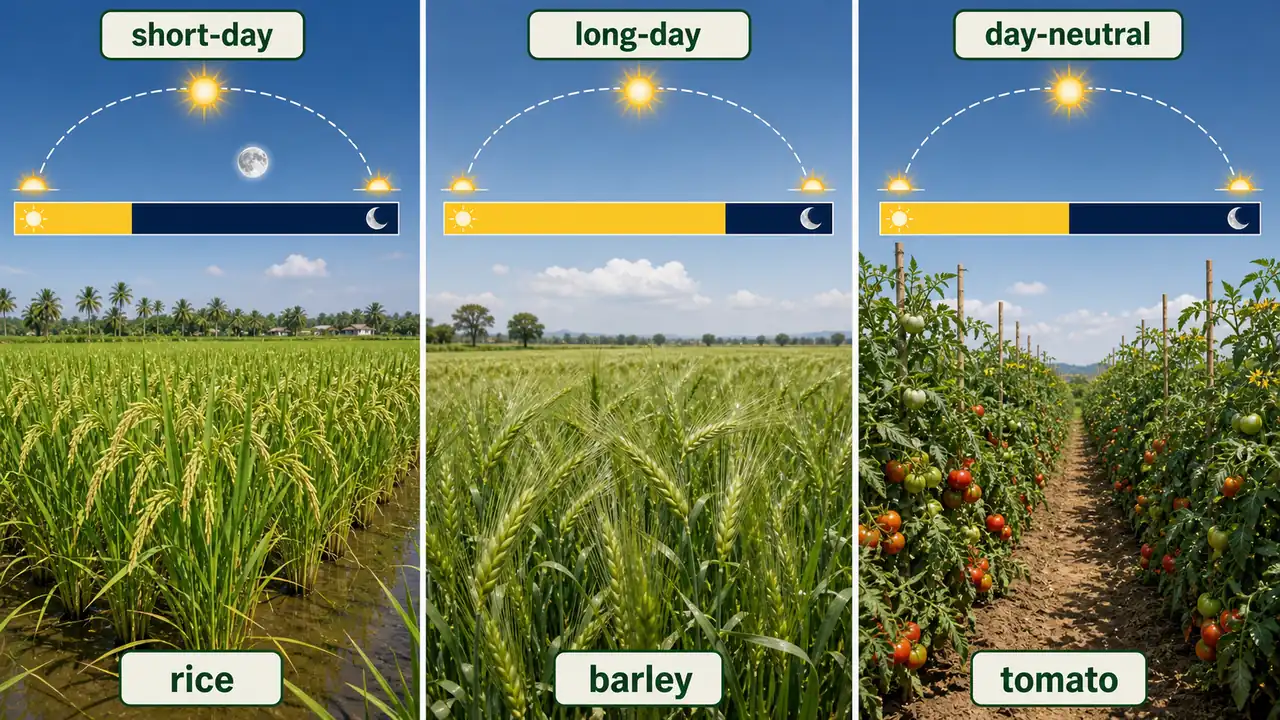
Photoperiodism
Photoperiodism is the response of plants to the relative length of day and night (photoperiod), which controls flowering.
| Category | Day Length Trigger | Examples |
|---|---|---|
| Short-day plants | Flowering when day length < 12 hours | Rice, Soybean, Tobacco, Chrysanthemum |
| Long-day plants | Flowering when day length > 12 hours | Barley, Oat, Radish, Sugarbeet, Carrot, Cabbage |
| Day-neutral plants | Flowering based on age, not day length | Tomato, Maize, Sunflower |
- Short-day plants are typically tropical crops (near the equator, shorter days during growing season).
- Long-day plants are typically temperate crops (longer summer days trigger flowering).
- Day-neutral plants flower after reaching a certain maturity — photoperiod has no effect.
TIP
Exam tip: Rice = short-day, Barley/Oat = long-day, Tomato/Maize = day-neutral. Remember: "Rice Short" (both have 'r-s' sounds). Long-day plants are mostly rabi/temperate crops.
Latitude and Climate Zones
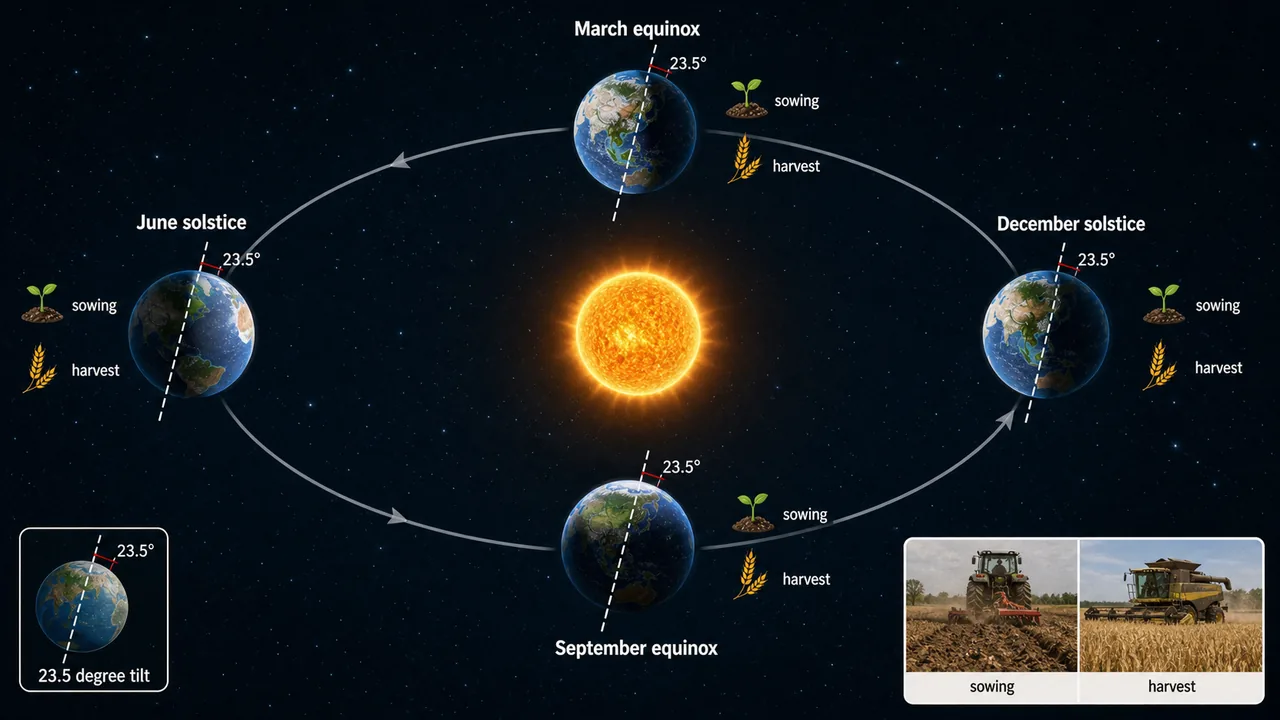
Latitude determines the angle of solar radiation, day length, and seasonal patterns — which in turn decide what crops can grow in a region.
| Zone | Latitude | Characteristics | Crop Associations |
|---|---|---|---|
| Tropical | 0–23.5° | Near-vertical sun year-round, very warm, high evaporation, frequent clouds | Rice, sugarcane, tropical fruits, spices |
| Sub-tropical | 23.5–40° | Highest summer radiation; most deserts fall in this zone | Wheat, cotton, citrus, groundnut |
| Temperate | 40–65.5° | Mild temperatures; regular precipitation; day length varies 8–16 hours | Wheat, barley, apples, potatoes |
| Polar | > 60° | Very low radiation; polar days/nights; sparse vegetation | Very limited agriculture |
NOTE
India spans tropical to sub-tropical latitudes (8°N to 37°N). This is why India can grow both tropical crops (rice, coconut) in the south and temperate crops (apple, saffron) in the high-altitude north.
Role of Temperature in Crop Production
While light quality and duration determine photosynthesis, temperature controls the rate of all biochemical reactions in plants — from enzyme activity to respiration to grain filling.
| Temperature Range | Significance |
|---|---|
| 0°C – 60°C | Range for most higher plants |
| 10°C – 40°C | Range for most crop plants |
| 15–40°C | General optimal range for crop growth |
| 20°C – 30°C | Maximum dry matter production |
Daily Temperature Patterns
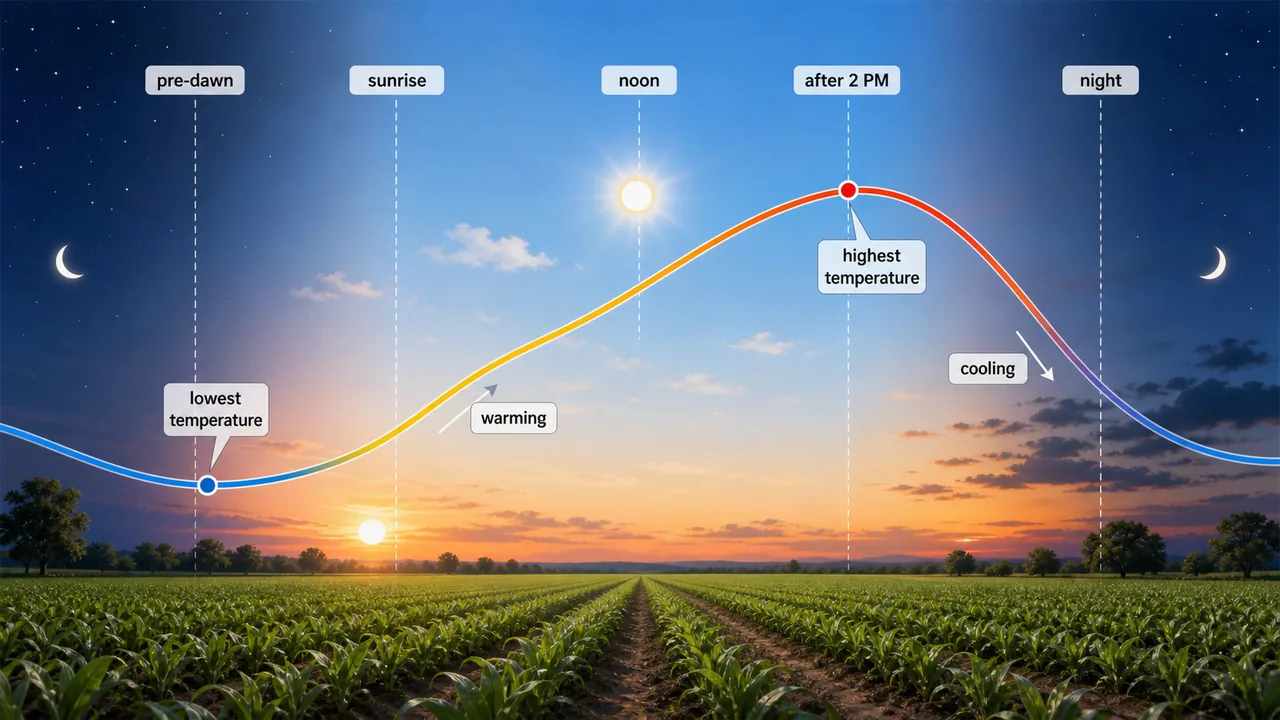
| Fact | Value |
|---|---|
| Lowest daily temperature | Just before sunrise (earth has radiated heat all night) |
| Highest daily temperature | After 2 PM (earth absorbs more heat than it radiates until early afternoon) |
| Absolute zero | -273°C (theoretical lowest temperature) |
| Sea surface temperature (normal) | 23°C |
- At high temperature + high humidity, pests and diseases increase.
- High night temperature increases respiration, reducing net dry matter accumulation.
Cardinal Temperatures
Every crop has three critical temperature thresholds called cardinal temperatures:
| Season | Crops | Minimum (°C) | Optimum (°C) | Maximum (°C) |
|---|---|---|---|---|
| Cool season | Wheat, Barley, Potato, Oats | 0–5 | 25–30 | 30–38 |
| Warm season | Rice, Sorghum, Maize, Sugarcane, Bajra, Groundnut, Red gram, Cowpea | 15–20 | 30–38 | 45–50 |
IMPORTANT
Cool season crops have lower minimum (0–5°C) and lower maximum (30–38°C). Warm season crops have higher minimum (15–20°C) and higher maximum (45–50°C). This is why wheat fails in summer and rice fails in cold winters.
Heat Injuries
When temperatures exceed a crop's maximum cardinal temperature, physical damage begins. Excessive heat causes direct injury to plant tissues through three mechanisms:
| Injury Type | Description | Agricultural Example |
|---|---|---|
| Thermal death point | Cell death at 50–60°C | Seedlings dying on hot bare soil surface |
| Sun clad | Bark injury from high day temperature + low night temperature | Bark damage on fruit tree trunks in arid regions |
| Stem girdle | Stem scorches at ground level due to hot soil | Seedling death in transplanted vegetables on exposed soil |
Cold Injuries
Just as excessive heat damages crops, temperatures below the minimum cardinal threshold cause injury. Unlike heat damage, cold injuries involve ice formation, dehydration, and oxygen deprivation. Low temperatures damage crops through four distinct mechanisms:
| Injury Type | Mechanism | Example |
|---|---|---|
| Chilling injury | Yellowing (chlorotic condition) when tropical crops are exposed to temperatures below 20°C | Chlorotic bands on sugarcane, sorghum, and maize leaves in winter |
| Freezing injury | Water freezes as ice crystals in intercellular spaces; protoplasm dehydrates and cells die | Frost damage in potato and tea in north India |
| Suffocation | Ice/snow cover prevents oxygen entry and CO₂ exit from roots | Winter crop damage in temperate hill regions |
| Heaving | Ice crystals increase soil volume, physically lifting plants from the ground | Uprooting of young wheat plants in Kashmir |
WARNING
Exam-critical thresholds: Thermal death point = 50–60°C. Chilling injury begins below 20°C night temperature in tropical crops. Frost damage is worse on sandy soils (poor heat retention). Remember: average earth surface temperature = 14–15°C.
Oasis Effect
The oasis effect is a local microclimate phenomenon where a vegetated or irrigated area is cooler than its surrounding dry environment.
This occurs because:
- Evapotranspiration (ET) from the vegetation uses latent heat, cooling the air above the crop.
- Higher albedo of green vegetation reflects more solar radiation compared to bare dry soil.
Example: An irrigated wheat field surrounded by arid desert in Rajasthan will have a noticeably cooler microclimate than the surrounding barren land — this is the oasis effect.
TIP
Exam one-liner: Oasis effect = local cooling due to ET and higher albedo of vegetation surrounded by dry area.
Summary Table
| Topic | Key Fact | Exam Value |
|---|---|---|
| Convection | Predominant form of energy transfer on earth | Definition question |
| Solar constant | 1.94 cal/cm²/min (1 Langley/min) | Numerical question |
| Albedo — highest | Ice: 90% | Comparison question |
| Albedo — lowest | Black moist soil: 8% | Comparison question |
| Earth's average albedo | 30% | Numerical question |
| Energy absorbed by land/oceans | 51% of incoming solar radiation | Percentage question |
| Light wavelength range | 0.39–0.76 micron (390–760 nm) | Range question |
| PAR range | 400–700 nm | Range question |
| Best light for growth | Red light | Colour question |
| Light compensation point | C3 > C4 | Comparison question |
| Light saturation — C4 | 8,000–10,000 ft candle | Numerical question |
| Sugarcane efficiency | Uses 10–12% of total solar energy | Percentage question |
| Critical stage — Rice | 25 days before flowering | Timing question |
| Cardinal temp — cool crops | Min 0–5°C, Max 30–38°C | Temperature range |
| Cardinal temp — warm crops | Min 15–20°C, Max 45–50°C | Temperature range |
| Maximum dry matter production | 20–30°C | Temperature range |
| Thermal death point | 50–60°C | Threshold question |
| Chilling injury threshold | Below 20°C night temperature | Threshold question |
| Frost damage — worst on | Sandy soils | Soil type question |
| Greenhouse concept by | J.B. Fourier | Scientist question |
| Photoperiodism — short-day | Rice, Soybean, Tobacco (< 12 h) | Classification question |
| Photoperiodism — long-day | Barley, Oat, Radish, Sugarbeet (> 12 h) | Classification question |
| Photoperiodism — day-neutral | Tomato, Maize (age-based) | Classification question |
| Optimal crop growth range | 15–40°C | Temperature range |
| Lowest daily temperature | Just before sunrise | Timing question |
| Highest daily temperature | After 2 PM | Timing question |
| Absolute zero | -273°C | Numerical question |
| Sea surface temperature | 23°C | Numerical question |
| Tropical zone | 0–23.5° latitude | Zone question |
| Sub-tropical zone | 23.5–40° latitude | Zone question |
| Temperate zone | 40–65.5° latitude | Zone question |
| Oasis effect | Local cooling due to ET + higher albedo | Definition question |
Summary Cheat Sheet
| Concept / Topic | Key Details |
|---|---|
| Convection | Predominant form of energy transfer on earth |
| Solar constant | 1.94 cal/cm²/min (1 Langley/min) |
| Albedo — highest | Ice: 90% |
| Albedo — lowest | Black moist soil: 8% |
| Earth's average albedo | 30% |
| Energy absorbed by land/oceans | 51% of incoming solar radiation |
| Light wavelength range | 0.39-0.76 micron (390-760 nm) |
| PAR range | 400-700 nm (= visible light) |
| Best light for growth | Red light |
| Light compensation point | C3 > C4 |
| Light saturation — C4 | 8,000-10,000 ft candle |
| Sugarcane solar efficiency | Uses 10-12% of total solar energy (highest) |
| Critical stage — Rice | 25 days before flowering |
| Cardinal temp — cool crops | Min 0-5°C, Max 30-38°C |
| Cardinal temp — warm crops | Min 15-20°C, Max 45-50°C |
| Maximum dry matter production | 20-30°C |
| Thermal death point | 50-60°C |
| Chilling injury threshold | Below 20°C night temperature in tropical crops |
| Frost damage worst on | Sandy soils (poor heat retention) |
| Average earth surface temp | 14-15°C |
| Optimal crop growth range | 15-40°C |
| Lowest daily temp | Just before sunrise |
| Highest daily temp | After 2 PM |
| Absolute zero | -273°C |
| Sea surface temp (normal) | 23°C |
| Photoperiodism — short-day | Rice, Soybean, Tobacco (< 12 h) |
| Photoperiodism — long-day | Barley, Oat, Radish, Sugarbeet (> 12 h) |
| Photoperiodism — day-neutral | Tomato, Maize (age-based) |
| Tropical zone | 0-23.5° latitude |
| Sub-tropical zone | 23.5-40° latitude |
| Temperate zone | 40-65.5° latitude |
| Oasis effect | Local cooling from ET + higher albedo of vegetation |
TIP
Next: Lesson 05 covers humidity, wind, and evapotranspiration — the three forces that govern crop water balance, pest pressure, and atmospheric moisture movement.
Lesson Doubts
Ask questions, get expert answers