💨 Humidity, Wind & Evapotranspiration: Moisture and Movement in the Atmosphere
Types of humidity, atmospheric pressure, wind systems, sea and land breezes, wind effects on crops, rainfall definitions, PET, and PAR — with agricultural examples and exam mnemonics
Why Humidity and Wind Matter for Farming
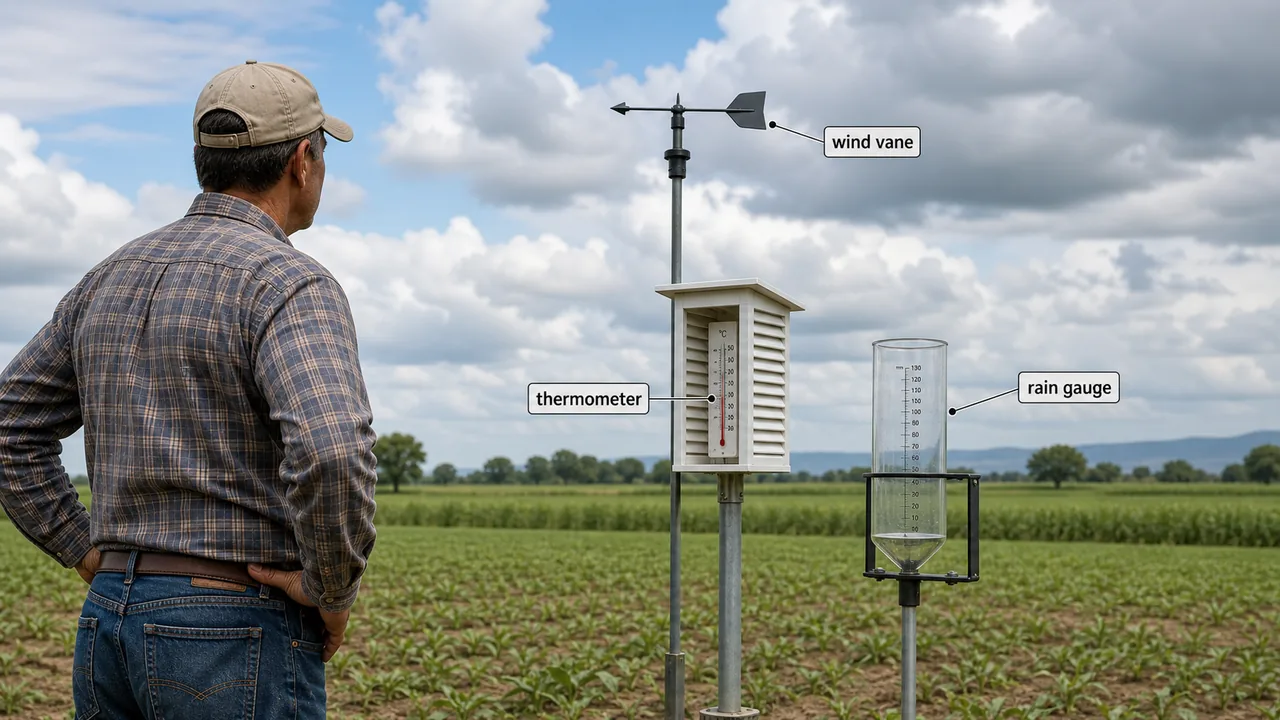
In the previous lesson, we explored solar radiation and temperature — the energy that drives photosynthesis and controls crop growth rates. Now we examine the moisture and movement side of the atmosphere: humidity, wind systems, and evapotranspiration — the forces that determine how much water crops actually lose and gain.
A cotton farmer in Gujarat watches humidity levels because high moisture triggers bollworm infestation. A rice farmer in coastal Andhra Pradesh benefits from humid sea breezes that keep transpiration low. A wheat farmer in Punjab knows that hot, dry winds (loo) in March can cause shrivelled grains. Humidity, wind, and evapotranspiration directly govern crop water use, pest pressure, and yield.
This lesson covers:
- Humidity — absolute, specific, and relative humidity with crop effects
- Atmospheric pressure — measurement and isobars
- Wind systems — prevailing winds, local breezes, and wind speed thresholds
- Rainfall definitions — meteorological vs crop rainy day thresholds
- Evapotranspiration — PET, AET, water deficit, and the moisture deficit index
- PAR — photosynthetically active radiation measurement
All topics are high-yield for IBPS AFO, NABARD Grade A, and FCI exams.
Humidity — Moisture in the Air
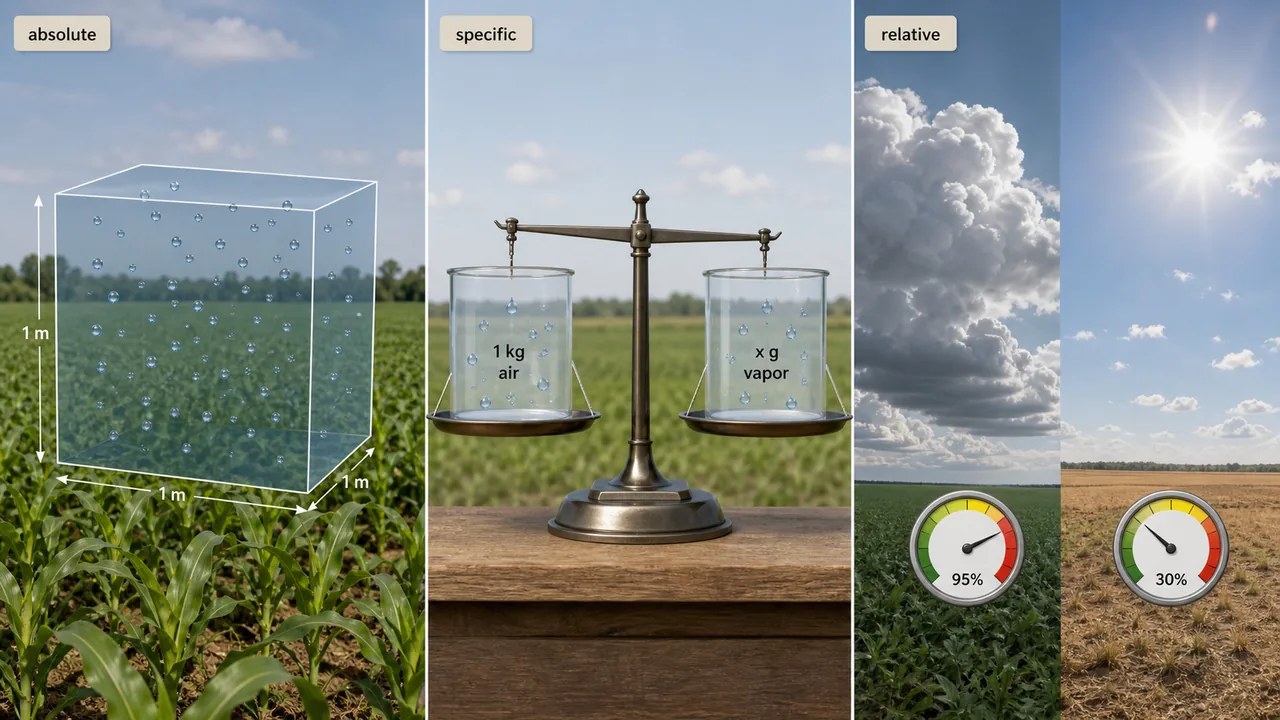
The amount of water vapour present in the atmosphere is called atmospheric moisture or humidity. There are three ways to express it:
1. Absolute Humidity
- The actual mass of water vapour in a given volume of moist air.
- Unit: grams of water vapour per cubic metre (g/m³).
- Highest at the equator; minimum at the poles.
- Daily pattern: minimum at sunrise, maximum in the afternoon (2–3 PM).
- Diurnal variations are small in desert regions.
2. Specific Humidity
- Weight of water vapour per unit weight of moist air.
- Unit: grams of water vapour per kilogram of air (g/kg).
3. Relative Humidity (RH)
- Ratio of actual water vapour to the amount needed for saturation at the same temperature and pressure.
- Expressed as a percentage (%); no units.
- When air temperature equals dew point, RH = 100%.
Comparing the Three Types of Humidity
| Type | Measured Per | Unit | Key Fact |
|---|---|---|---|
| Absolute humidity | Unit volume | g/m³ | Highest at equator; lowest at poles |
| Specific humidity | Unit weight | g/kg | Weight-based; more stable measure |
| Relative humidity | Ratio (no physical unit) | % | Changes with temperature; no fixed units |
IMPORTANT
Exam distinction: Absolute = per volume (g/m³). Specific = per weight (g/kg). Relative = ratio (%). Mean maximum RH occurs in the morning; mean minimum RH in the afternoon.
Effect of Relative Humidity on Crops
| Condition | Crops | Why |
|---|---|---|
| Very high RH is beneficial | Maize, Sorghum, Sugarcane | Reduces transpiration loss; maintains turgidity |
| Very high RH is harmful | Sunflower, Tobacco | Promotes fungal diseases; reduces oil quality |
| Pest incidence | Increases at higher RH | Humid conditions favour fungal spores and insect breeding |
- Safe RH for most crops: 40–60% — this range balances transpiration control with disease avoidance.
TIP
Mnemonic — "MSS love moisture, ST hate it": Maize, Sorghum, Sugarcane benefit from high RH. Sunflower, Tobacco are harmed by it.
Atmospheric Pressure
- Atmospheric pressure is the weight of air above a unit area.
- Pressure at sea level: 76 cm (1013.25 mb) — the standard reference.
- 1000 mb = 1.053 kg/cm².
- Air presses down with a pressure of 1.034 g/cm².
- Measured in millibars (mb); 1 mb = 100 N/m² = 1000 dynes/cm².
- Atmospheric pressure is force per unit area.
- Unequal heating by the sun and earth's rotation create pressure differences that drive winds.
- Most accurate instrument: Mercurial barometer (Fortin barometer).
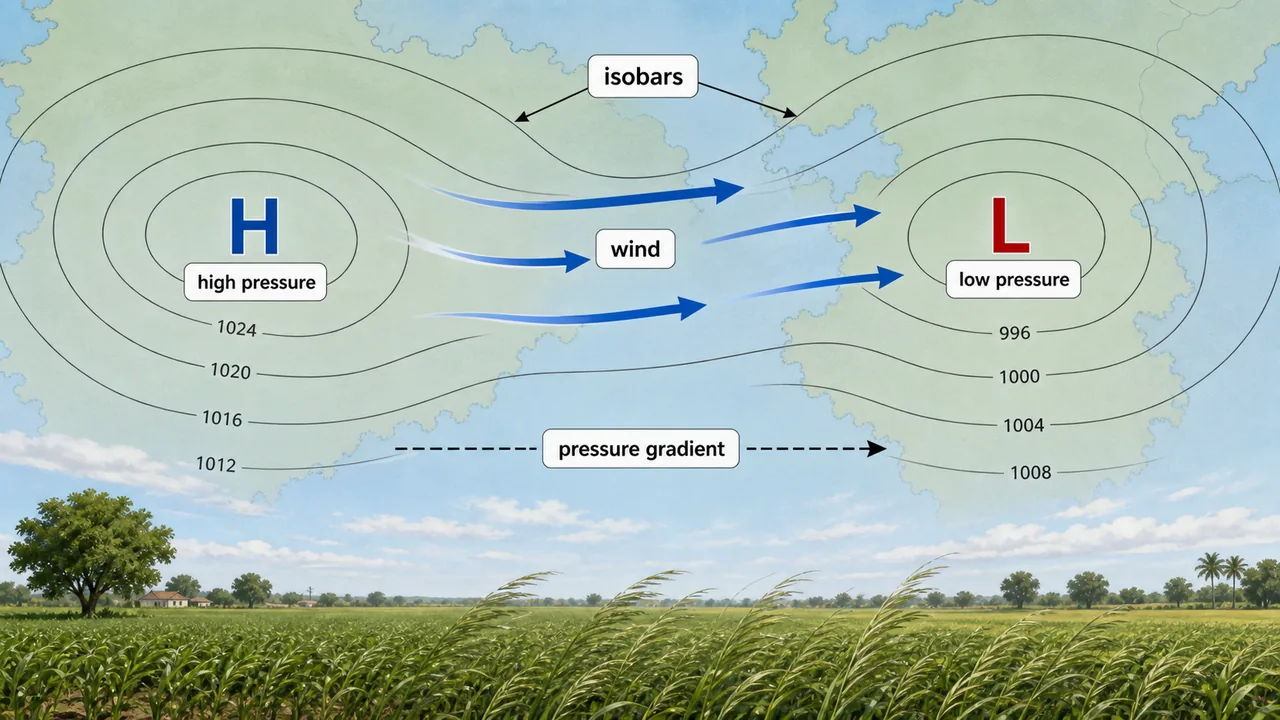
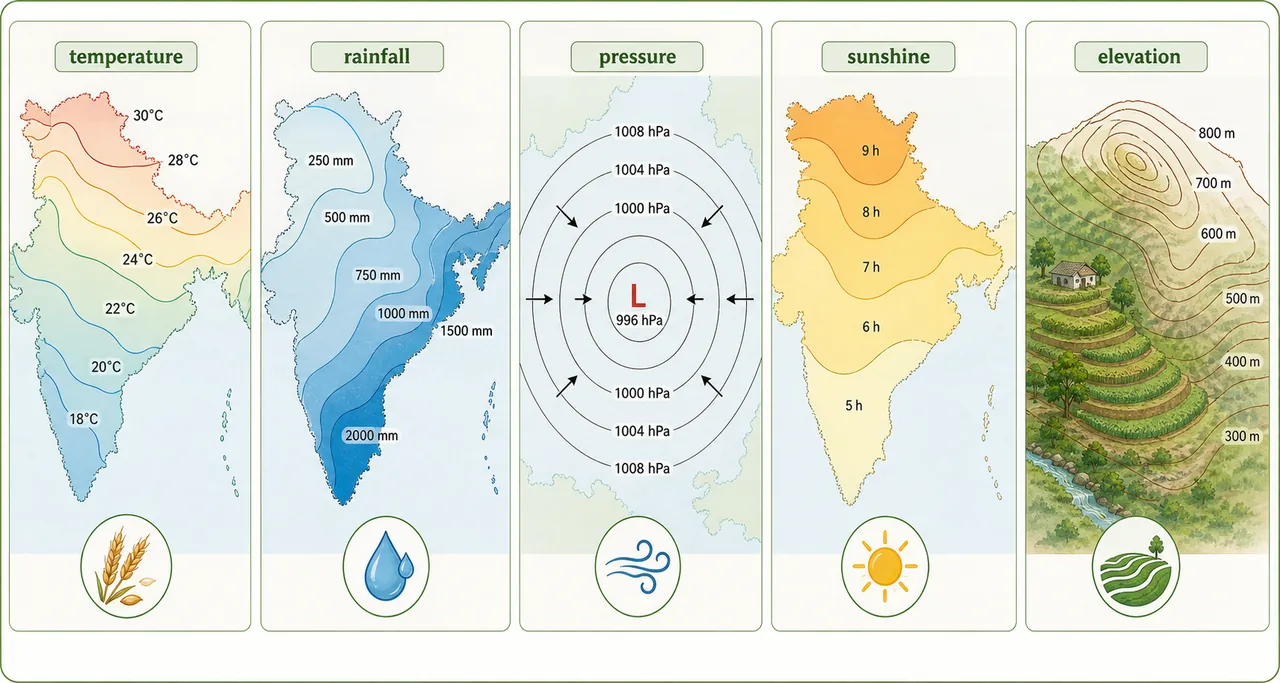
Isobars
Isobars are imaginary lines on a map joining places with the same atmospheric pressure. They help meteorologists identify high- and low-pressure systems that determine whether a farmer will get rain or dry weather.
Wind — Air in Motion
Humidity describes the moisture content of air; wind describes its movement. Wind redistributes heat, moisture, and pollen across landscapes — and at extreme speeds, it becomes destructive. Air in horizontal motion is called wind. Vertical air movement is called an air current.
| Property | Detail |
|---|---|
| Main cause | Variation in temperature creating pressure differences |
| Direction | Always from higher pressure to lower pressure |
| Optimal crop speed | 4–6 km/hr — facilitates gas exchange without causing damage |
| Monsoon winds | Blow from cold to warm regions |
- High-speed winds are called Squalls.
Wind Terminology
| Term | Meaning | Agricultural Context |
|---|---|---|
| Veering wind | Turns to the right (clockwise) | Indicates approaching warm front |
| Backing wind | Turns to the left (anticlockwise) | Indicates approaching cold front |
| Windward side | Direction from which wind blows | Receives orographic rainfall (Western Ghats) |
| Leeward side | Direction towards which wind blows | Rain shadow area (Deccan Plateau) |
NOTE
Memory aid: Veering = Veers right (clockwise). Backing = Backs left (anticlockwise).
Wind Speed Patterns in India
| Period | Speed | Notes |
|---|---|---|
| Winter months | 3–6 km/hr | Lowest wind speeds |
| Pre-monsoon (April–June) | 6–10 km/hr (peak) | Hot winds (loo) in north India |
| Strongest wind regions | West Rajasthan, Gujarat, parts of Tamil Nadu | Important for wind energy and windbreak planning |
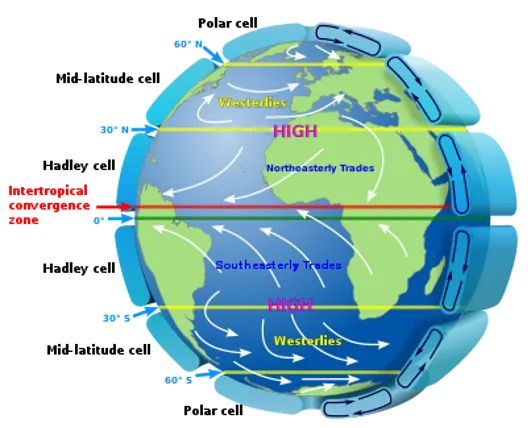
Prevailing Winds
Winds that blow predominantly from one direction over a particular area of the earth:
| Wind Type | Latitude Belt | Direction (NH) | Agricultural Significance |
|---|---|---|---|
| Trade winds (Tropical Easterlies) | 30° towards equator | From north-east | Drive the SW monsoon into India |
| Antitrade winds (Westerlies) | 30° to 60° | From south-west | Bring western disturbances to north India; stronger in southern hemisphere |
| Roaring Forties | 40°–50° S | Strongest westerlies | No direct Indian agricultural impact |
| Polar Easterlies | Poles towards sub-polar | From poles | Cold waves reaching north India |
| Periodic Winds | Reverse direction seasonally | Seasonal reversal | Primary driver of the Indian monsoon |
IMPORTANT
Exam summary: Trade winds: 30° → equator. Westerlies: 30° → 60°. Polar easterlies: poles → sub-polar. The equatorial low-pressure belt (5°N and S) is called the Doldrums.
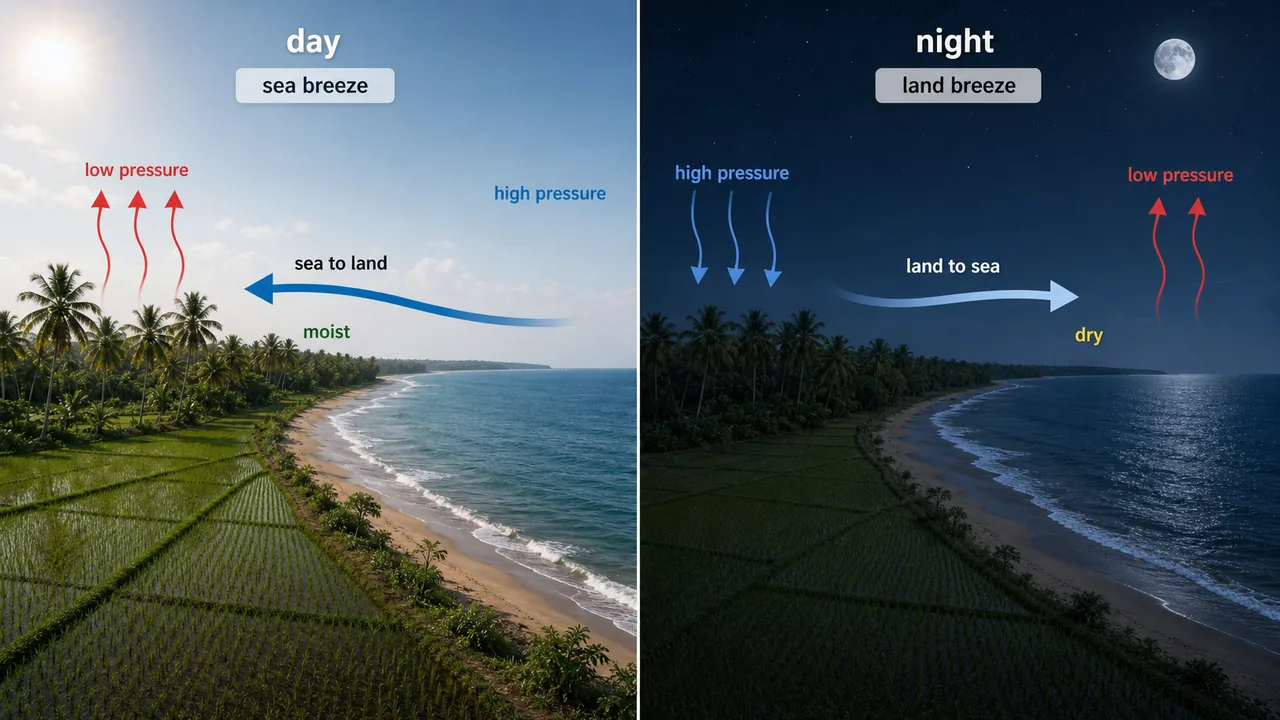
Sea Breeze vs Land Breeze
These are local wind systems near coastlines, directly affecting coastal agriculture:
Sea Breeze (On-shore): During daytime, land heats faster than sea → low pressure over land → wind flows from sea to land.
Land Breeze (Off-shore): At night, land cools faster than sea → low pressure over sea → wind flows from land to sea.
| Feature | Sea Breeze | Land Breeze |
|---|---|---|
| Time | Day time | Night time |
| Direction | Sea → Land | Land → Sea |
| Moisture content | More moisture | Less moisture |
| Strength | Stronger | Weaker |
| Agricultural effect | Moderates coastal temperatures; benefits rice, coconut | Carries farm odours seaward; minimal crop effect |
TIP
Memory aid: Sea breeze = Sun time (day). Land breeze = Late night. Sea breeze is always stronger and carries more moisture.
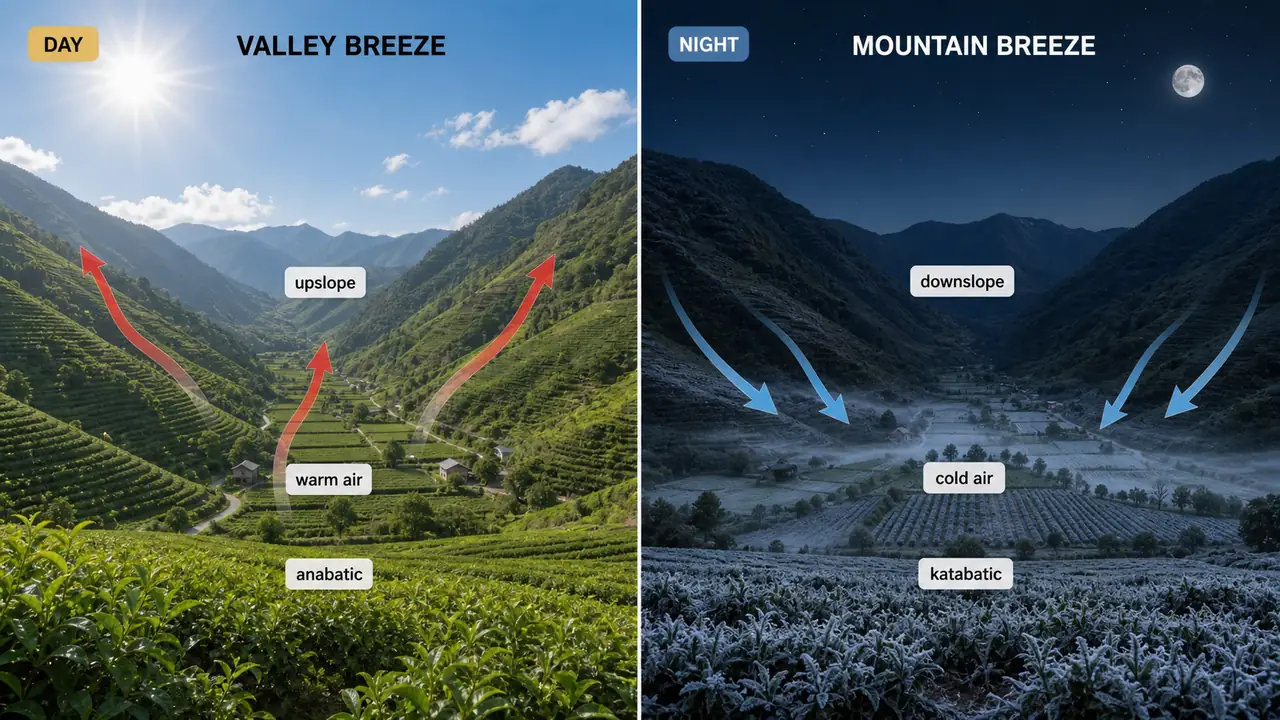
Mountain Breeze vs Valley Breeze
| Type | Description | Also Called | Agricultural Example |
|---|---|---|---|
| Mountain Breeze | Cool, dense air flows downhill into the valley | Katabatic wind | Cold air pooling causes frost in valley-floor orchards at night |
| Valley Breeze | Warm air flows uphill along heated slopes | Anabatic breeze | Carries moisture up slopes; benefits hill tea gardens during day |
Effect of Wind Speed on Crops
Wind speed thresholds are critical for agricultural operations and crop safety:
| Wind Speed | Effect | Agricultural Application |
|---|---|---|
| > 8 km/hr | Can lift sand in arid regions | Sand dune movement; need for shelter belts in Rajasthan |
| > 10 km/hr | Plant growth is inhibited | Wind stress reduces leaf area and transpiration |
| 15 km/hr | Minimum for winnowing operations | Traditional grain cleaning after harvest |
| 15 km/hr | Maximum for sprinkler irrigation | Above this, spray drift wastes water |
| > 50 km/hr | Crop lodging occurs | Rice, wheat, sugarcane flatten; yield loss 30–50% |
WARNING
Exam-favourite thresholds: 8 (sand lifting) → 10 (growth inhibition) → 15 (winnowing and sprinkler limit) → 50 (crop lodging). These numbers are very frequently tested.
Weather Phenomena by Wind Speed
| Phenomenon | Wind Speed | Key Feature |
|---|---|---|
| Storm | 40–120 km/hr | Low-pressure centre; damages standing crops |
| Hurricane | > 120 km/hr | Severe tropical cyclone (typhoon in W. Pacific, cyclone in Indian Ocean) |
| Tornado | Can exceed 400 km/hr | Violently rotating air column from cumulonimbus cloud |
Rainfall Definitions
Rainy Day Categories
| Category | Threshold | Use |
|---|---|---|
| Meteorological rainy day | Rainfall ≥ 2.5 mm per day | IMD statistics |
| Crop rainy day | Rainfall > 5 mm per day | Minimum useful rain for crop growth |
| Effective rainfall | 5 mm per day | Amount actually available to crops |
Mean Rainfall
- Daily: amount collected by rain gauge in 24 hours.
- Annual (India): mean of 35 years of data.
IMPORTANT
Meteorological rainy day = 2.5 mm. Crop rainy day = 5 mm. Do not confuse these — they are different thresholds frequently tested in exams.
Evapotranspiration (ET)
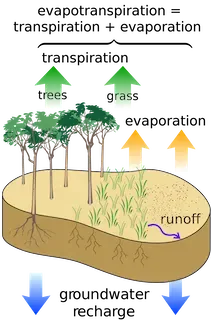
Humidity and wind together drive evapotranspiration — the combined water loss from soil surfaces and plant leaves. ET is the single most important parameter for irrigation scheduling and drought assessment. Evapotranspiration combines two processes: evaporation (liquid water escaping from soil/water surfaces) and transpiration (water moving through plants and released as vapour from stomata).
- About 10% of atmospheric moisture comes from plant transpiration; 90% from ocean and lake evaporation.
PET, AET, and Water Deficit
| Concept | Definition | Agricultural Use |
|---|---|---|
| PET (Potential ET) | Maximum water loss if moisture is unlimited | Indicates atmospheric water demand |
| AET (Actual ET) | Water actually lost, limited by available moisture | Indicates current water use by crop + soil |
| Water Deficit | PET − AET | Key indicator of drought stress and irrigation need |
| Property | Value |
|---|---|
| Annual PET in India | 1400 to 1800 mm |
| PET condition | Occurs at potential rate only when water is non-limiting |
IMPORTANT
AET ≤ PET always. When soil moisture is adequate, AET ≈ PET. As soil dries, AET drops below PET and the gap (Water Deficit = PET − AET) widens — this is a direct measure of crop drought stress.
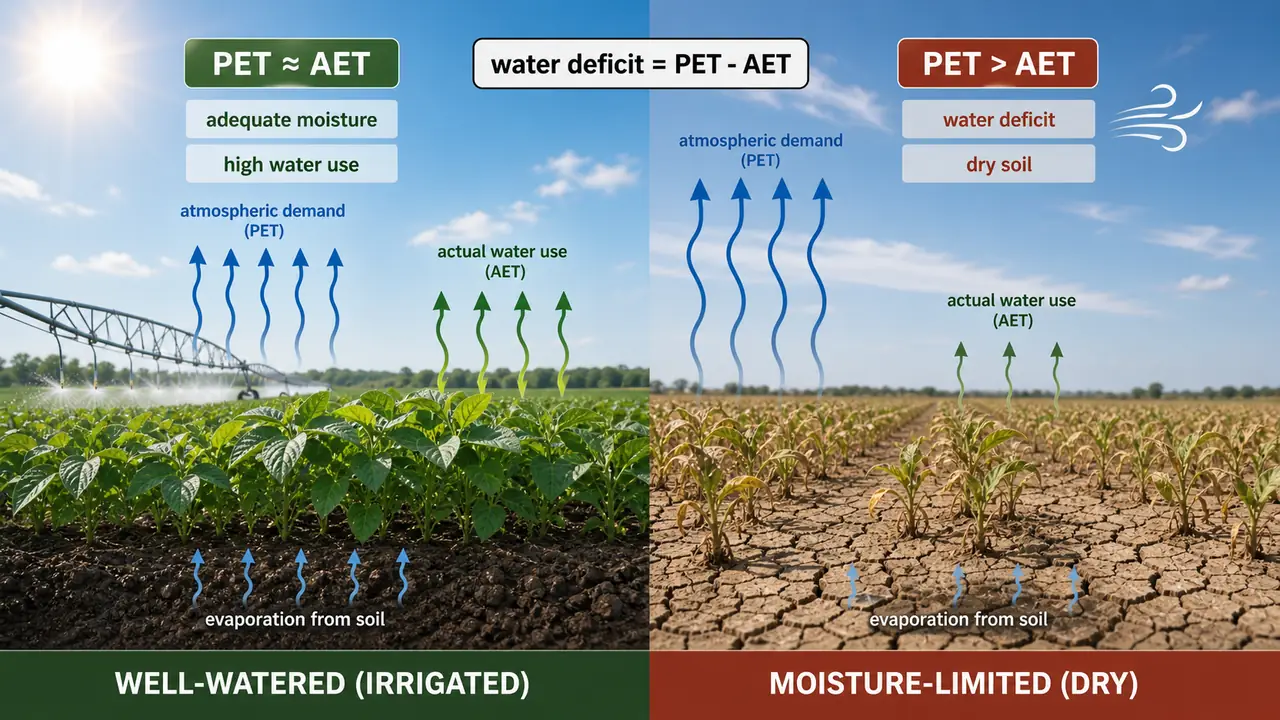
Agricultural significance: When AET falls below PET, crops experience water stress. The difference between rainfall and PET determines whether a region is arid, semi-arid, or humid — and thus what crops can be grown.
Moisture Deficit Index (MDI): MDI = 100 (P - PET) / PET
Photosynthetically Active Radiation (PAR)
PAR is the radiation that drives photosynthesis in plant leaves.
| Property | Value |
|---|---|
| Wavelength range | 400–700 nm (same as visible light) |
| Strongest bands | Red and Blue |
| Highest photosynthesis | Red light band |
| Measurement above canopy | Quantum sensor |
| Measurement below canopy | Tube solarimeter |
TIP
PAR = 400–700 nm = visible light range. Red light drives the most photosynthesis. Both Red and Blue bands are strongly photosynthetically active. Green light is mostly reflected (which is why leaves look green).
Summary Table
| Topic | Key Fact | Exam Value |
|---|---|---|
| Absolute humidity | g/m³; highest at equator; minimum at sunrise | Unit question |
| Specific humidity | g/kg (per unit weight) | Unit question |
| Relative humidity | % (no units); ratio-based | Definition question |
| RH = 100% | When air temperature = dew point | Condition question |
| High RH beneficial | Maize, Sorghum, Sugarcane | Crop matching |
| High RH harmful | Sunflower, Tobacco | Crop matching |
| RH suitable range | 40–60% for most crops | Range question |
| Atmospheric pressure at sea level | 76 cm (1013.25 mb); 1000 mb = 1.053 kg/cm² | Standard question |
| Atmospheric pressure unit | Millibar (mb) = 100 N/m² | Unit question |
| Isobar | Lines of equal atmospheric pressure | Definition question |
| Optimal crop wind speed | 4–6 km/hr | Threshold question |
| Squalls | High-speed winds | Definition question |
| Wind direction | High pressure → Low pressure | Direction question |
| Veering wind | Clockwise (right) | Direction question |
| Trade winds | 30° → Equator; NE in NH | Belt question |
| Sea breeze | Day time; sea → land; stronger | Timing question |
| Mountain breeze | Katabatic; downhill at night | Name question |
| Wind > 10 km/hr | Growth inhibited | Threshold question |
| Wind > 50 km/hr | Crop lodging | Threshold question |
| Winnowing wind speed | 15 km/hr | Threshold question |
| Meteorological rainy day | ≥ 2.5 mm | Threshold question |
| Crop rainy day | > 5 mm | Threshold question |
| Periodic Winds | Seasonal-reversing; drive Indian monsoon | Wind type question |
| Storm wind speed | 40–120 km/hr | Threshold question |
| Hurricane wind speed | > 120 km/hr | Threshold question |
| Tornado wind speed | Can exceed 400 km/hr (from cumulonimbus) | Threshold question |
| AET | Actual ET limited by available moisture | Definition question |
| Water Deficit | PET − AET (drought stress indicator) | Formula question |
| Atmospheric moisture source | 10% transpiration, 90% ocean/lake evaporation | Ratio question |
| PET in India | 1400–1800 mm annually | Range question |
| PAR range | 400–700 nm | Range question |
| Doldrums | Equatorial low pressure belt (5°N and S) | Name question |
Summary Cheat Sheet
| Concept / Topic | Key Details |
|---|---|
| Absolute humidity | g/m³; highest at equator; minimum at sunrise |
| Specific humidity | g/kg (per unit weight of air) |
| Relative humidity | % (no units); RH = 100% when air temp = dew point |
| High RH beneficial | Maize, Sorghum, Sugarcane |
| High RH harmful | Sunflower, Tobacco |
| RH suitable range | 40–60% for most crops |
| Atmospheric pressure at sea level | 76 cm (1013.25 mb); 1000 mb = 1.053 kg/cm² |
| Atmospheric pressure unit | Millibar (mb) = 100 N/m² |
| Isobar | Lines of equal atmospheric pressure |
| Optimal crop wind speed | 4–6 km/hr (gas exchange) |
| Squalls | High-speed winds |
| Wind direction | High pressure → Low pressure |
| Veering wind | Clockwise (right) |
| Trade winds | 30° → Equator; NE in Northern Hemisphere |
| Sea breeze | Daytime; sea → land; stronger |
| Mountain breeze | Katabatic; downhill at night |
| Wind > 10 km/hr | Growth inhibited |
| Wind > 50 km/hr | Crop lodging |
| Winnowing wind speed | 15 km/hr |
| Meteorological rainy day | ≥ 2.5 mm |
| Crop rainy day | > 5 mm |
| Periodic Winds | Seasonal-reversing; drive Indian monsoon |
| Storm | 40–120 km/hr |
| Hurricane | > 120 km/hr |
| Tornado | Can exceed 400 km/hr (from cumulonimbus) |
| AET | Actual ET, limited by available moisture |
| Water Deficit | PET − AET (drought stress indicator) |
| Atmospheric moisture | 10% transpiration, 90% ocean/lake evaporation |
| PET in India | 1400-1800 mm annually |
| PAR range | 400-700 nm (visible light) |
| Strongest PAR bands | Red and Blue; highest photosynthesis = Red |
| Doldrums | Equatorial low pressure belt (5°N and S) |
TIP
Next: Lesson 06 covers clouds and cloud seeding — the 10 cloud types in 4 families, cloud cover categories, and artificial rainmaking techniques for drought mitigation.
Lesson Doubts
Ask questions, get expert answers