📊 India's Production Scenario
Review India's foodgrain output, crop trends, GVA, major crops, leading states, and global agriculture rankings.
Quick answer: India's final foodgrain production for 2024-25 is 357.73 million tonnes, the highest on record. The biggest components are rice 150.18 MT, wheat 117.94 MT, nutri/coarse cereals 63.92 MT and pulses 25.68 MT. Oilseeds reached 42.99 MT. India ranks 1st globally in milk, pulses, jute and spices, and 2nd in rice, wheat, sugarcane, fruits and vegetables.
| Search Query / Exam Prompt | Direct Answer |
|---|---|
| India foodgrain production 2024-25 | 357.73 MT final estimate |
| India rice production 2024-25 | 150.18 MT |
| India wheat production 2024-25 | 117.94 MT |
| India pulses production 2024-25 | 25.68 MT; gram is highest at 11.11 MT |
| India oilseeds production 2024-25 | 42.99 MT; soybean is highest at 15.27 MT |
| Agriculture workforce share | 46.1% (PLFS 2023-24) |
| Agriculture share in GVA | About 16% at current prices |
| Largest milk producer | India; 247.87 MT in 2024-25 |
India's agricultural output is a direct consequence of its agro-climatic diversity (covered in the previous lesson). The fertile alluvial soils and high irrigation of the Trans-Gangetic Plains (Zone 6) make Punjab the wheat bowl, while the humid tropics of the West Coast (Zone 12) sustain spices and plantation crops. Each zone's climate, soil, and water resources determine what India grows and how much. This lesson quantifies that output — the numbers that define India's agricultural economy.
TIP
How to read this lesson: Don't memorize production numbers in isolation. Every stat connects back to a zone: "Why does Punjab lead in wheat productivity?" → Zone 6, alluvial soil, 98% irrigation, Green Revolution HYVs. "Why does MP lead in pulses?" → Zones 7-9, dryland black+red soils, rainfed agriculture. This causal thinking is what exams actually test.
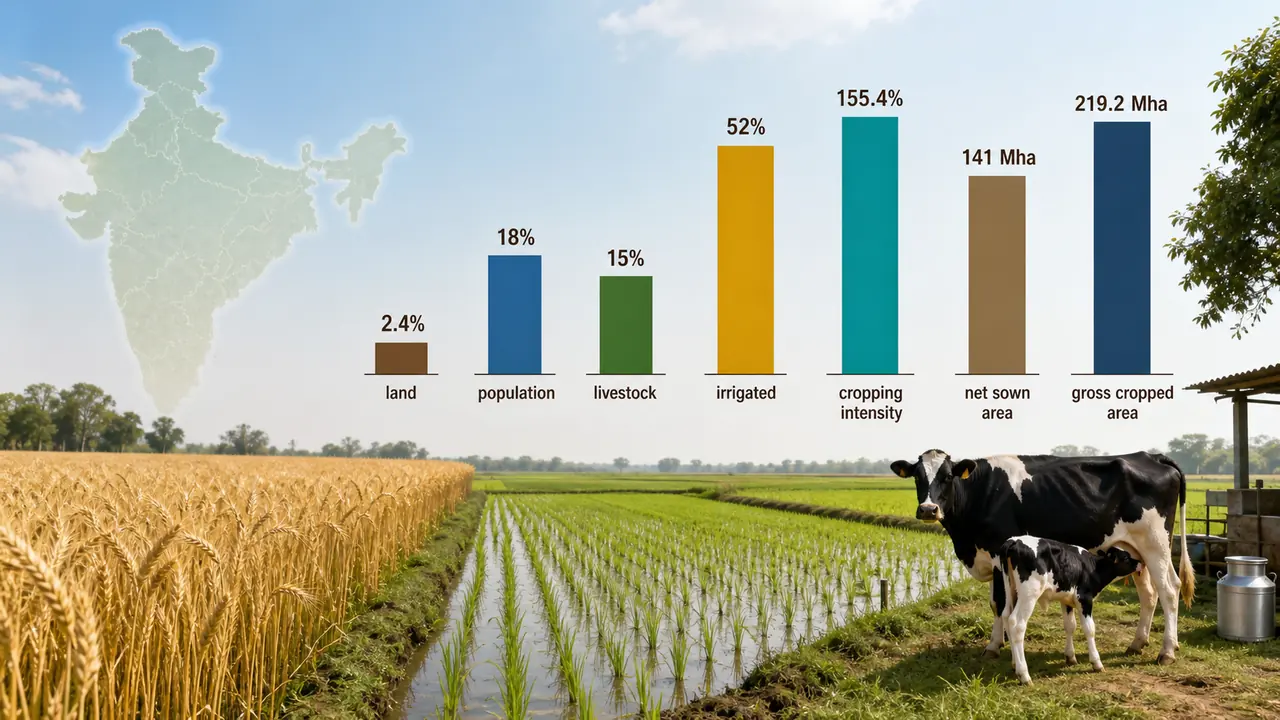
India's Agricultural Profile — At a Glance
| Parameter | Value | Significance |
|---|---|---|
| Share of world's geographical area | 2.4% | Small land, huge population pressure |
| Share of world's population | 18% | Enormous demand for food |
| Share of world's livestock | 15% | Major dairy and meat producer |
| Arable land (% of total area) | ~52% | One of the highest globally |
| Per capita arable land | 0.12 ha (World Bank 2016) | Declining due to urbanization |
| Workforce in agriculture | 46.1% [1] | Down from 54.6% (Census 2011); women's share rising to 64.4% |
| Agriculture's share in GVA | ~16% at current prices [2] | GVA grew 3.8% in FY25 |
| Total geographical area | 328.7 million hectares | Land Use Statistics |
| Net sown area | 141.0 Mha [3] | Area actually cultivated |
| Gross cropped area | 219.2 Mha [3] | Includes area cropped more than once |
| Cropping intensity | 155.4% [3] | Up from 143.6%; reflects expansion of multiple cropping |
| Irrigated area | 77.9 Mha (net); ~55% of GCA [2] | Up from 49% in FY16 to 55% in FY21 |
| Rainfed area | ~45% of GCA | Vulnerable to monsoon variability — concentrated in Zones 8-10, 13-14 (semi-arid plateau and western dry regions) |
IMPORTANT
Key structural issue: 46.1% of India's workforce produces only ~16% of GVA — indicating low productivity per worker in agriculture. This is a frequently asked analytical question in exams.
Agriculture Gross Value Added (GVA) Trends
GVA is the primary metric used to assess agriculture's contribution to India's economy. Understanding GVA trends helps explain why agriculture's share in GDP is declining even as absolute output grows — a distinction exams frequently test.
GVA measures the contribution of a sector to the overall economy: value of output minus value of inputs.
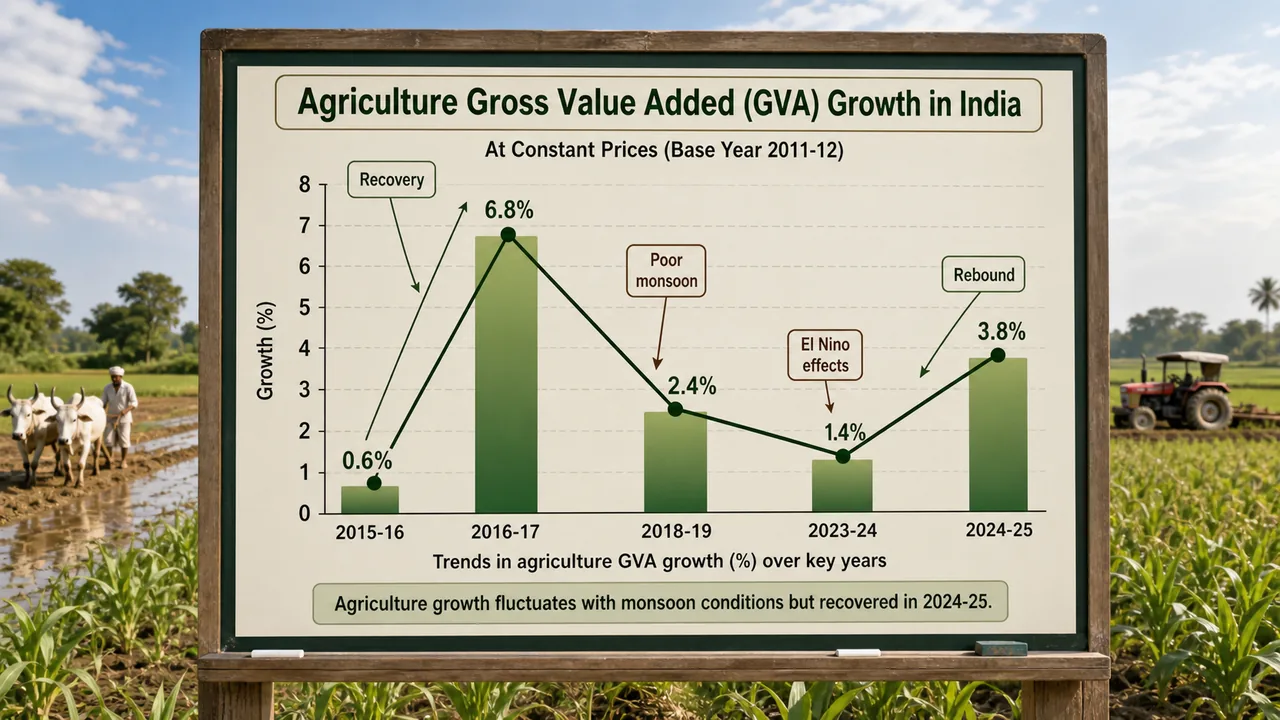
GVA Growth Rates
| Year | Agriculture GVA Growth Rate | Key Factor |
|---|---|---|
| 2015-16 | 0.6% | Low growth year |
| 2016-17 | 6.8% | Substantial recovery |
| 2017-18 | 5.9% | Slight decline |
| 2018-19 | 2.4% | Sharp fall (poor monsoon) |
| 2019-20 | 4.0% | Recovery |
| 2020-21 | 3.3% | Resilient during COVID-19 |
| 2021-22 | 3.5% | Steady growth |
| 2022-23 | 4.7% | Strong monsoon year |
| 2023-24 | 1.4% | Slowdown (erratic monsoon, El Niño) |
| 2024-25 | 3.8% | Rebound [2] |
TIP
5-year average (FY17–FY23): Agriculture sector demonstrated resilience with an average growth rate of 5% (Economic Survey 2024-25). The FY24 dip to 1.4% was driven by El Niño-induced erratic rainfall.
Table 1: GVA of agriculture and allied sectors and its share in total GVA of the country at current prices (Rs. in Crore)
| Items | 2015-16 | 2016-17 | 2017-18 | 2018-19@ | 2019-20** |
|---|---|---|---|---|---|
| GVA of Agriculture and Allied Sectors (Rs. In Crore) | 22,27,533 | 25,18,662 | 27,96,908 | 29,22,846 | 32,57,443 |
| Per cent to total GVA | 17.7 | 18.0 | 18.0 | 17.1 | 17.8 |
Agricultural example: The sharp fall to 2.4% in 2018-19 demonstrates agriculture's sensitivity to monsoon performance. When the monsoon fails, rainfed crops like pulses and oilseeds suffer the most, pulling down overall growth. Similarly, the 1.4% dip in 2023-24 was driven by El Niño-induced erratic rainfall. Zones like the Western Dry Region (Zone 14, ~95 mm rainfall) and Gujarat Plains (Zone 13, 78% rainfed) are most vulnerable.
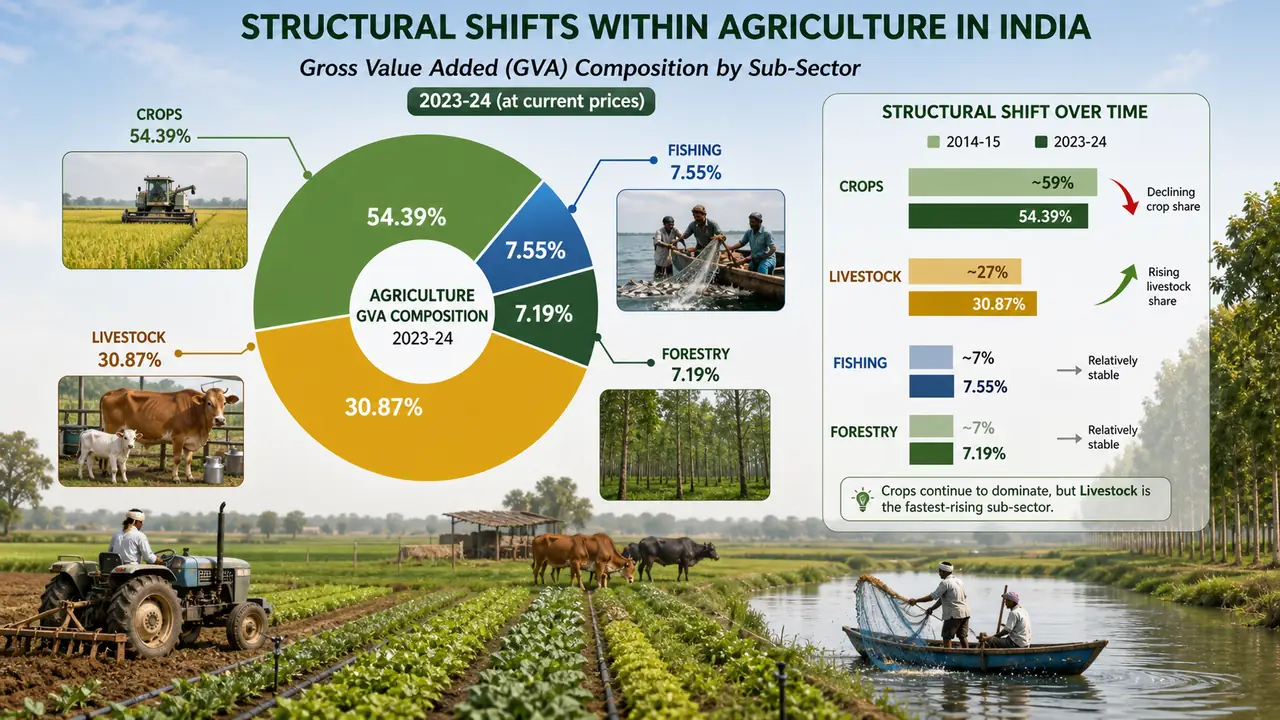
Structural Shifts Within Agriculture
| Trend | Detail |
|---|---|
| Agriculture's share in total GVA | Declined from 18.2% (2014-15) to 17.8% (2019-20) |
| Share of crops within agriculture | Fell from 11.2% (2014-15) to 9.4% (2018-19) |
| Compensating growth | Livestock and fisheries sectors are rising |
Table 2: Growth (over the previous year) in the total GVA of the Economy and that in the GVA of Agriculture and Allied sectors at 2011-12 at base prices (in percent)
| Year | Total Economy | Agriculture & Allied Sector | Crops | Livestock | Forestry & Logging | Fishing |
|---|---|---|---|---|---|---|
| 2015-16 | 8.0 | 0.6 | -2.9 | 7.5 | 1.7 | 9.7 |
| 2016-17* | 8.0 | 6.8 | 5.3 | 10.0 | 5.5 | 10.4 |
| 2017-18# | 6.6 | 5.9 | 4.4 | 7.4 | 6.2 | 14.7 |
| 2018-19@ | 6.0 | 2.4 | -1.0 | 8.1 | 0.4 | 12.0 |
| 2019-20** | 3.9 | 4.0 | Will be released in January, 2021. |
Share of Agriculture and Allied Sectors in Total GVA [2]
| Items | 2023-24 | Key Trend |
|---|---|---|
| Share of Agriculture & Allied Sector in total GVA | ~18% | Stable over the decade |
| Share of Crops (within Agri & Allied) | 54.39% | Dominant but declining share |
| Share of Livestock | 30.87% | Rising — fastest growing sub-sector |
| Share of Fishing & aquaculture | 7.55% | Steadily rising |
| Share of Forestry & logging | ~7.19% | Relatively stable |
GVA of Agriculture & Allied Sector (at current prices): ₹20,93,612 Crore (2014-15) → ₹48,77,867 Crore (2023-24) → ₹52,08,800 Crore (2025-26 SAE). CAGR of 8.83% over the decade. [6]
GVA growth at current prices (last 5 years): [7]
| Year | 2020-21 | 2021-22 | 2022-23 | 2023-24 | 2024-25 (PE) |
|---|---|---|---|---|---|
| Growth (%) | 10.0 | 10.6 | 8.5 | 9.6 | 10.4 |
TIP
Exam interpretation: The declining share of agriculture in GVA does not mean agriculture is shrinking — it means industry and services are growing faster. This is a natural trend in all developing economies. In absolute terms, agriculture GVA has more than doubled in a decade (₹20.9 lakh crore → ₹48.8 lakh crore).
Capital Formation in Agriculture
Investment in agriculture determines long-term productivity growth. While production data tells us what India grows, capital formation tells us how much the country is investing in its agricultural future — irrigation infrastructure, farm machinery, land improvement, and storage.
- Gross Capital Formation (GCF) indicates the level of investment in agricultural infrastructure, machinery, and land improvement.
- GCF as % of GVA rose from 14.7% (2015-16) to 19.9% (2022-23) — a strong upward trend driven by increased public investment. [9]
- GCF in agriculture grew at 19.04% in 2022-23; average annual GCF growth from 2016-17 to 2022-23 was 9.70%. [9]
- The overall economy's GFCF grew at 7.1% in FY 2024-25 (Provisional Estimates). [8]
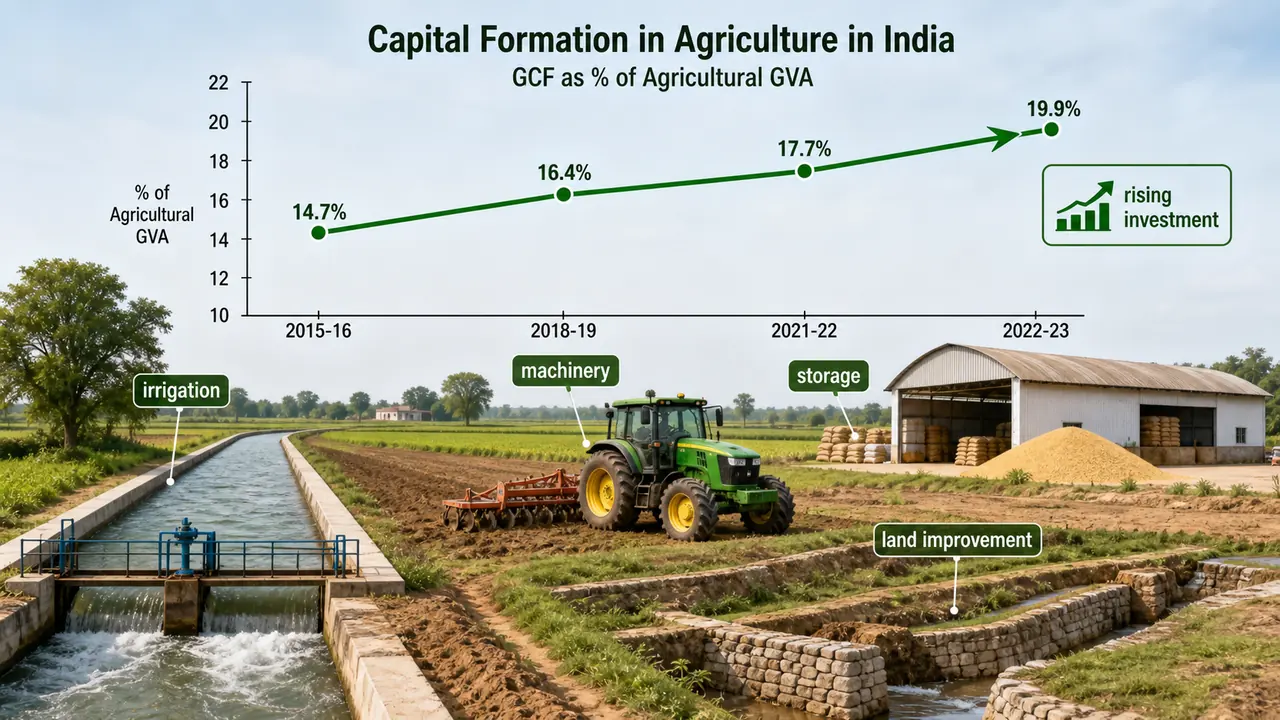
Table 3: Gross Capital Formation (GCF) in Agriculture and Allied Sectors relative to GVA at 2011-12 base price (Rs. in Crore) [9]
| Year | GCF of Agriculture & Allied Sector | GVA of Agriculture & Allied Sector | GCF as % of GVA |
|---|---|---|---|
| 2013-14 | 2,84,424 | 16,09,198 | 17.7 |
| 2014-15 | 2,72,663 | 16,05,715 | 17.0 |
| 2015-16 | 2,37,648 | 16,16,146 | 14.7 (lowest) |
| 2016-17 | 2,67,153 | 17,26,004 | 15.5 |
| 2017-18 | 2,83,922 | 18,28,329 | 15.5 |
| 2018-19 | 3,06,749 | 18,72,339 | 16.4 |
| 2021-22 | — | — | 17.7 |
| 2022-23 | — | — | 19.9 (highest in decade) |
Note: Year-wise GCF/GVA absolute figures for 2019-20 to 2022-23 are from Economic Survey 2023-24 chart (Fig 9.5). GCF as % of GVA values are from the PIB release.
TIP
Why GCF matters: Low GCF means farmers rely on old equipment, degraded irrigation, and poor storage — reducing productivity even when weather is good. The jump from 14.7% (2015-16) to 19.9% (2022-23) reflects increased government investment via PM-KISAN, PMFBY, and Per Drop More Crop (₹21,969 Cr allocated FY16-25).
Profile of Indian Agriculture — Key Statistics
These structural parameters — farm size, workforce composition, and women's participation — define the social context of Indian agriculture. They explain why policy focuses on smallholders and why mechanisation faces adoption challenges.
| Parameter | Value | Source |
|---|---|---|
| States with > 30% agriculture in SGVA | AP, Arunachal Pradesh, MP, Nagaland, Tripura | NSO, 2016-17 |
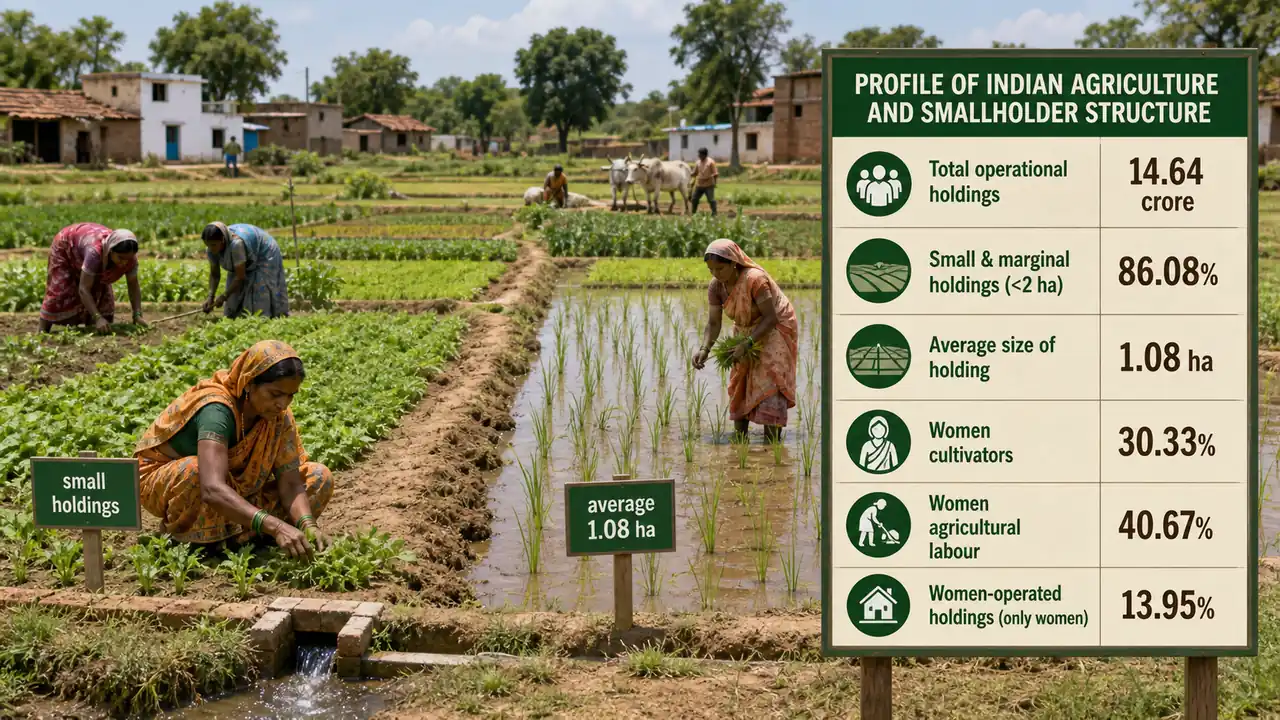
| Total operational holdings | 14.64 Crore | Agriculture Census 2015-16 |
| Agricultural workers in total workers | 54.6% | Registrar General of India |
| Rural households in agriculture | 57.8% | NSO Survey |
| Small & marginal holdings (< 2 ha) | 86.08% of total holdings | Agriculture Census 2015-16 |
| Average holding size | 1.08 ha | Agriculture Census 2015-16 |
| Women as cultivators | 30.33% of total cultivators | Census |
| Women as agricultural labour | 40.67% of total agri. labour | Census |
| Holdings operated by women | 13.95% | Agriculture Census 2015-16 |
IMPORTANT
Most asked statistics: Small and marginal holdings = 86.08%. Average holding = 1.08 ha. Women in agri. labour = 40.67%. Holdings by women = only 13.95%.
Demand Projection vs Production
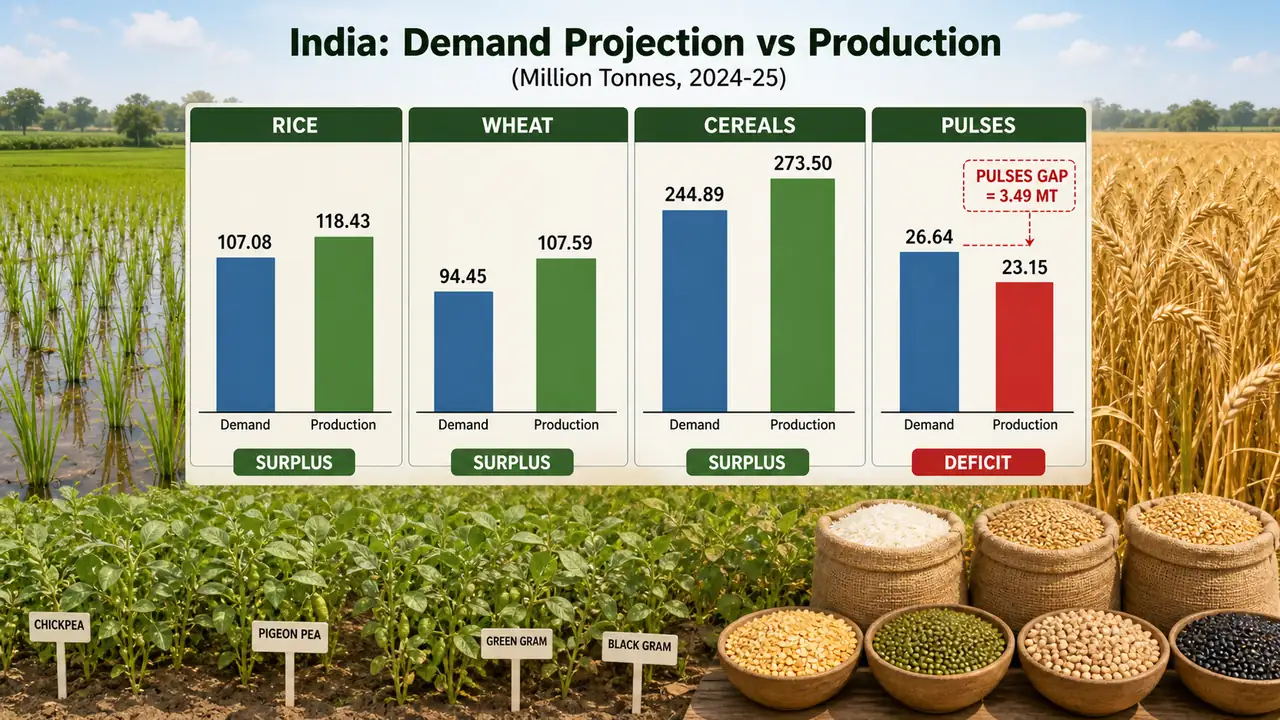
Demand Projection vs Production (million tonnes)
| Commodity | Rice | Wheat | Cereals | Pulses |
|---|---|---|---|---|
| Demand projection | 107.08 | 94.45 | 244.89 | 26.64 |
| Production | 118.43 | 107.59 | 273.50 | 23.15 |
India comfortably exceeds demand in rice, wheat, and cereals — thanks largely to the high productivity of Zone 6 (Trans-Gangetic Plains) and Zone 5 (Upper Gangetic Plain). However, pulses show a deficit (demand 26.64 MT vs production 23.15 MT), reflecting the challenge of growing pulses on rainfed lands in the semi-arid zones (8, 9, 10) where moisture is unreliable.
Production Scenario 2024-25 (Final Estimates)
This is the most exam-critical section of the lesson — current production figures are directly tested in exams, FCI, and NABARD papers. The numbers below reflect the latest final estimates and supersede earlier advance estimates.
The Department of Agriculture & Farmers Welfare releases production data through 4 advance estimates each year, followed by final estimates. India achieved the highest-ever foodgrain production in 2024-25 — an increase of ~106 MT over the last decade (from 251.54 MT in 2015-16).
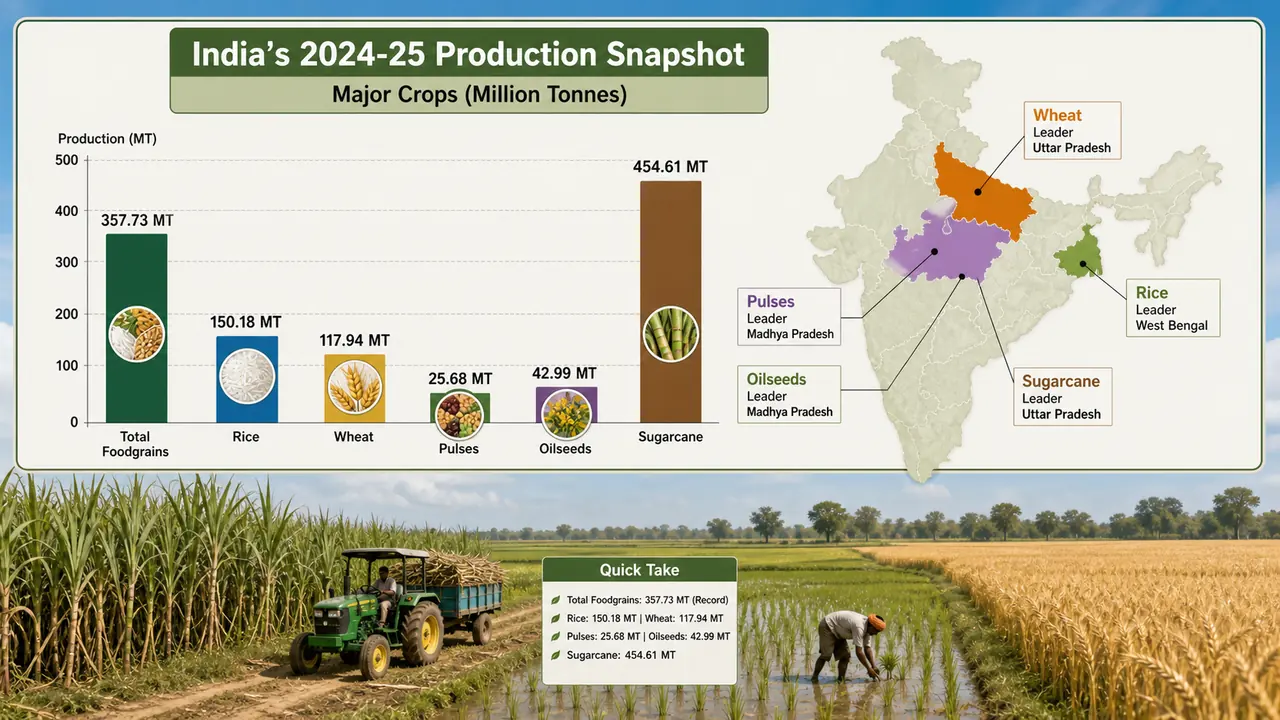
2024-25 Snapshot for Fast Revision
| Category | 2024-25 Final Production | Exam Takeaway |
|---|---|---|
| Total foodgrains | 357.73 MT | All-time record; +25.43 MT over 2023-24 |
| Rice | 150.18 MT | Largest single foodgrain component |
| Wheat | 117.94 MT | Record wheat output |
| Nutri / coarse cereals | 63.92 MT | Maize is the largest within this group |
| Pulses | 25.68 MT | Gram / chickpea is the largest pulse |
| Oilseeds | 42.99 MT | Soybean is the largest oilseed |
| Sugarcane | 454.61 MT | UP leads production |
Food Grains — 357.73 million tonnes (All-Time Record) [4]
| Crop | Production (MT) | vs 2020-21 |
|---|---|---|
| Rice | 150.18 | ↑ from 122.27 — Record |
| Wheat | 117.94 | ↑ from 109.52 — Record |
| Nutri / Coarse Cereals | 63.92 | ↑ from 51.15 |
| Maize | 43.41 | ↑ from 31.51 — Record |
| Shri Anna (Millets) | 18.59 | New tracking category |
Rice and wheat together account for over 75% of India's total food grain production. This dominance traces directly to the Green Revolution in Zone 6 (Trans-Gangetic Plains) — semi-dwarf HYVs + irrigation turned Punjab-Haryana into the "Granary of India." UP (Zones 4-5) now leads in rice production by volume.
Pulses — 25.68 million tonnes
| Crop | Production (MT) |
|---|---|
| Gram (Chickpea) | 11.11 |
| Moong | 4.24 |
| Tur (Pigeon pea) | 3.62 |
Oilseeds — 42.99 million tonnes (Record) [4]
| Crop | Production (MT) |
|---|---|
| Soybean | 15.27 (Record) |
| Groundnut | 11.94 (Record) |
| Rapeseed & Mustard | 12.67 (Record) |
MP (Zones 7-9) leads in both pulses and oilseeds — its black cotton and red soils in the semi-arid plateau suit these dryland crops. Gujarat (Zone 13) leads in groundnut thanks to sandy-loam coastal soils.
Other Major Commodities
| Commodity | Production | India's Global Position |
|---|---|---|
| Sugarcane | 454.61 MT | 2nd largest producer (after Brazil); largest sugar producer — UP (Zone 5) leads in production; Maharashtra (Zone 9) leads in productivity |
| Cotton | 29.72 million bales (170 kg each) | Largest producer and area globally — Gujarat (Zone 13) and Maharashtra (Zone 9) dominate thanks to regur soils |
| Jute & Mesta | 8.80 million bales (180 kg each) | Largest jute producer globally — West Bengal (Zone 3) with humid climate and alluvial soils |
IMPORTANT
Highest production within category (2024-25):
- Among Pulses: Chickpea (Gram) — 11.11 MT
- Among Oilseeds: Soybean — 15.27 MT
- Decade growth: Food grains from 251.54 MT (2015-16) → 357.73 MT (2024-25) = +42%
Agriculture at a Glance — Production (Million Tonnes) [4]
| Crops | 2022-23 | 2023-24 | 2024-25 (Final) | Change vs 2023-24 |
|---|---|---|---|---|
| Rice | 135.75 | 137.83 | 150.18 | +8.9% (Record) |
| Wheat | 110.55 | 113.29 | 117.94 | +4.1% (Record) |
| Maize | 35.91 | 37.67 | 43.41 | +15.2% (Record) |
| Shri Anna (Millets) | 16.97 | 17.57 | 18.59 | +5.8% |
| Total Coarse Cereals | 55.33 | 57.41 | 63.92 | +11.3% |
| Total Pulses | 23.44 | 23.77 | 25.68 | +8.0% |
| Total Foodgrains | 329.69 | 332.30 | 357.73 | +7.7% (Record) |
| Total Oilseeds | 40.14 | 39.67 | 42.99 | +8.4% (Record) |
| — Soybean | 14.98 | 13.17 | 15.27 | +15.9% |
| — Groundnut | 10.13 | 10.52 | 11.94 | +13.5% |
| — Rapeseed & Mustard | 12.48 | 13.21 | 12.67 | -4.1% |
| Sugarcane | 490.53 | 452.78 | 454.61 | +0.4% |
| Cotton@ | 34.22 | 32.52 | 29.72 | -8.6% |
| Jute & Mesta# | 9.38 | 9.15 | 8.80 | -3.8% |
Final estimates 2024-25, PIB PRID/2192315. @Production in million bales of 170 kg each. #Production in million bales of 180 kg each.
TIP
Decade in perspective: From 251.54 MT (2015-16) to 357.73 MT (2024-25) — foodgrain production grew +42% in 10 years, driven by MSP assurance, irrigation expansion (49% → 55% of GCA), and oilseed/pulse missions.
Leading States in Area, Production and Productivity
Knowing which state leads in what is among the most frequently tested topics. The leading states are not random — they reflect the agro-climatic advantages of their zones.
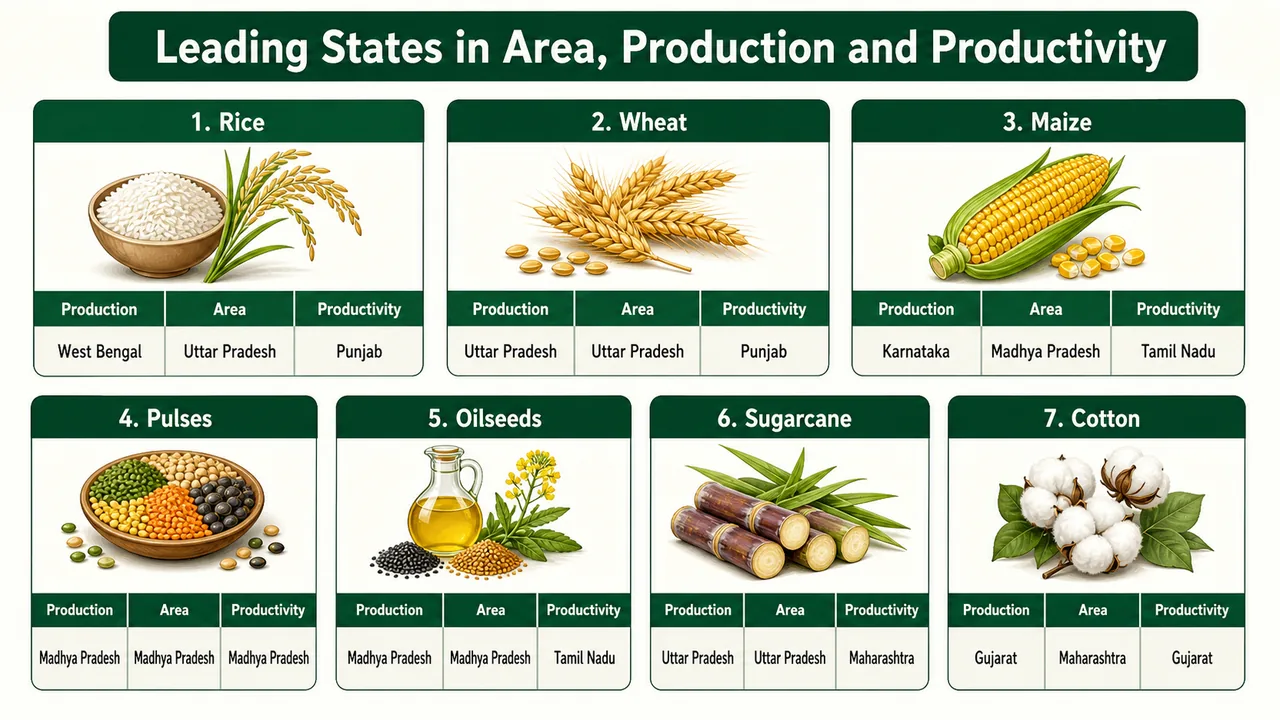
| Crops | Production | Area | Productivity |
|---|---|---|---|
| Rice | West Bengal | Uttar Pradesh | Punjab |
| Wheat | Uttar Pradesh | Uttar Pradesh | Punjab |
| Maize | Karnataka | Madhya Pradesh | Tamil Nadu |
| Sorghum | Maharashtra | Maharashtra | Andhra Pradesh |
| Total Coarse Cereals | Rajasthan | Rajasthan | Andhra Pradesh |
| Total Pulses | Madhya Pradesh | Madhya Pradesh | Madhya Pradesh |
| Total Food Grains | Uttar Pradesh | Uttar Pradesh | Punjab |
| Rapeseed and Mustard | Rajasthan | Rajasthan | Haryana |
| Sunflower | Karnataka | Karnataka | Punjab |
| Total Oilseeds | Madhya Pradesh | Madhya Pradesh | Tamil Nadu |
| Sugarcane | Uttar Pradesh | Uttar Pradesh | Maharashtra |
| Cotton | Gujarat | Maharashtra | Gujarat |
| Tobacco | Gujarat | Gujarat | Uttar Pradesh |
Zone connections: Punjab leads in wheat and rice productivity — it sits in Zone 6 (Trans-Gangetic Plains) with fertile alluvial soils, semi-arid climate, and the highest cropping intensity in India driven by near-universal irrigation. Madhya Pradesh dominates pulses and oilseeds — spanning Zones 7, 8, and 9, its mix of black cotton soils (regur) and red soils suits dryland pulse and oilseed crops. Gujarat leads in cotton production — Zone 13 (Gujarat Plains) has regur soils ideal for cotton, while Maharashtra (Zone 9, Western Plateau) has the largest cotton area thanks to its extensive black soil tracts. West Bengal leads in rice production — Zone 3 (Lower Gangetic Plain) provides 1300-1600 mm rainfall and alluvial soils perfect for paddy.
Leading States in Production — Detailed
| Crop | Leading States (in Production) | All India Production (Million tonnes) |
|---|---|---|
| Rice | West Bengal > Punjab > Uttar Pradesh | 122.27 |
| Wheat | Uttar Pradesh > Punjab > Madhya Pradesh | 109.52 |
| Maize | Karnataka > Maharashtra > Madhya Pradesh | 31.51 |
| Total Coarse Cereals | Rajasthan > Karnataka > Maharashtra | 51.15 |
| Total Pulses | Madhya Pradesh > Rajasthan > Maharashtra | 25.72 |
| Total Oilseeds | Madhya Pradesh > Rajasthan > Gujarat | 36.10 |
| Total Food Grains | Uttar Pradesh > Madhya Pradesh > Punjab | 308.65 |
| Soybean | Madhya Pradesh > Maharashtra > Rajasthan | 12.90 |
| Groundnut | Gujarat > Rajasthan > Andhra Pradesh | 10.21 |
| Cotton | Gujarat > Maharashtra > Telangana | 35.38 (in Bales) |
| Rapeseed & Mustard | Rajasthan > Haryana > Madhya Pradesh | 10.11 |
| Sunflower | Karnataka > Bihar > Odisha | 0.23 |
| Sugarcane | Uttar Pradesh > Maharashtra > Karnataka | 399.25 |
| Jute & Mesta | West Bengal > Bihar > Assam | 9.56 (in Bales) |
Source: Annual Report MoAFW 2017-18
Land Utilization in India
| Category | Share of Total Sown Area |
|---|---|
| Food crops | 74% |
| Horticultural crops | 8.61% |
India's Position in World Agriculture
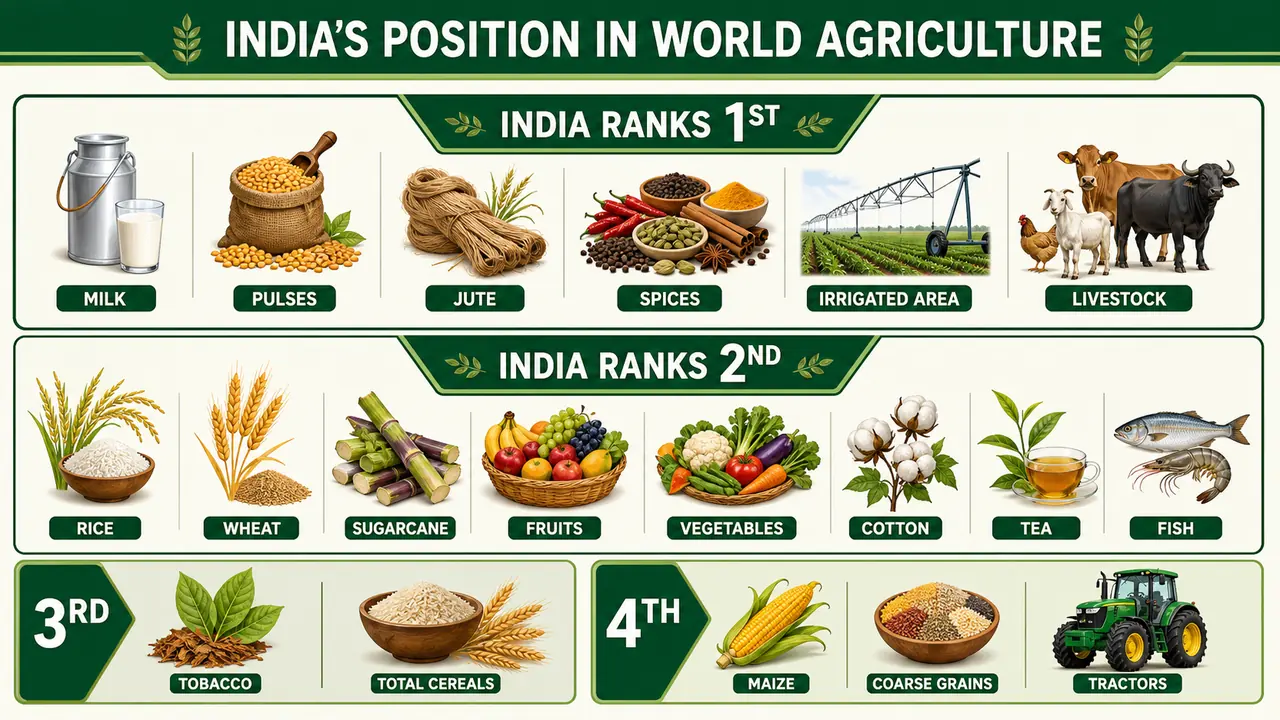
India's position in world agriculture reflects both its massive land area and the agro-climatic diversity that supports a wide range of crops. These global rankings are tested as direct one-liners — memorise the 1st and 2nd rank commodities.
India's global rankings are a direct reflection of its agro-climatic diversity and agricultural policies. India leads in milk production due to Dr. Verghese Kurien's Operation Flood and the cooperative dairy model that transformed millions of small farmers into dairy producers. India's dominance in pulses reflects the country's vegetarian dietary tradition and the cultural importance of daal as a primary protein source. In jute and spices, the humid tropical zones of the East Coast and West Coast (Zones 11, 12) provide the ideal growing conditions that few other countries can match.
| Rank | Commodities |
|---|---|
| Largest producer (1st) | Milk, Pulses, Jute, Spices |
| 2nd largest producer | Rice, Wheat, Sugarcane, Fruits, Vegetables, Cotton, Tea, Fish |
| Content | India Rank | 1st Rank |
|---|---|---|
| Total Geographical Area | 7th — 328.7 Mha (2016-17) | Russia |
| Irrigated Area | 1st — 68.6 Mha (2016-17) | India > China |
| Human Population | 2nd — 1.3 billion | After China |
| Livestock Population | 1st — 535.78 M (20th Census, 2019); 21st Census underway | India |
| Total Cereals | 3rd | China > USA |
| Rice & Wheat | 2nd — 150.18 MT & 117.94 MT (2024-25) | China |
| Maize | 4th | USA |
| Coarse grains | 4th | USA |
| Total Pulses | 1st — 25.68 MT (25% of global production) | India |
| Oil Seeds | 2nd | China |
| Vegetable | 2nd — 184.39 MT (2017-18) | China |
| Fruits | 2nd — 97.35 MT (2017-18) | China |
| Milk | 1st — 247.87 MT (2024-25); 25% of world production [5] | India |
| Groundnut | 2nd | Brazil |
| Cotton & Tobacco | 3rd | China |
| Tea | 2nd | China |
| Jute | 1st | India |
| No. of tractors | 4th | USA > Japan > Italy |
Exam Tips
TIP
Key numbers to memorize (2024-25):
- Total food grain production = 357.73 MT (all-time record)
- Rice = 150.18 MT, Wheat = 117.94 MT, Oilseeds = 42.99 MT
- Net sown area = 141 Mha, Gross cropped area = 219.2 Mha
- Cropping intensity = 155.4%
- Irrigated: 55% of GCA (up from 49% in FY16)
- Agriculture workforce = 46.1% (PLFS 2023-24)
- Milk production = 247.87 MT (world's largest, 25% of global)
- Small & marginal holdings = 86.08%, Average size = 1.08 ha
- India 1st in: Milk, Pulses, Jute, Spices
- India 2nd in: Rice, Wheat, Sugarcane, Fruits, Vegetables
Summary Cheat Sheet
| Concept / Topic | Key Details / Explanation |
|---|---|
| India's world share | 2.4% of geographical area; 18% of world population; 15% of world livestock |
| Arable land | ~52% of total area — one of the highest globally |
| Per capita arable land | 0.12 ha (World Bank 2016) — declining due to urbanization |
| Total geographical area | 328.7 Mha |
| Net sown area | 141.0 Mha (LUS 2021-22) |
| Gross cropped area | 219.2 Mha |
| Cropping intensity | 155.4% (GCA/NSA x 100); up from 143.6% |
| Irrigated area | 77.9 Mha (net); 55% of GCA — up from 49% in FY16 |
| Rainfed area | ~45% of GCA — vulnerable to monsoon; Zones 8-10, 13-14 |
| Agriculture workforce | 46.1% (PLFS 2023-24); down from 54.6% (Census 2011); women's share rising to 64.4% |
| Agriculture share in GVA | ~16% at current prices; GVA grew 3.8% in FY25 (constant prices) |
| Structural issue | 46.1% workforce produces only ~16% GVA = low productivity per worker |
| GVA at current prices | ₹48.78 lakh crore (2023-24) → ₹52.09 lakh crore (2025-26 SAE); CAGR 8.83% over decade |
| GVA growth (current prices, FY25 PE) | 10.4% |
| GVA sub-sector shares (2023-24) | Crops 54.39%, Livestock 30.87%, Fishing 7.55%, Forestry 7.19% |
| 5-year avg GVA growth (FY17-FY23) | 5% at constant prices (Economic Survey 2024-25) |
| GCF as % of agriculture GVA | Rose from 14.7% (2015-16) to 19.9% (2022-23, highest in decade) |
| GCF growth (2022-23) | 19.04%; average annual growth 9.70% (FY17-FY23) |
| Total operational holdings | 14.64 crore (Ag Census 2015-16) |
| Small & marginal holdings (<2 ha) | 86.08% of total holdings; average size = 1.08 ha |
| Women in agriculture | Cultivators 30.33%; agri labour 40.67%; holdings by women only 13.95% |
| Food grain production (2024-25) | 357.73 MT — all-time record; +42% over decade (from 251.54 MT in 2015-16) |
| Rice (2024-25) | 150.18 MT (record) |
| Wheat (2024-25) | 117.94 MT (record) |
| Maize (2024-25) | 43.41 MT (record) |
| Shri Anna / Millets (2024-25) | 18.59 MT |
| Total Pulses (2024-25) | 25.68 MT; highest = Chickpea (Gram) 11.11 MT |
| Total Oilseeds (2024-25) | 42.99 MT (record); highest = Soybean 15.27 MT (record) |
| Groundnut (2024-25) | 11.94 MT (record) |
| Rapeseed & Mustard (2024-25) | 12.67 MT (record) |
| Sugarcane (2024-25) | 454.61 MT; 2nd largest producer (after Brazil); UP leads production, MH leads productivity |
| Cotton (2024-25) | 29.72 M bales (170 kg each); largest producer and area globally; Gujarat leads production |
| Jute & Mesta (2024-25) | 8.80 M bales (180 kg each); largest jute producer globally; West Bengal leads |
| Milk production (2024-25) | 247.87 MT — world's largest; 25% of global production |
| Demand vs production gap | Pulses show deficit (demand 26.64 MT vs production 23.15 MT); cereals surplus |
| Food crops share of sown area | 74%; horticulture 8.61% |
| Leading states — Rice | Production: West Bengal; Area: UP; Productivity: Punjab |
| Leading states — Wheat | Production & Area: UP; Productivity: Punjab |
| Leading states — Pulses | Area, Production & Productivity: MP |
| Leading states — Oilseeds | Area & Production: MP; Productivity: Tamil Nadu |
| Leading states — Sugarcane | Area & Production: UP; Productivity: Maharashtra |
| Leading states — Cotton | Production: Gujarat; Area: Maharashtra |
| India 1st globally in | Milk, Pulses, Jute, Spices + irrigated area + livestock population |
| India 2nd globally in | Rice, Wheat, Sugarcane, Fruits, Vegetables, Cotton, Tea, Fish, Oilseeds, Groundnut |
| India 3rd globally in | Tobacco, Total Cereals (after China, USA) |
| India 4th globally in | Maize, Coarse grains, Tractors |
TIP
Next: Lesson 04 covers tillage and field preparation — the physical process of converting raw land into a seedbed ready for sowing. Every production number above starts with proper tillage.
References
9 sources • [1] [2] [3] [4] [5] [6] [7] [8] [9]
References
PLFS Annual Report 2023-24 — NSO
OfficialUsed for: Periodic Labour Force Survey 2023-24 by National Statistical Office showing 46.1% workforce in agriculture
Used for: Agriculture GVA share (~16%), irrigation coverage (55% of GCA), sector growth rate (3.8% in FY25), and 5-year average growth (5%)
Used for: Net sown area (141 Mha), gross cropped area (219.2 Mha), cropping intensity (155.4%)
Used for: Record foodgrain production 357.73 MT, rice 150.18 MT, wheat 117.94 MT, oilseeds 42.99 MT, sugarcane 454.61 MT
Used for: Milk production 247.87 MT (2024-25), 25% of global production, per capita availability 485 gm/day
Used for: GVA doubled from ₹20.9L Cr (2014-15) to ₹48.8L Cr (2023-24), CAGR 8.83%. Crops 54.39%, Livestock 30.87%, Fishing 7.55%. 2025-26 SAE: ₹52,08,800 Crore
Used for: GVA growth at current prices: 10.0% (2020-21), 10.6% (2021-22), 8.5% (2022-23), 9.6% (2023-24), 10.4% (2024-25 PE)
Used for: Real GDP growth 6.5% in FY25, GFCF growth 7.1%, Primary sector growth 4.4%, Agriculture GVA at constant prices
Used for: GCF as % of GVA rose from 17.7% (2021-22) to 19.9% (2022-23). Average annual GCF growth 9.70% (2016-17 to 2022-23). Non-institutional credit share fell from 90% (1950) to 23.4% (2021-22)
Frequently Asked Questions
What is India's total food grain production in 2024-25?
India's total food grain production in 2024-25 is a record 357.73 million tonnes (MT). This includes rice (150.18 MT), wheat (117.94 MT), nutri/coarse cereals (63.92 MT), and pulses (25.68 MT). This is the highest-ever food grain production in India.
Which state is the largest producer of rice in India?
West Bengal is the largest producer of rice in India, followed by Uttar Pradesh and Punjab. These three states together contribute over 40% of India's total rice production of 150.18 MT (2024-25).
Which state is the largest producer of wheat in India?
Uttar Pradesh is the largest producer of wheat in India, followed by Madhya Pradesh and Punjab. UP alone contributes about 30% of India's total wheat production of 117.94 MT (2024-25).
What is India's global ranking in agriculture?
India ranks 1st globally in production of milk, pulses, jute, and spices. India ranks 2nd in rice, wheat, sugarcane, fruits, vegetables, cotton, and tea. India is the world's largest milk producer at 239.3 MT (2024-25).
What is the share of agriculture in India's GDP?
Agriculture and allied sectors contribute approximately 16% of India's total GVA (Gross Value Added) at current prices. Agriculture GVA grew at 3.8% in FY 2024-25, recovering from a 1.4% dip in FY 2023-24 caused by El Niño.
Which state is the largest producer of pulses in India?
Madhya Pradesh is the largest producer of pulses in India, contributing about 30% of total pulse production. India's total pulse production in 2024-25 is 25.68 MT. Other major pulse-producing states are Rajasthan, Maharashtra, and Uttar Pradesh.
What is India's rice production in 2024-25?
India's rice production in 2024-25 is 150.18 million tonnes, the highest among all foodgrain components. West Bengal is the leading rice-producing state, while Punjab leads in rice productivity.
What is India's wheat production in 2024-25?
India's wheat production in 2024-25 is 117.94 million tonnes, a record output. Uttar Pradesh is the leading wheat-producing state, and Punjab leads in wheat productivity.
What is India's oilseed production in 2024-25?
India's total oilseed production in 2024-25 is 42.99 million tonnes, a record level. Soybean is the largest oilseed at 15.27 MT, followed by rapeseed and mustard at 12.67 MT and groundnut at 11.94 MT.
What is the main demand-production gap in Indian agriculture?
The main demand-production gap is in pulses. Demand is 26.64 MT while production is 23.15 MT, showing a deficit, whereas rice, wheat, and total cereals remain in surplus.
Why is agriculture's share in GVA lower than its workforce share in India?
Agriculture employs about 46.1% of India's workforce but contributes only around 16% of total GVA, indicating low productivity per worker. This mismatch is a standard analytical point in exams.
Which states lead major crop production in India?
West Bengal leads rice production, Uttar Pradesh leads wheat and sugarcane production, Madhya Pradesh leads pulses and oilseeds production, and Gujarat leads cotton production. These state leaders reflect agro-climatic advantages and irrigation patterns.