⏱ Irrigation Scheduling -- When and How Much to Irrigate
Scientific approaches to irrigation scheduling including soil moisture depletion, IW/CPE ratio, plant-based methods, tensiometer, gravimetric method, and lysimeter for optimal crop water management in competitive exams.
The Farmer's Daily Dilemma
In the previous lesson, we covered the principles of irrigation -- soil-water relationships, field capacity, wilting point, and the key terminologies. Now we apply that knowledge to the practical question every irrigator faces: when should I irrigate, and how much water should I apply?
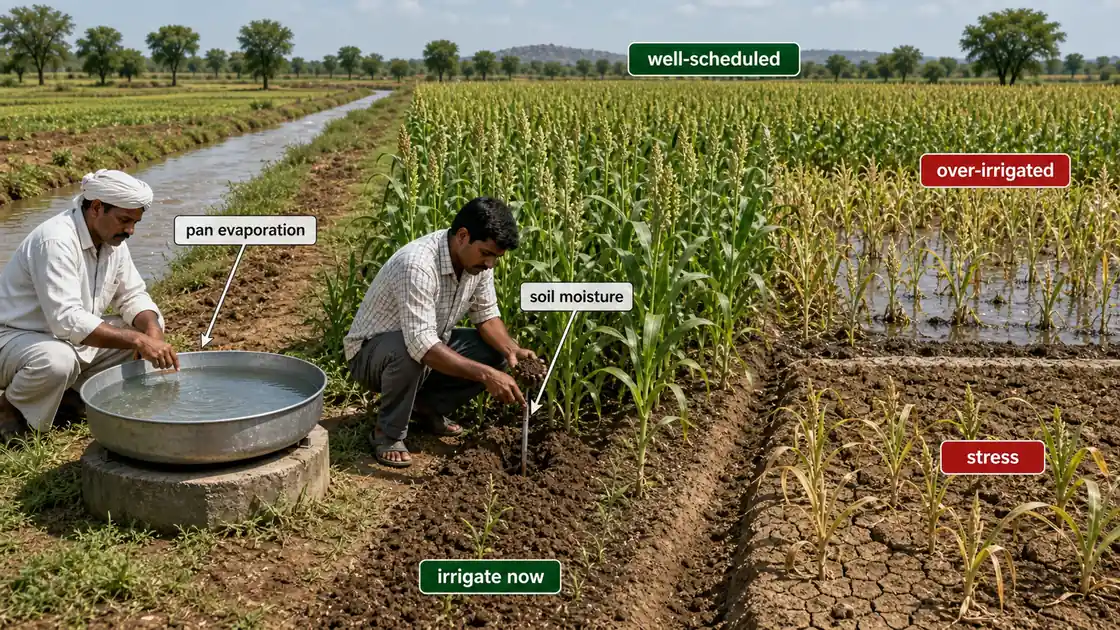
A sugarcane grower in Karnataka watches his field after the last irrigation five days ago. Should he irrigate today or wait two more days? Irrigating too early wastes water and raises costs; waiting too long stresses the crop during the critical formative phase. His neighbour, who uses a simple USWB Class A evaporation pan and the IW/CPE method, schedules irrigation scientifically -- applying 5 cm water whenever cumulative pan evaporation reaches 5 cm. The result: 20% water saving and 15% higher cane yield. Irrigation scheduling answers the twin questions of when and how much -- ensuring the right amount of water reaches the crop at the right time.
Pro Content Locked
Upgrade to Pro to access this lesson and all other premium content.
Charged once for one year · ₹1188 total
Save ₹100/month vs ₹2388/year launch price
- All Agriculture & Banking Courses
- AI Lesson Questions (100/day)
- AI Doubt Solver (50/day)
- Glows & Grows Feedback (30/day)
- AI Section Quiz (20/day)
- 22-Language Translation (100/day)
- Recall Questions (20/day)
- AI Quiz (15/day)
- AI Quiz Paper Analysis (100/day)
- AI Step-by-Step Explanations (100/day)
- Spaced Repetition Recall (FSRS)
- AI Tutor
- Immersive Text Questions
- Audio Lessons — Hindi & English
- Mock Tests & Previous Year Papers
- Summary & Mind Maps
- XP, Levels, Leaderboard & Badges
- Generate New Classrooms
- Voice AI Teacher (AgriDots Live)
- AI Revision Assistant
- Knowledge Gap Analysis
- Interactive Revision (LangGraph)
🔒 Secure one-time yearly payment via Razorpay · No hidden fees
The Farmer's Daily Dilemma
In the previous lesson, we covered the principles of irrigation -- soil-water relationships, field capacity, wilting point, and the key terminologies. Now we apply that knowledge to the practical question every irrigator faces: when should I irrigate, and how much water should I apply?
A sugarcane grower in Karnataka watches his field after the last irrigation five days ago. Should he irrigate today or wait two more days? Irrigating too early wastes water and raises costs; waiting too long stresses the crop during the critical formative phase. His neighbour, who uses a simple USWB Class A evaporation pan and the IW/CPE method, schedules irrigation scientifically -- applying 5 cm water whenever cumulative pan evaporation reaches 5 cm. The result: 20% water saving and 15% higher cane yield. Irrigation scheduling answers the twin questions of when and how much -- ensuring the right amount of water reaches the crop at the right time.
What is Irrigation Scheduling?
Irrigation scheduling is the process of determining when to irrigate and how much water to apply. It is the cornerstone of efficient water management, ensuring crops receive the right amount of water at the right time for optimal growth and yield.
Why Irrigation Scheduling Matters
| Goal | How Scheduling Helps | Agricultural Example |
|---|---|---|
| Maximize water use efficiency | Applies only needed water | Drip-irrigated tomato uses 60% less water than flood |
| Maximize yield | No stress at critical stages | Wheat irrigated at CRI stage yields 20-30% more |
| Increase cropping intensity | Saves water for additional crops | Saved water enables rabi mustard after kharif rice |
| Improve produce quality | Proper moisture = better quality | Controlled irrigation improves sugar recovery in sugarcane |
| Maintain soil and environment | Prevents waterlogging and leaching | Scheduled irrigation avoids salinization in canal areas |
Purpose of Irrigation Scheduling
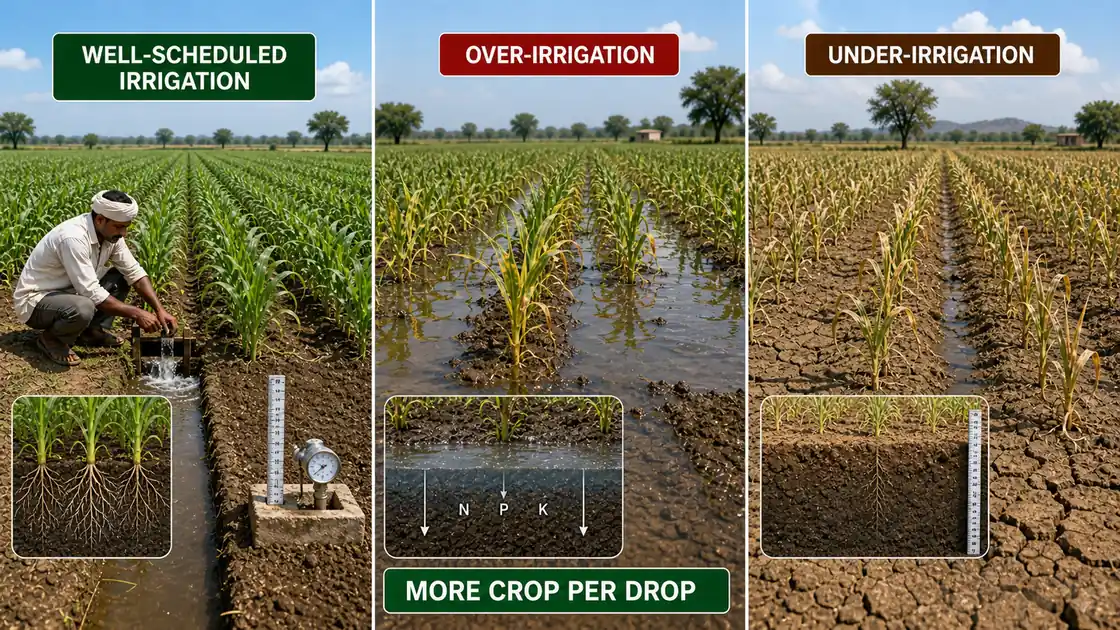
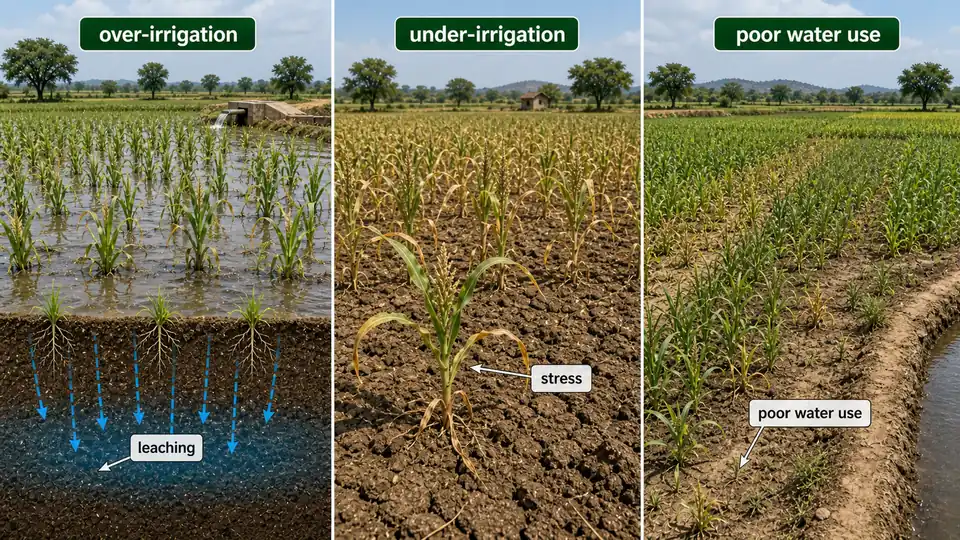
To maximize irrigation efficiency by applying the exact amount of water needed to replenish soil moisture to the desired level. The goal is to avoid:
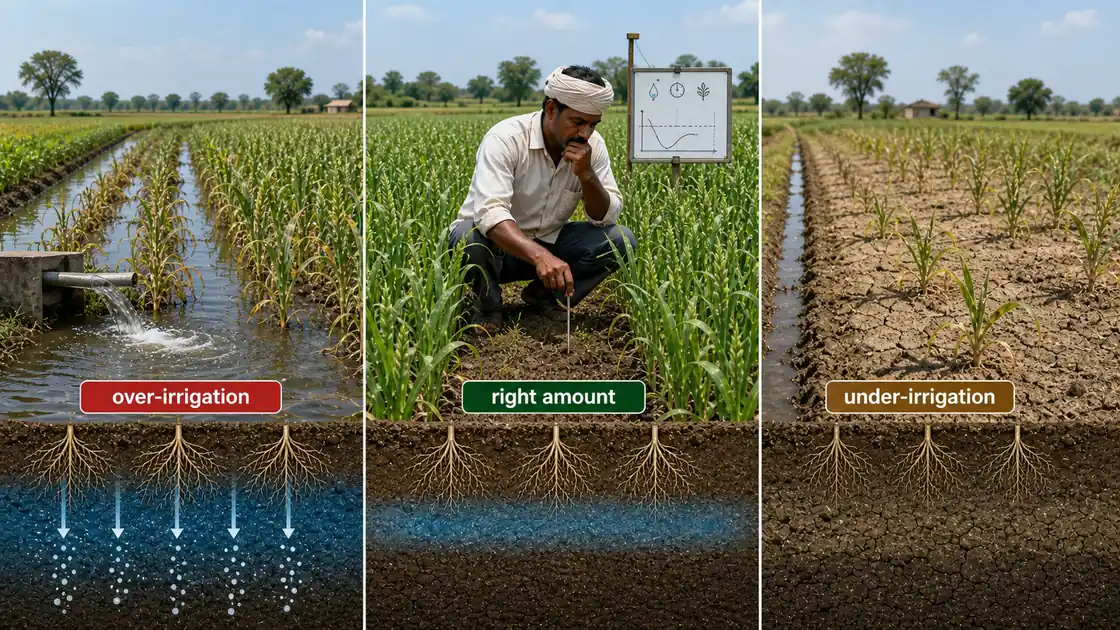
- Over-irrigation -- wastes water, damages soil, leaches nutrients
- Under-irrigation -- stresses crops, reduces yields
Agricultural example: In the canal-irrigated areas of western UP, unscheduled flood irrigation of wheat leads to waterlogging in low-lying patches and salt accumulation. Farmers who adopt IW/CPE scheduling eliminate these problems while saving 25% water.
Effects of Poor Scheduling
| Consequence | Impact | Agricultural Example |
|---|---|---|
| Inefficient water and input use | Fertilizers leach below root zone | Urea applied to over-irrigated rice leaches within hours |
| Lower crop yield | Stress during sensitive stages | Wheat missing CRI irrigation loses 20-30% yield |
| Decreased production per unit water | Poor return on irrigation investment | Over-irrigated sugarcane produces more vegetative growth but less sugar |
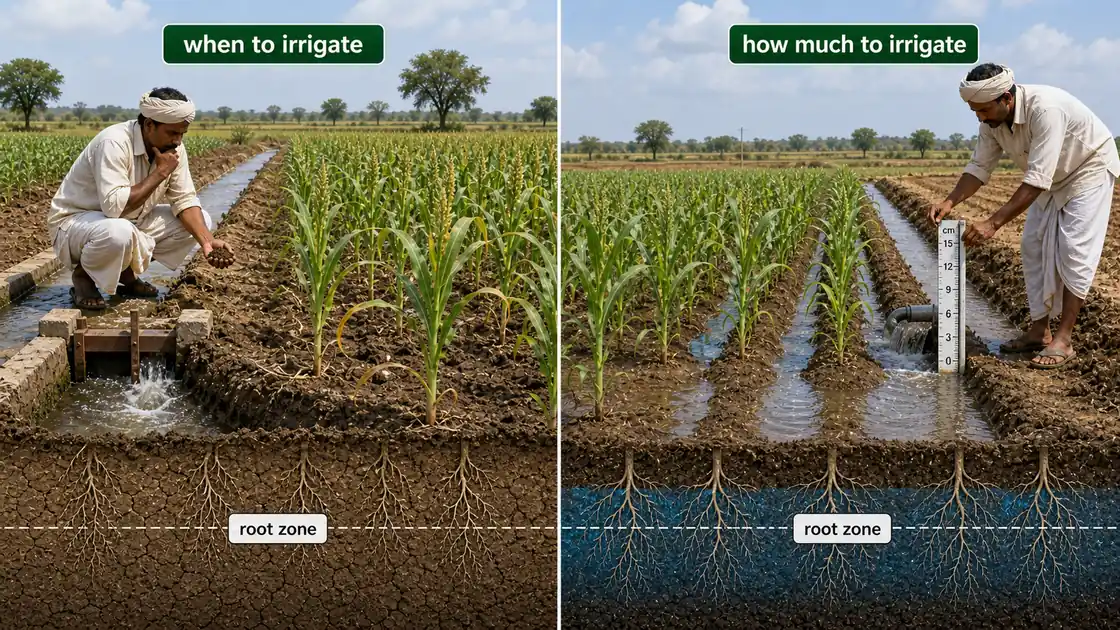
Two Fundamental Questions
Irrigation scheduling answers:
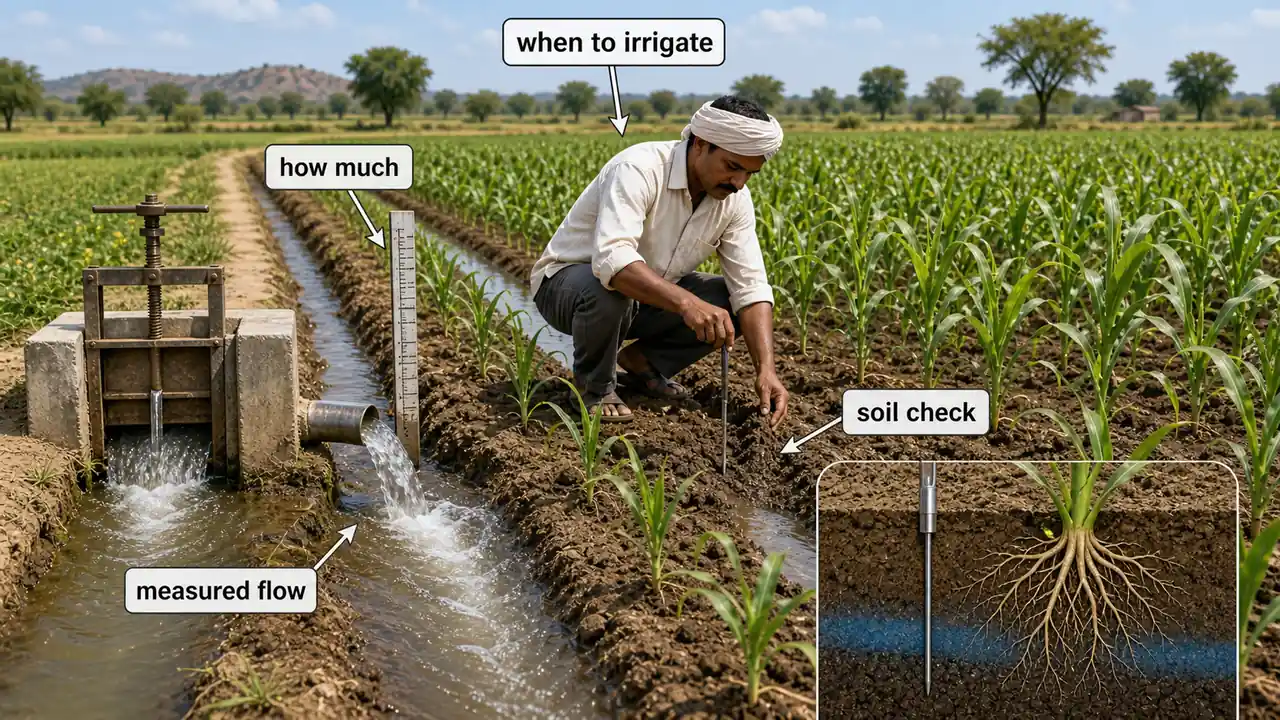
- When to irrigate -- timing is critical
- How much to irrigate -- quantity matters equally
When to Irrigate
Knowing the right time is crucial. Irrigating too early wastes water; too late stresses crops.
Key Principles
- Most crops take up water and nutrients best near field capacity
- Maximum production occurs when irrigation is given at 50% soil moisture depletion in the root zone -- a widely used rule of thumb
- Irrigate when about half the available soil moisture has been used up
Agricultural example: In a cotton field on black soil in Gujarat, the farmer irrigates when roughly half the available soil moisture is depleted. Irrigating earlier would waste water on a drought-tolerant crop; irrigating later would stress the cotton during boll development.
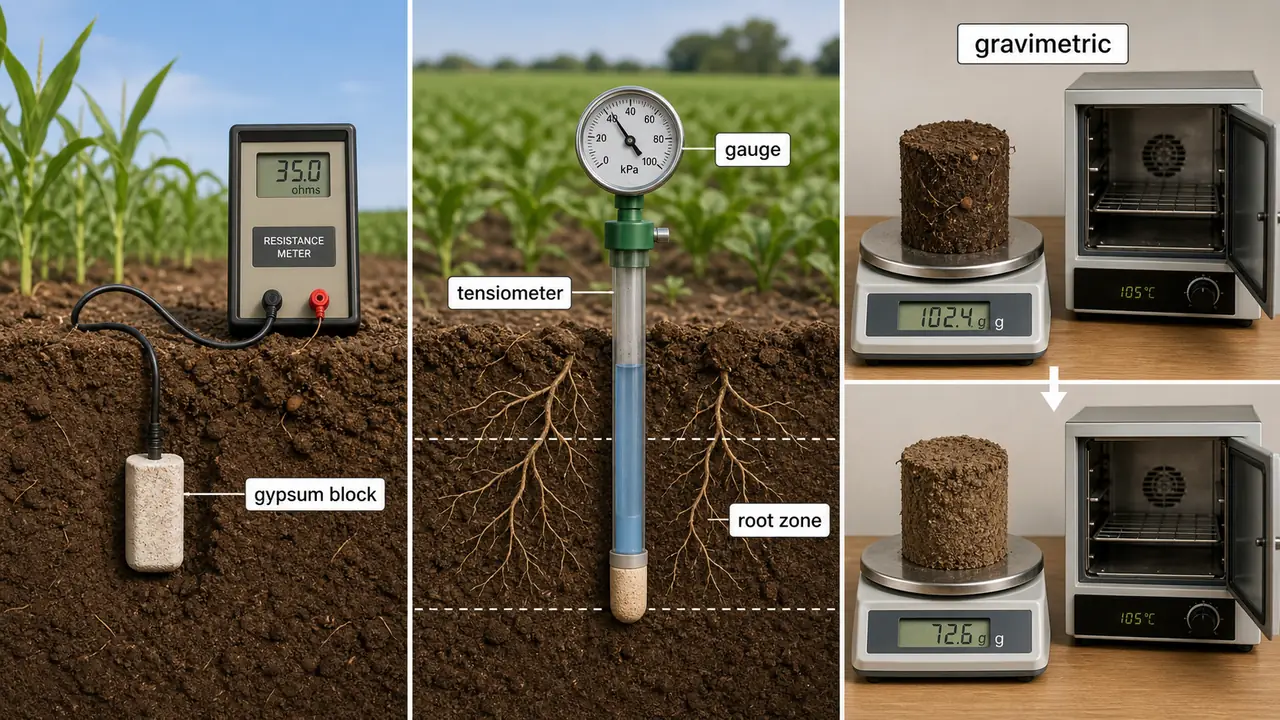
Instruments for Determining Soil Moisture
| Instrument | How It Works | Advantage | Agricultural Example |
|---|---|---|---|
| Gypsum block | Electrical resistance device buried in soil; resistance changes with moisture | Inexpensive, continuous monitoring | Used in orchards for long-term monitoring |
| Tensiometer | Directly measures soil moisture tension | Shows how hard plants must work to extract water | Vegetable farmers in peri-urban areas use tensiometers at 30 cm depth |
| Gravimetric method | Weigh soil sample before and after oven drying | Most accurate method (gold standard) | Research stations use this to calibrate other instruments |
Agricultural example: A progressive farmer in Madhya Pradesh installs tensiometers at 30 cm depth in his wheat field. When the reading reaches 0.5 bar, he knows it is time to irrigate -- no guesswork needed.
TIP
Exam mnemonic -- "GTG" for soil moisture instruments: Gypsum block (electrical resistance), Tensiometer (tension/suction), Gravimetric (weight). Gravimetric is the gold standard for accuracy but is destructive (you must remove and dry the soil sample).
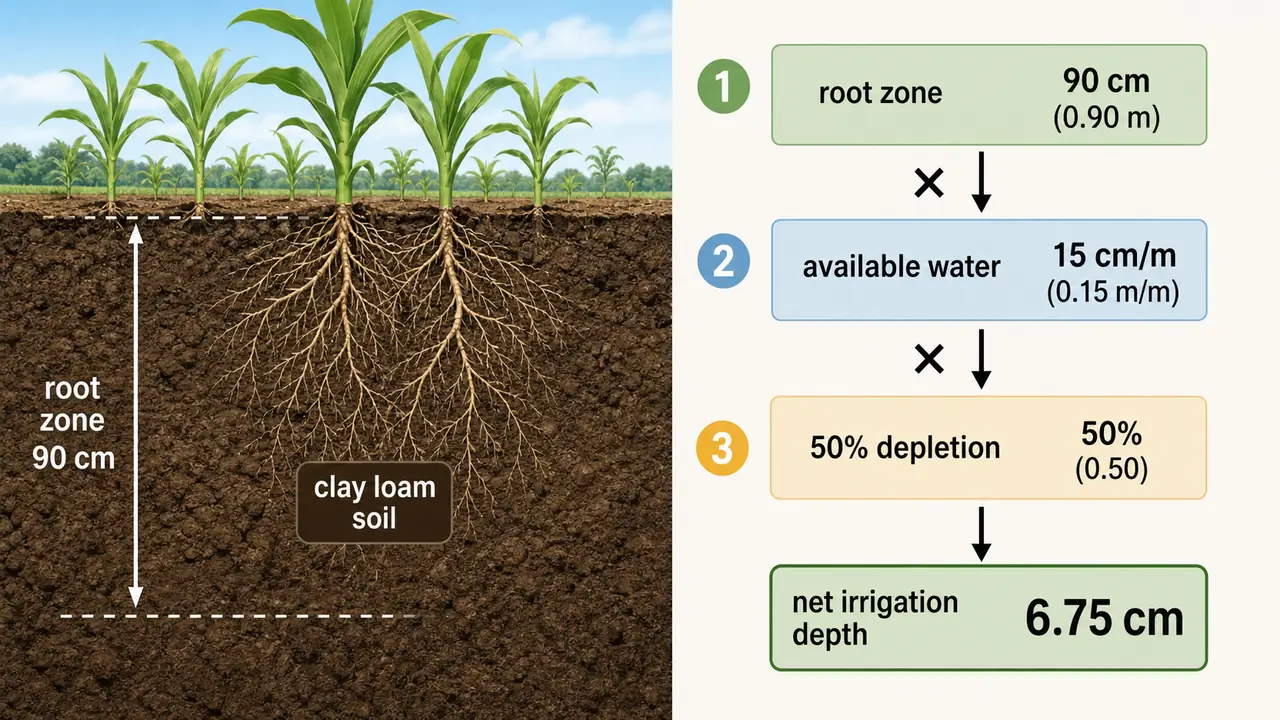
How Much to Irrigate
- The net quantity of water to be applied
- Goal: bring soil moisture back to field capacity without causing deep percolation losses
- Depends on: soil type, root zone depth, and current soil moisture deficit
Calculation example: In a cotton field on clay loam soil with 90 cm root depth, if available water is 15 cm/m and 50% has been depleted:
- Net irrigation depth = 0.90 m x 15 cm/m x 0.50 = 6.75 cm
Agricultural example: A wheat farmer with 60 cm root zone on sandy loam (available water = 12 cm/m) at 50% depletion needs: 0.60 x 12 x 0.50 = 3.6 cm of irrigation. The sandy loam needs more frequent but lighter irrigations compared to the clay loam cotton field above.
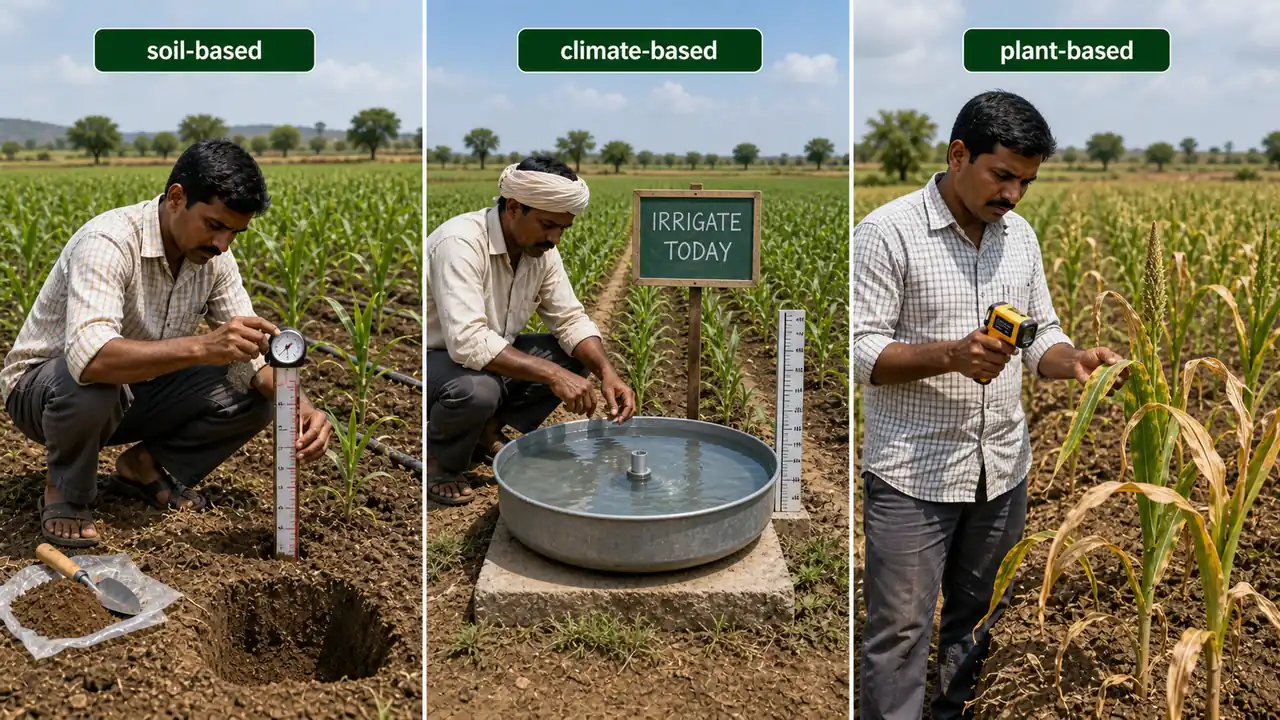
Three Scientific Approaches to Scheduling
| Approach | Basis | Key Method | Best For |
|---|---|---|---|
| Soil Moisture Depletion | Monitor actual soil moisture | Tensiometer, gravimetric | Precision farming, research |
| Climatological (IW/CPE) | Atmospheric water demand | IW/CPE ratio using pan evaporation | Practical field use, extension (most widely used) |
| Plant-based | Plant stress indicators | Leaf water potential, canopy temperature | Research, high-value crops |
TIP
Exam tip: Among the three approaches, IW/CPE (climatological) is the most practical and most widely used in India. This is a very commonly asked question.
1. Soil Moisture Depletion Approach

Based on monitoring actual soil moisture and irrigating when it drops to a predetermined level.
- Available soil moisture range: field capacity (-1/3 bar) to wilting point (-15 bar)
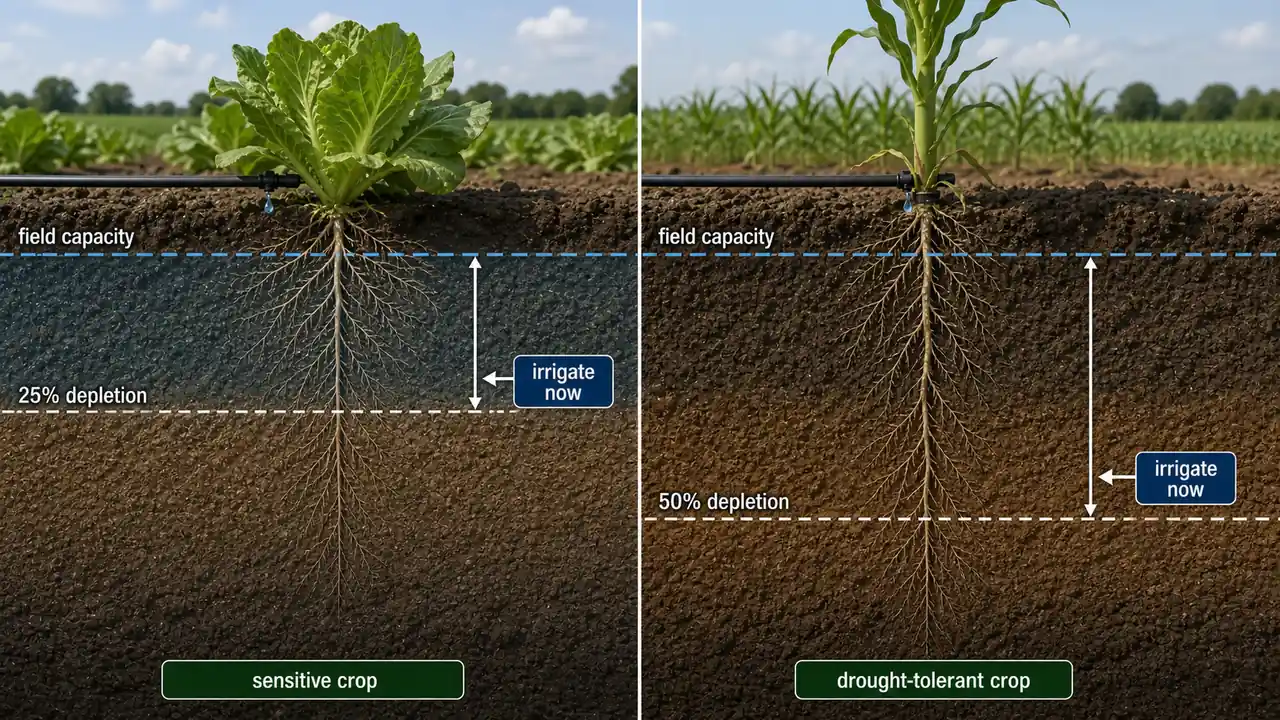
- Irrigation trigger levels differ by crop type:
| Crop Type | Depletion Level | Examples | Reason |
|---|---|---|---|
| Moisture-sensitive crops | 25% depletion | Wheat, Rice, Maize | Cannot tolerate much stress |
| Drought-resistant crops | 50% depletion | Sorghum, Bajra, Cotton | Tolerate more moisture loss |
- Tensiometer irrigation trigger: 0.85 bar at a specific depth
- Experienced farmers gauge moisture by feel and appearance -- squeezing soil and observing texture and colour
Agricultural example: For irrigated rice in Tamil Nadu, irrigation is scheduled when soil moisture reaches 25% depletion -- roughly every 3-4 days during the vegetative phase, ensuring the crop is never seriously stressed.
TIP
Exam mnemonic -- "25-50 Rule": Sensitive crops (rice, wheat, maize) at 25% depletion; drought-resistant crops (sorghum, bajra, cotton) at 50% depletion. Sensitive crops get irrigated more frequently.
2. Climatological Approach -- IW/CPE Ratio
This is the most practical and widely used method for scheduling irrigation in India.
How It Works
- Based on the relationship between crop evapotranspiration and pan evaporation
- IW/CPE ratio = Irrigation Water (IW) applied / Cumulative Pan Evaporation (CPE)
- Pan evaporation values are added daily until CPE reaches a level that triggers irrigation
- IW/CPE ratios are determined experimentally using lysimeter studies (containers of soil measuring actual water use by plants)
- Determined under ICAR Coordinated Project for Research on Water Management
Practical Application
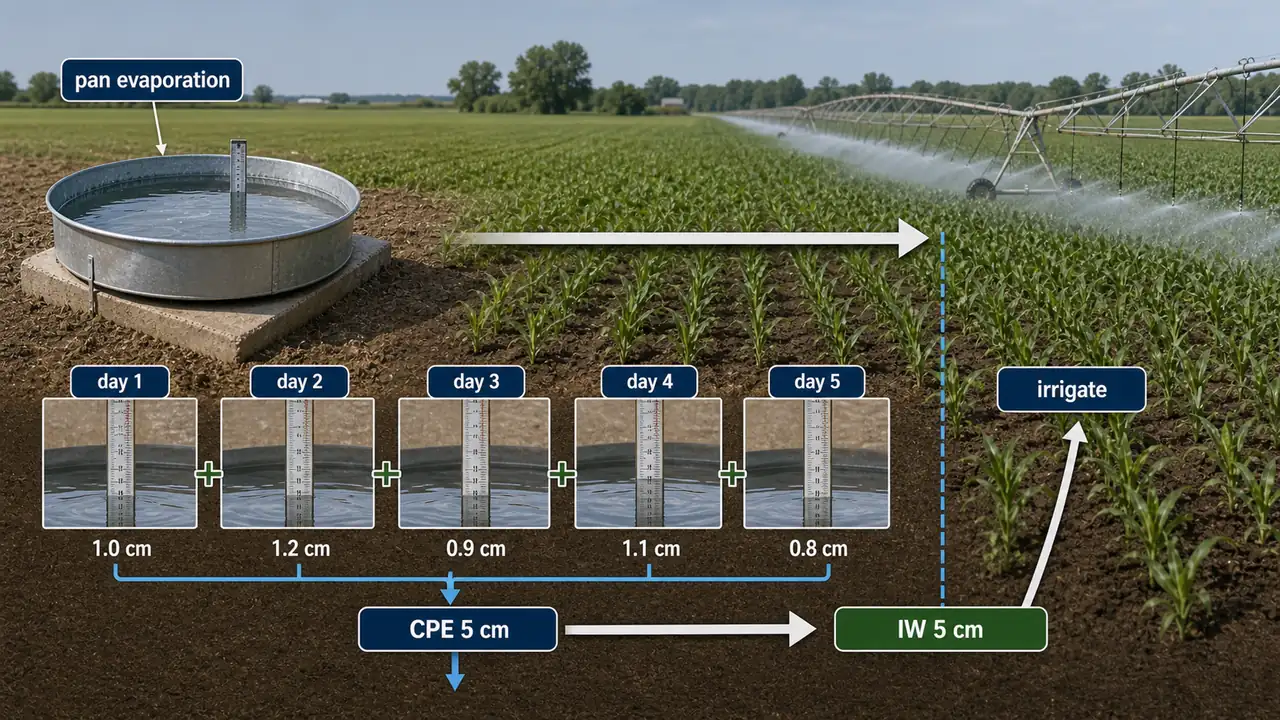
A fixed amount of irrigation water (usually 4--6 cm, most commonly 5 cm) is applied when CPE reaches a predetermined level.
Step-by-step example:
- IW/CPE ratio = 1.0 with IW = 5 cm
- Daily pan evaporation readings: Day 1 = 0.8 cm, Day 2 = 1.0 cm, Day 3 = 0.9 cm, Day 4 = 1.1 cm, Day 5 = 1.2 cm
- Cumulative: 0.8 + 1.0 + 0.9 + 1.1 + 1.2 = 5.0 cm (= IW/1.0)
- On Day 5, CPE reaches 5 cm, so apply 5 cm of irrigation water
- A lower ratio (e.g., 0.6) means irrigating less frequently -- suitable for drought-tolerant crops
| IW/CPE Ratio | Meaning | Suitable For | Agricultural Example |
|---|---|---|---|
| 0.6 | Irrigate when CPE = 8.3 cm (for 5 cm IW) | Drought-tolerant crops (sorghum, bajra) | Sorghum in Marathwada irrigated every 10-12 days |
| 0.8 | Irrigate when CPE = 6.25 cm | Moderately sensitive crops | Groundnut in Gujarat |
| 1.0 | Irrigate when CPE = 5 cm | Sensitive crops (wheat, rice) | Wheat in north India irrigated every 5-7 days in summer |
IMPORTANT
Why IW/CPE is popular: It is simple, rapid, reliable, and has high extension value. Pan evaporimeters are widely available and easy to maintain -- any farmer can use this method with basic training.
Agricultural example: At an ICAR research station, wheat in north India is scheduled at IW/CPE = 0.9 with 6 cm irrigation depth. On a day when CPE reaches 6.67 cm, the farmer irrigates with 6 cm water. This approach has consistently produced yields within 5% of the maximum achievable.
TIP
Exam tip -- IW/CPE calculation shortcut: To find when to irrigate, divide IW by the ratio. For IW = 5 cm and ratio = 0.8: CPE trigger = 5/0.8 = 6.25 cm. A higher ratio means more frequent irrigation (less CPE needed to trigger).
3. Plant-Based Approach
Uses the plant itself as a sensor for water stress. Any plant character that responds to soil water deficit can serve as a criterion.
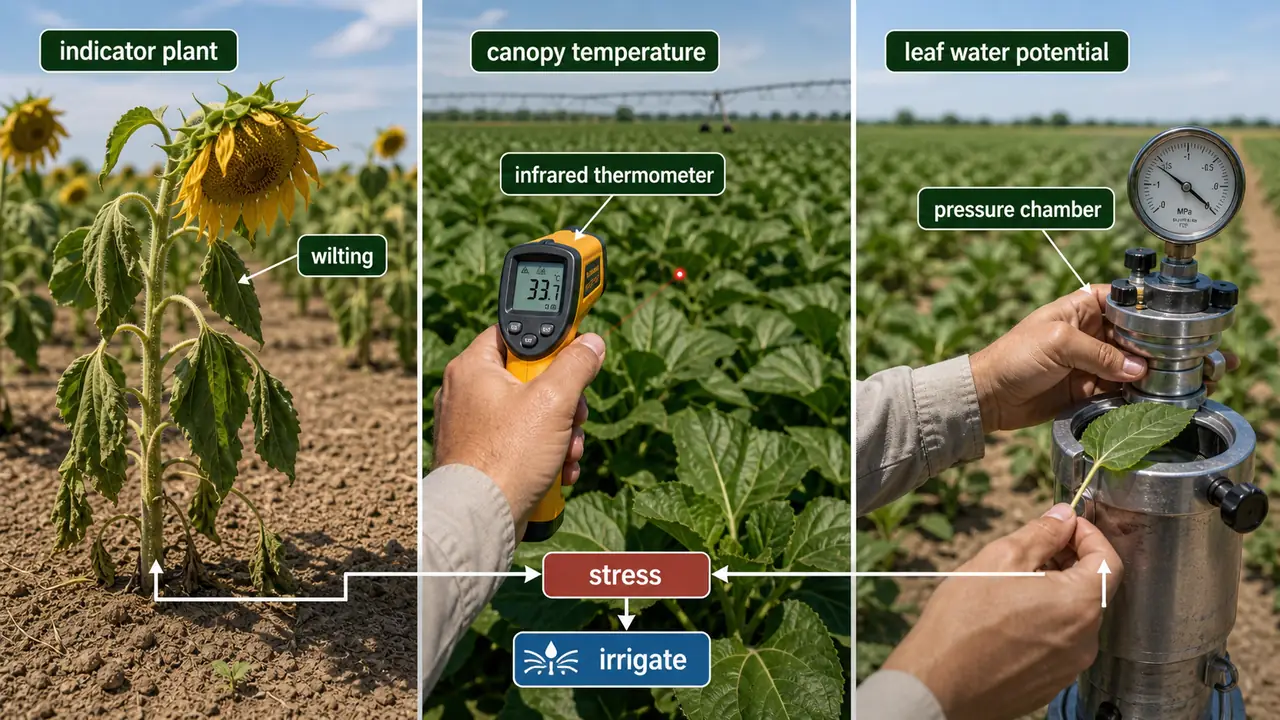
| Method | What It Measures | How | Agricultural Example |
|---|---|---|---|
| Indicator plant | Visible wilting or colour change | Sunflower used as sentinel (shows wilting readily) | Sunflower planted at field edge wilts before main crop |
| Relative water content | Leaf water vs full turgidity | Laboratory measurement | Used in drought-stress research at CRIDA |
| Leaf water potential | Energy status of leaf water | Pressure chamber (Scholander bomb) | High-value fruit crops at research stations |
| Plant/canopy temperature | Stressed plants are hotter | Infrared thermometers | Grape vineyards in Nashik |
| Cell elongation rate | Growth slows under stress | Specialized sensors | Maize growth monitoring in controlled environments |
| Computer modelling | Integrates weather, soil, crop data | Software-based prediction | Large irrigation projects using DSS tools |
Agricultural example: In a high-value grape vineyard in Nashik, infrared thermometers measure canopy temperature. When canopy temperature exceeds air temperature by more than 2 degrees C, the drip system is activated -- ensuring precision irrigation for premium wine grapes.
NOTE
Plant-based methods require extensive research, expensive equipment, and standardization, limiting adoption by smallholder farmers. They are most valuable in research settings and high-value crop production.
Comparison of the Three Approaches
| Feature | Soil Moisture Depletion | IW/CPE (Climatological) | Plant-Based |
|---|---|---|---|
| What is measured | Soil moisture content/tension | Atmospheric evaporative demand | Plant stress indicators |
| Equipment needed | Tensiometer, gypsum block, oven | Pan evaporimeter (USWB Class A) | Pressure chamber, IR thermometer |
| Cost | Low-Moderate | Low | High |
| Ease of use | Moderate | Easiest (most practical) | Difficult |
| Accuracy | High (gravimetric is most accurate) | Good for field conditions | Very high (but crop-specific) |
| Adoption by farmers | Limited | Widely adopted | Very limited (research/high-value only) |
| Key instrument | Tensiometer | Lysimeter (for determining ratios) | Infrared thermometer |
Key Irrigation Scheduling Terms
| Term | Definition | Agricultural Detail |
|---|---|---|
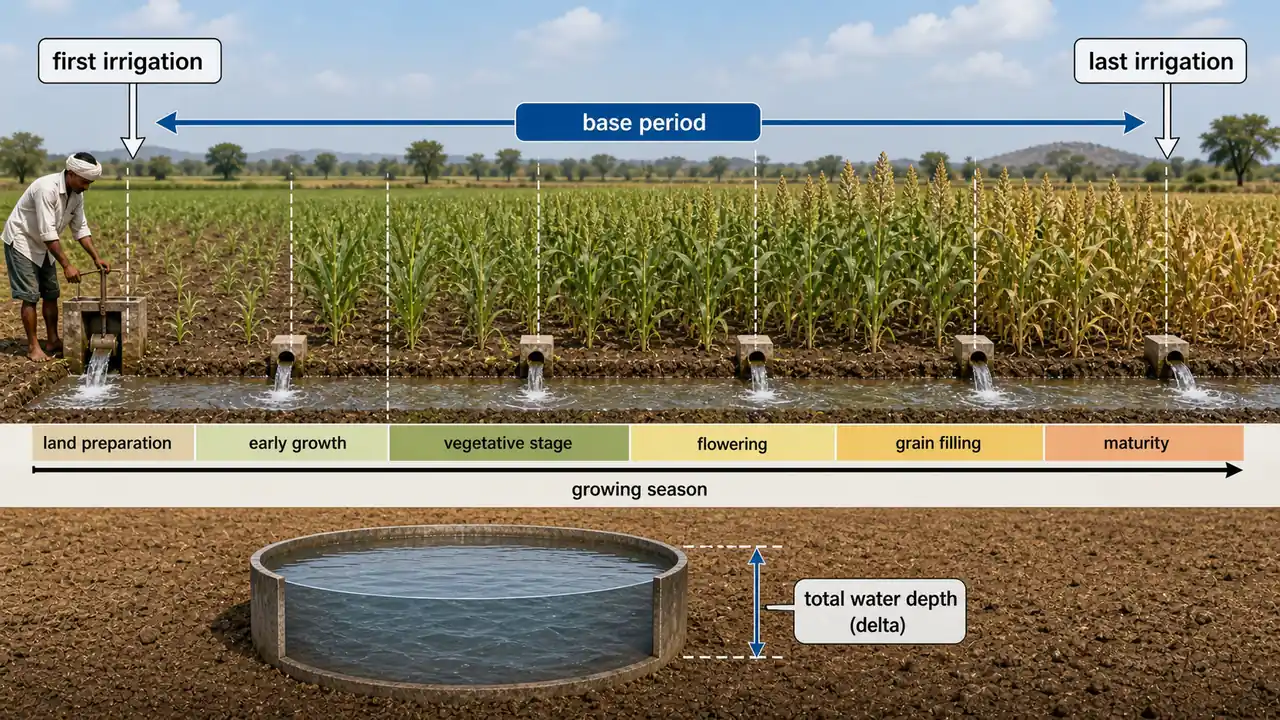
| Delta of Water | Total depth of irrigation water needed for the entire crop period | Varies by crop: rice ~120 cm, wheat ~40 cm, sugarcane ~200 cm |
| Base Period | Number of days from first watering (before sowing) to last watering (before harvest) | Determines the duty of canal water; longer base period = lower duty |
TIP
Exam fact: Duty and Delta are inversely related — a crop with higher delta (more water needed) has lower duty (irrigates less area per unit discharge). Duty = 8.64 × Base Period / Delta.
Summary Table
| Topic | Key Point |
|---|---|
| Irrigation Scheduling | Determines when and how much to irrigate |
| Purpose | Apply exact water needed; avoid over- and under-irrigation |
| Optimal timing | At 50% soil moisture depletion in root zone |
| Soil moisture instruments | Gypsum block (electrical), Tensiometer (tension), Gravimetric (most accurate) |
| Soil depletion approach | 25% depletion for sensitive crops (rice, wheat); 50% for drought-resistant (sorghum, bajra) |
| Tensiometer trigger | 0.85 bar |
| Field capacity tension | -1/3 bar |
| Wilting point tension | -15 bar |
| IW/CPE ratio | Most practical method in India; 5 cm IW is most common |
| IW/CPE = 1.0 | Irrigate when CPE = IW (e.g., 5 cm CPE triggers 5 cm irrigation) |
| Higher IW/CPE ratio | More frequent irrigation (for sensitive crops) |
| Lower IW/CPE ratio | Less frequent irrigation (for drought-tolerant crops) |
| Lysimeter | Container used to measure actual crop water use (determines IW/CPE ratios) |
| Plant approach | Uses wilting, leaf potential, canopy temperature as indicators |
| Indicator plant | Sunflower (wilts readily) used as sentinel |
| Infrared thermometer | Measures canopy temperature; stressed plants are hotter than air |
| Plant methods limitation | Expensive, need standardization; best for research and high-value crops |
| ICAR project | Coordinated Project for Research on Water Management (determines IW/CPE ratios) |
Summary Cheat Sheet
| Concept / Topic | Key Details |
|---|---|
| Irrigation scheduling | Determines when and how much to irrigate |
| Optimal timing | At 50% soil moisture depletion in root zone |
| Gravimetric method | Most accurate soil moisture measurement |
| Tensiometer trigger | 0.85 bar |
| Field capacity tension | -1/3 bar |
| Wilting point tension | -15 bar |
| IW/CPE ratio | Most practical method in India; 5 cm IW most common |
| IW/CPE = 1.0 | Irrigate when CPE = IW (5 cm CPE triggers 5 cm irrigation) |
| Higher IW/CPE | More frequent irrigation (sensitive crops) |
| Lower IW/CPE | Less frequent (drought-tolerant crops) |
| Lysimeter | Container measuring actual crop water use |
| Indicator plant | Sunflower (wilts readily) — used as sentinel |
| Infrared thermometer | Measures canopy temperature; stressed plants are hotter |
| 25% depletion | For sensitive crops (rice, wheat) |
| 50% depletion | For drought-resistant crops (sorghum, bajra) | | IW/CPE concept by | Parihar | | Delta of Water | Total depth of water for entire crop period (rice ~120 cm, wheat ~40 cm) | | Base Period | Days from first to last watering — determines duty of canal water | | Duty vs Delta | Inversely related — higher delta = lower duty |
TIP
Next: Lesson 04 covers Crop Water Requirement -- the actual water needs of major Indian crops (rice, wheat, sugarcane, cotton, pulses), their critical irrigation stages, and water use efficiency concepts.