📊 Livestock Production Parameters - Milk, Egg, Meat and Wool Production in India
Key production statistics from DAHD 2026 covering India's milk production (1st globally, 247.87 MT), egg production (149.11 billion, 2nd globally), meat production (10.50 MT, 4th globally), wool production, per capita availability, state-wise rankings for IBPS AFO, NABARD Grade A, and FCI exams.
In the previous lesson, we learned that livestock contributes 5.5% to India's GVA and 31% to Agricultural GVA. But where does this value come from? The answer lies in four Major Livestock Products (MLPs) — milk, eggs, meat, and wool. The livestock sector's GVA has surged by nearly 195% from 2014-15 to 2023-24, significantly outpacing the crop sector. Total exports of livestock products reached ₹66,249 crore in 2024-25, driven largely by bovine meat and edible offal. Agriculture, Forestry and Fishing as a whole (crop sector + livestock + forestry + fisheries) contributes 17.8% to the total national GVA in 2023-24.
The Government tracks livestock production through two major statistical exercises:
- Livestock Census — conducted every 5 years; provides comprehensive data on livestock and poultry numbers
- Integrated Sample Survey (ISS) — conducted annually by DAHD; provides estimates of Major Livestock Products (MLPs), i.e., milk, egg, meat & wool
Understanding these production parameters is essential not just for exams, but for appreciating the real economic weight of each livestock species.
NOTE
All figures are from Basic Animal Husbandry Statistics 2025, DAHD, Ministry of Fisheries, Animal Husbandry & Dairying, Government of India (Released: 26.11.2025). World rankings are based on FAO data (2023).
Major Livestock Products — At a Glance
| Item | 2023-24 | 2024-25 | Y-o-Y Growth (%) |
|---|---|---|---|
| Milk Production (million tonnes) | 239.30 | 247.87 | 3.58 |
| Per Capita Milk (g/day) | 471 | 485 | 2.97 |
| Egg Production (billion nos.) | 142.77 | 149.11 | 4.44 |
| Per Capita Egg (nos./annum) | 103 | 106 | 2.91 |
| Meat Production (million tonnes) | 10.25 | 10.50 | 2.46 |
| Per Capita Meat (kg/annum) | 7.39 | 7.51 | 1.62 |
| Wool Production (million kg) | 33.69 | 34.57 | 2.63 |
Y-o-Y: Year on Year Growth (Percentage)
Milk — India's Strongest Sector
India's journey from a milk-deficient nation (1950s) to the world's largest milk producer is one of the greatest agricultural success stories — largely driven by the White Revolution and the cooperative dairy movement (AMUL model). Today, India's milk sector is a global benchmark.
- India ranks 1st in milk production globally, contributing 25% of world milk output (FAO, 2023).
- India is also the world's largest consumer of milk, driven by its large vegetarian population that relies on dairy for protein.
- Total milk production: 247.87 million tonnes (2024-25), up from 239.30 MT in 2023-24. Year-on-year growth: 3.58%.
- Per capita availability: 485 gm/day — nearly double the ICMR recommended intake of 250 gm/day. This means India is not just self-sufficient in milk — it has a nutritional surplus.
The Indian Council of Medical Research (ICMR) sets dietary recommendations for Indians. When our per capita exceeds ICMR norms, it reflects genuine food security in that product.
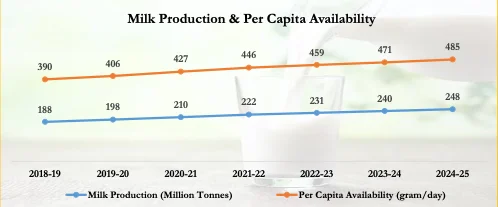
Milk Production Trend (2018-19 to 2024-25)
| Year | Milk Production (Million Tonnes) | Per Capita Availability (g/day) |
|---|---|---|
| 2018-19 | 188 | 390 |
| 2019-20 | 198 | 406 |
| 2020-21 | 210 | 427 |
| 2021-22 | 222 | 446 |
| 2022-23 | 231 | 459 |
| 2023-24 | 240 | 471 |
| 2024-25 | 248 | 485 |
*Based on Projected Human Population according to Population Census-2011
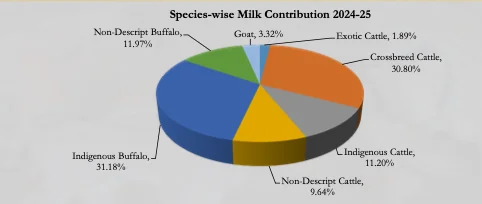
Species-Wise Milk Contribution
Why Do Buffalo and Crossbreed Cattle Dominate Milk?
| Species | Contribution | Why |
|---|---|---|
| Indigenous Buffalo | 31.18% | Higher fat content (6–8%), adapted to Indian conditions, Murrah breed highly productive |
| Crossbreed Cattle | 30.80% | HF/Jersey crosses have 2–3× higher yield than indigenous cattle |
| Non-Descript Buffalo | 11.97% | Large population, moderate yield |
| Indigenous Cattle | 11.20% | Large numbers but low per-animal yield (~987 kg/lactation vs world avg 2038 kg) |
| Non-Descript Cattle | 9.64% | Similar to indigenous cattle issue |
| Goat | 3.32% | Valuable for rural poor; "poor man's cow" |
| Exotic Cattle | 1.89% | Small population, high yield per animal |
The dominance of indigenous buffalo reflects India's unique bovine composition — over 57% of the world's buffalo population lives in India. The rapid rise of crossbreed cattle shows the impact of artificial insemination and breed improvement programmes.
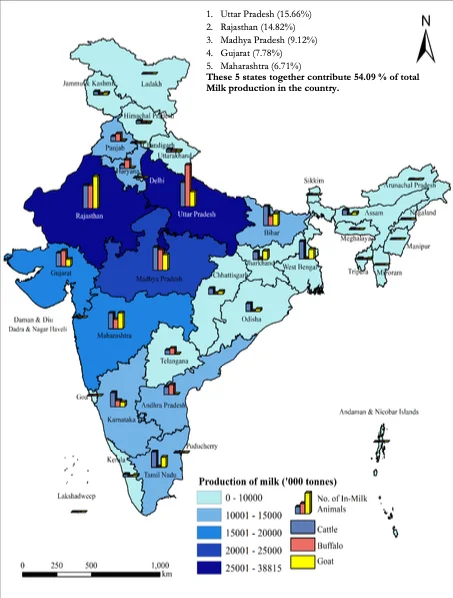
Top Milk Producing States (2024-25)
| Rank | State | Share | Why They Lead |
|---|---|---|---|
| 1 | Uttar Pradesh | 15.66% | Largest bovine population, strong cooperative network |
| 2 | Rajasthan | 14.82% | Large cattle & buffalo herds, pastoral communities |
| 3 | Madhya Pradesh | 9.12% | Large rural livestock base |
| 4 | Gujarat | 7.78% | AMUL cooperative model, high productivity |
| 5 | Maharashtra | 6.71% | Large dairy industry around Pune & Mumbai |
These 5 states contribute 54.09% of total milk production. Punjab leads in per capita milk availability — it has a relatively small human population but an extremely high dairy animal density with a well-developed cooperative network.
Egg — Rapid Growth, Southern Dominance
India's poultry sector has undergone a quiet revolution over the last two decades. The shift from backyard poultry to large-scale commercial operations has made India the world's 2nd largest egg producer.
- India ranks 2nd globally in egg production (Source: FAO, 2023). China leads with 37% of world production; India contributes 8%.
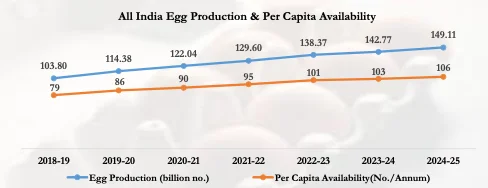
- Total egg production: 149.11 billion numbers (2024-25), up from 142.77 billion in 2023-24. Growth: 4.44% year-on-year — the fastest growing MLP.
- Per capita availability: 106 eggs/annum (2024-25) — still significantly below the ICMR recommendation of 180 eggs/annum. This gap represents a major opportunity for the sector.
- Commercial poultry contributed 84.49% of total eggs.
Egg Production Trend (2018-19 to 2024-25)
| Year | Egg Production (Billion nos.) | Per Capita Availability (nos./annum) |
|---|---|---|
| 2018-19 | 103.80 | 79 |
| 2019-20 | 114.38 | 86 |
| 2020-21 | 122.04 | 90 |
| 2021-22 | 129.60 | 95 |
| 2022-23 | 138.37 | 101 |
| 2023-24 | 142.77 | 103 |
| 2024-25 | 149.11 | 106 |
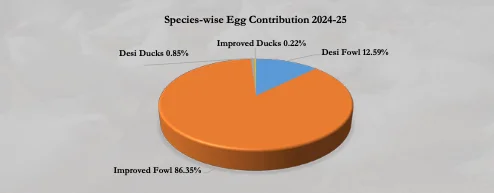
Species-Wise Egg Contribution
Why Does Improved Fowl Dominate?
| Species | Contribution | Reason |
|---|---|---|
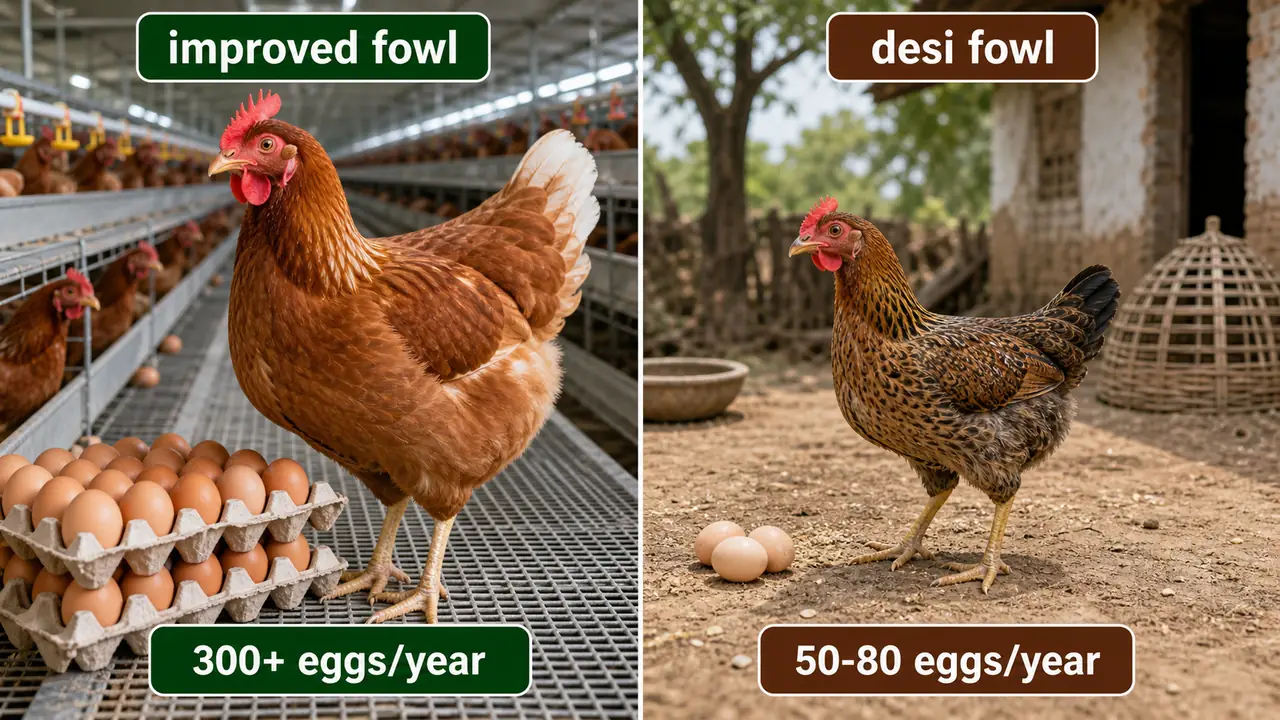
| Improved Fowl | 86.35% | Commercial breeds (White Leghorn) lay 300+ eggs/year vs Desi Fowl's 50–80 eggs/year |
| Desi Fowl | 12.59% | Backyard poultry — important for rural nutritional security |
| Desi Ducks | 0.85% | Niche, mainly in Bengal & Kerala |
| Improved Ducks | 0.22% | Very limited commercial scale |
Improved Fowl = White Leghorn, Rhode Island Red, and their hybrid crosses. Their genetic selection for high egg production is the primary driver of India's egg output growth.
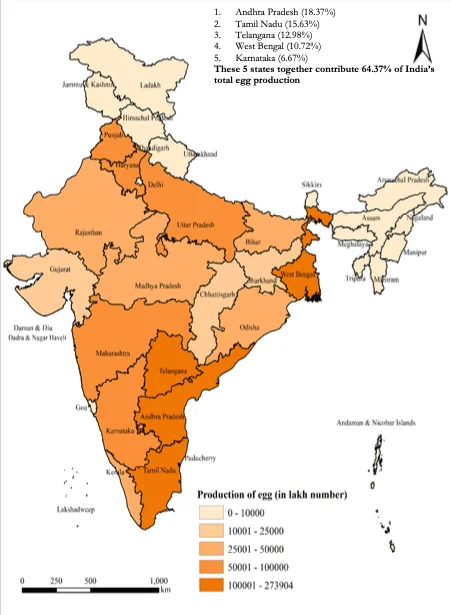
Top Egg Producing States (2024-25)
| Rank | State | Share |
|---|---|---|
| 1 | Andhra Pradesh | 18.37% |
| 2 | Tamil Nadu | 15.63% |
| 3 | Telangana | 12.98% |
| 4 | West Bengal | 10.72% |
| 5 | Karnataka | 6.67% |
These 5 states contribute 64.37% of India's total egg production. Southern states dominate because of a cluster effect — abundant maize (corn feed) supply, favourable climate avoiding extreme cold, large processing/export infrastructure, and deep market linkages built over decades.
Meat — Poultry Leads, Cattle Lags
India's meat sector is shaped by both economic factors (poultry has the best Feed Conversion Ratio) and cultural factors (cattle slaughter restrictions limit beef contribution to just 2%).
- India ranks 4th globally in total meat production (Source: FAO, 2023) — China (27%) > USA (13%) > Brazil (9%) > India (3%).
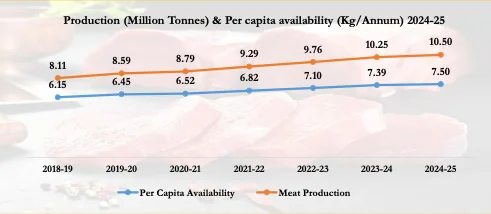
- Total meat production: 10.50 million tonnes (2024-25), up from 10.25 MT in 2023-24. Growth: 2.46% year-on-year.
- Per capita availability of meat: 7.51 kg/annum (2024-25). India's per capita meat consumption is low compared to global averages but steadily rising with urbanisation.
- Abattoir: A slaughterhouse — a facility where livestock are slaughtered and processed into meat under food safety standards.
Meat Production Trend (2018-19 to 2024-25)
| Year | Meat Production (Million Tonnes) | Per Capita Availability (kg/annum) |
|---|---|---|
| 2018-19 | 8.11 | 6.15 |
| 2019-20 | 8.59 | 6.45 |
| 2020-21 | 8.79 | 6.52 |
| 2021-22 | 9.29 | 6.82 |
| 2022-23 | 9.76 | 7.10 |
| 2023-24 | 10.25 | 7.39 |
| 2024-25 | 10.50 | 7.51 |
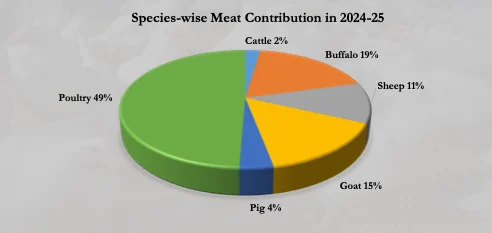
Species-Wise Meat Contribution
Why Does Poultry Dominate Meat?
| Species | Contribution | Reason |
|---|---|---|
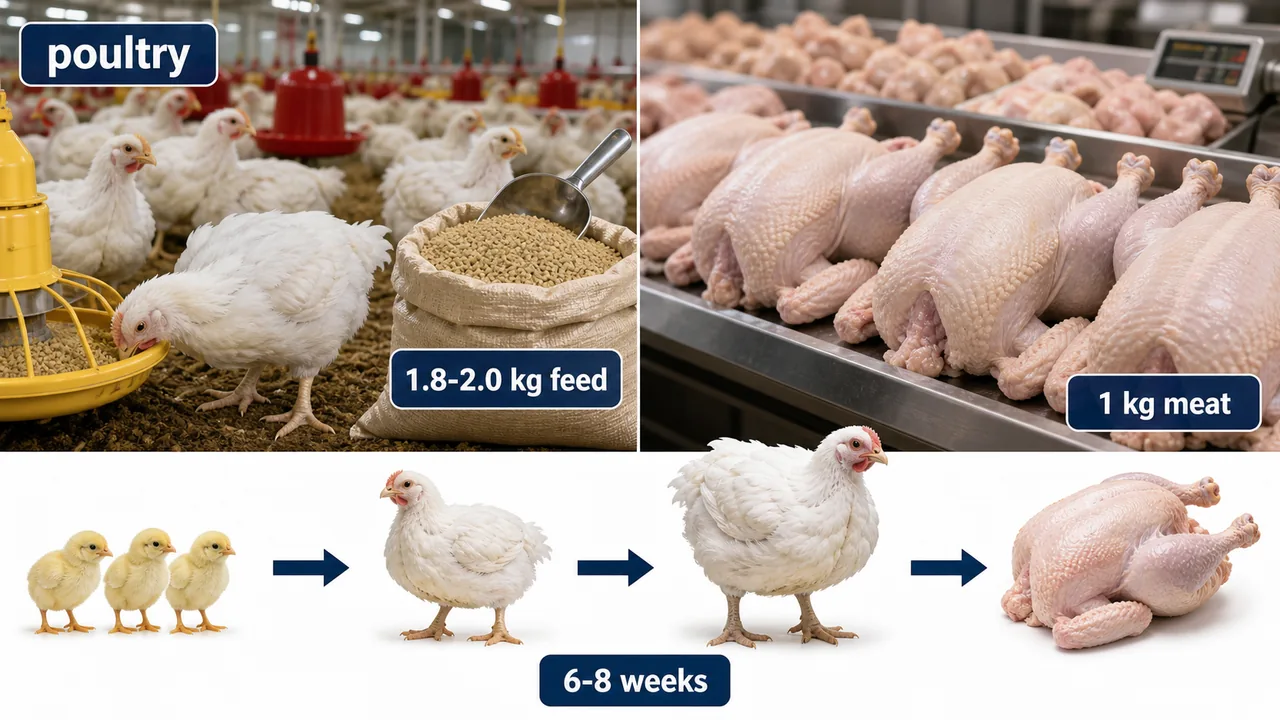
| Poultry | 49% | Best FCR (1.8–2.0 kg feed per kg meat), fastest growth (6–8 weeks), cheapest protein source |
| Buffalo | 19% | Water buffalo exported as "carabeef"; bovine meat is largest export earner |
| Goat | 15% | High demand for chevon (goat meat); no religious restrictions |
| Sheep | 11% | Mutton demand especially in North India |
| Pig | 4% | Growing piggery sector in NE India |
| Cattle | 2% | Low due to legal restrictions on cow slaughter in most Indian states |
Cattle contributing only 2% despite India having one of the world's largest cattle populations is a direct reflection of legal and cultural protection of the cow in India.
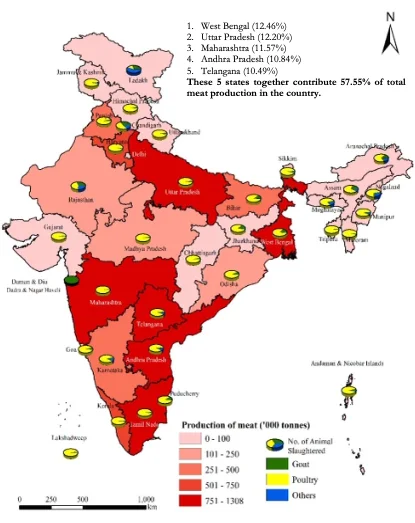
Top Meat Producing States (2024-25)
| Rank | State | Share |
|---|---|---|
| 1 | West Bengal | 12.46% |
| 2 | Uttar Pradesh | 12.20% |
| 3 | Maharashtra | 11.57% |
| 4 | Andhra Pradesh | 10.84% |
| 5 | Telangana | 10.49% |
These 5 states contribute 57.55% of total meat production. West Bengal's 1st rank reflects its high fish-and-meat consumption culture and large poultry industry.
Wool — A Declining but Regionally Important Sector
Wool is the only MLP where production growth has been sluggish — challenged by competition from synthetic fibres, changing shepherd livelihoods, and declining sheep populations in some regions. However, it remains economically vital for pastoral communities.
- Total wool production: 34.57 million kg (2024-25), up 2.63% from 33.69 million kg in 2023-24 — a welcome recovery after years of negative growth.
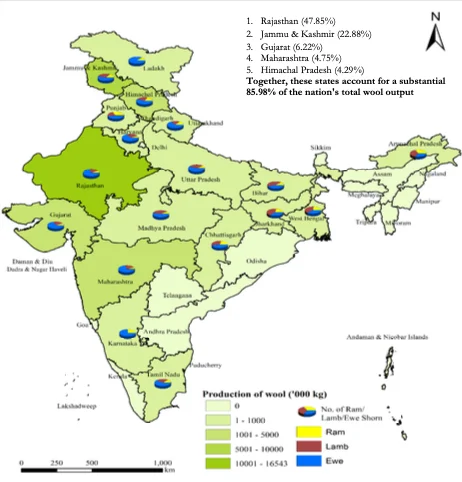
Top Wool Producing States (2024-25)
| Rank | State | Share | Why They Lead |
|---|---|---|---|
| 1 | Rajasthan | 47.85% | Largest sheep population; carpet-wool breeds (Magra, Chokla, Marwari) suit arid terrain |
| 2 | Jammu & Kashmir | 22.88% | Famous for Pashmina (Cashmere) fine wool from Changthangi goat & Rampur Bushair sheep |
| 3 | Gujarat | 6.22% | Pastoral Rabari communities; Patanwadi & Marwari breeds |
| 4 | Maharashtra | 4.75% | Deccani sheep in semi-arid Marathwada region |
| 5 | Himachal Pradesh | 4.29% | High-altitude sheep farming; Rampur Bushair breed |
These 5 states account for 85.98% of India's total wool output.
India in the World (FAO, 2023)
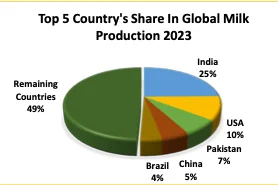
Top 5 Countries — Global Milk Production (2023)
| Rank | Country | Share (%) |
|---|---|---|
| 1 | India | 25 |
| 2 | USA | 10 |
| 3 | Pakistan | 7 |
| 4 | China | 5 |
| 5 | Brazil | 4 |
| — | Remaining Countries | 49 |
India leads globally with 25% of world milk production — more than double the next country (USA at 10%).
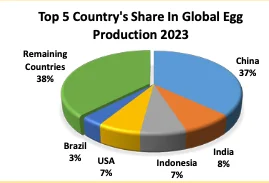
Top 5 Countries — Global Egg Production (2023)
| Rank | Country | Share (%) |
|---|---|---|
| 1 | China | 37 |
| 2 | India | 8 |
| 3 | Indonesia | 7 |
| 4 | USA | 7 |
| 5 | Brazil | 3 |
| — | Remaining Countries | 38 |
China alone produces 37% of the world's eggs. India at 8% is firmly 2nd — note that Indonesia and USA are very close behind at 7% each.
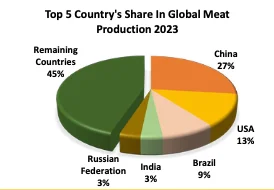
Top 5 Countries — Global Meat Production (2023)
| Rank | Country | Share (%) |
|---|---|---|
| 1 | China | 27 |
| 2 | USA | 13 |
| 3 | Brazil | 9 |
| 4 | India | 3 |
| 5 | Russian Federation | 3 |
| — | Remaining Countries | 45 |
India's low 3% share despite 4th rank reflects both the scale of global meat production and domestic cultural/legal restrictions on cattle slaughter.
Source: Food and Agriculture Organization (FAO), United Nations
How These Products Connect to India's Economy
These four Major Livestock Products together explain the 5.5% GVA and 31% of agricultural GVA discussed in the previous lesson:
- Milk is the single largest contributor — India's ₹10+ lakh crore dairy economy
- Eggs & Meat (Poultry) are the fastest-growing segments — driving rural youth employment
- Bovine meat exports (buffalo) earned ₹66,249 crore in 2024-25
- Wool supports the livelihoods of millions of nomadic and pastoral communities
References
5 sources • [1] [2] [3] [4] [5]
References
Summary Cheat Sheet
Overview & Framework
| Concept / Topic | Key Details |
|---|---|
| Livestock GVA growth | Nearly 195% from 2014-15 to 2023-24 — outpaced crop sector |
| Livestock exports | ₹66,249 crore in 2024-25 (mainly bovine meat & edible offal) |
| Agriculture + Forestry + Fishing | 17.8% of national GVA (2023-24) |
| Livestock Census | Conducted every 5 years — counts all livestock & poultry |
| ISS (Integrated Sample Survey) | Conducted annually by DAHD — estimates MLPs (Milk, Egg, Meat, Wool) |
| MLPs | Major Livestock Products: Milk, Egg, Meat, Wool |
| Abattoir | A licensed slaughterhouse for processing livestock into meat under food safety standards |
🥛 Milk
| Concept / Topic | Key Details |
|---|---|
| Global rank | 1st — India produces 25% of world milk; USA 10%, Pakistan 7%, China 5%, Brazil 4% (FAO 2023) |
| Production (2024-25) | 247.87 million tonnes ↑ 3.58% (from 239.30 MT in 2023-24) |
| Per capita availability | 485 gm/day — nearly double ICMR recommended 250 gm/day (India has a nutritional surplus) |
| Top species (1st) | Indigenous Buffalo — 31.18% (fat 6–8%, Murrah breed; India has 57% of world's buffalo) |
| Top species (2nd) | Crossbreed Cattle — 30.80% (HF/Jersey crosses, 2–3× yield of indigenous) |
| Other species | Non-Descript Buffalo 11.97% → Indigenous Cattle 11.20% → Non-Descript Cattle 9.64% → Goat 3.32% → Exotic 1.89% |
| Top milk state | Uttar Pradesh (15.66%) > Rajasthan (14.82%) > MP (9.12%) > Gujarat (7.78%) > Maharashtra (6.71%) |
| Top 5 states share | 54.09% of total milk production |
| Top per capita state | Punjab (high dairy density, small population, strong cooperative network) |
🥚 Egg
| Concept / Topic | Key Details |
|---|---|
| Global rank | 2nd — India produces 8%; China 37%, Indonesia 7%, USA 7%, Brazil 3% (FAO 2023) |
| Production (2024-25) | 149.11 billion nos. ↑ 4.44% — fastest-growing MLP |
| Per capita availability | 106 eggs/year — below ICMR recommended 180 eggs/year (gap = opportunity) |
| Commercial poultry share | 84.49% of total eggs from commercial operations |
| Top species | Improved Fowl — 86.35% (White Leghorn, 300+ eggs/year vs. Desi Fowl 50–80) |
| Other species | Desi Fowl 12.59% (backyard, rural nutrition) → Desi Ducks 0.85% → Improved Ducks 0.22% |
| Top egg state | Andhra Pradesh (18.37%) > Tamil Nadu (15.63%) > Telangana (12.98%) > WB (10.72%) > Karnataka (6.67%) |
| Top 5 states share | 64.37% of total egg production (southern dominance: maize feed, climate, infrastructure) |
🥩 Meat
| Concept / Topic | Key Details |
|---|---|
| Global rank | 4th — India 3%; China 27%, USA 13%, Brazil 9%, Russia 3% (FAO 2023) |
| Production (2024-25) | 10.50 million tonnes ↑ 2.46% |
| Per capita availability | 7.51 kg/annum (rising with urbanisation) |
| Top species | Poultry — 49% (FCR 1.8–2.0, market-ready in 6–8 weeks, cheapest protein) |
| Other species | Buffalo 19% (carabeef exports) → Goat 15% (chevon) → Sheep 11% → Pig 4% (NE India) |
| Cattle contribution | Only 2% — despite huge population; due to legal & cultural restrictions on cow slaughter |
| Top meat state | West Bengal (12.46%) > UP (12.20%) > Maharashtra (11.57%) > AP (10.84%) > Telangana (10.49%) |
| Top 5 states share | 57.55% of total meat production |
🧶 Wool
| Concept / Topic | Key Details |
|---|---|
| Production (2024-25) | 34.57 million kg ↑ 2.63% (recovery after years of sluggish growth) |
| Top wool state | Rajasthan (47.85%) — carpet-wool breeds: Magra, Chokla, Marwari |
| 2nd rank state | J&K (22.88%) — famous for Pashmina (from Changthangi goat, Ladakh's Changthang plateau) |
| Other states | Gujarat 6.22% → Maharashtra 4.75% → Himachal Pradesh 4.29% |
| Top 5 states share | 85.98% of total wool production |
Lesson Doubts
Ask questions, get expert answers