🧮 Agricultural Census in India -- 10th (2026-16) & 11th (2026-22) | Holdings, Fragmentation and Digital Census
Complete analysis of India's Agricultural Census covering 10th Census (146.45 million holdings, 1.08 ha avg) and the newly launched 11th Census 2026-22 (first digital census via smartphones/tablets). Covers land fragmentation trends, state rankings, gender trends, social group composition, and digital-first methodology for IBPS AFO, NABARD Grade A, and FCI exams.
In the previous lesson, we studied recent extension programmes like Krishonnati Yojana, PKVY, eNAM, and DAY-NRLM. To design effective programmes, policymakers need hard data on India's agrarian structure -- how many farms exist, how large they are, who owns them, and how these patterns are changing. That data comes from the Agricultural Census.
This lesson covers:
- Census framework -- frequency, phases, and coordinating authority
- 10th Census (2015-16) -- operational holdings, operated area, and land fragmentation
- State-wise distribution -- which states lead in holdings and area
- Average size and gender trends -- declining size, rising female participation
- Size-class distribution -- marginal, small, semi-medium, medium, and large
- Social group composition -- SC/ST share in operational holdings
- 11th Census (2021-22) -- digital-first census, key changes, current status
- World Census of Agriculture and Input Survey
Census data is a high-frequency exam topic -- expect questions on specific numbers, state rankings, trends, and the latest digital census initiative.
10th Agricultural Census 2015-16
-
The Agriculture Census in India is conducted at five yearly intervals Exams to collect data on structural aspects of operational holdings in the country. It is coordinated by the Directorate of Economics and Statistics of the Ministry of Agriculture, Cooperation and Farmers welfare.[3] This census is one of the most important exercises for understanding the agrarian structure of India, as it provides comprehensive data on the distribution of land holdings, their sizes, and ownership patterns across different social groups.
-
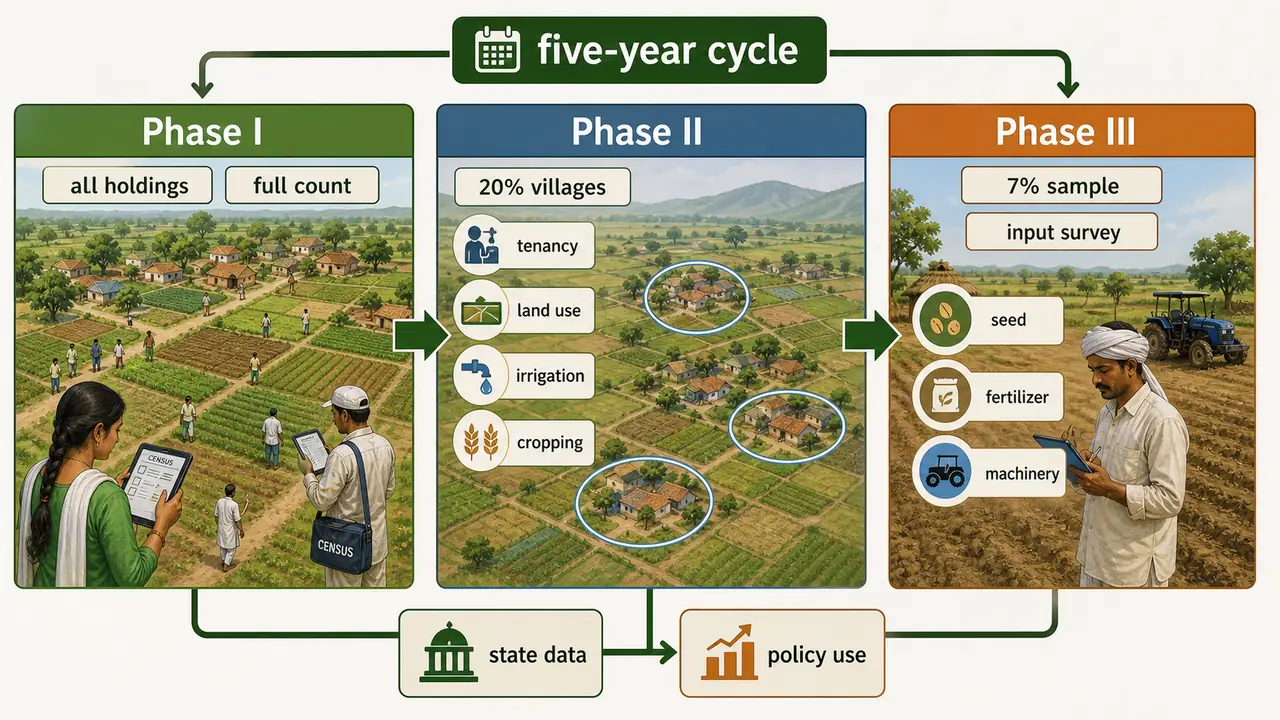
The Agriculture Census programme is carried out in three phases at five yearly intervals with cooperation of States/UTs. Each phase collects progressively more detailed information:
- Phase I, all the operational holdings in the country are enumerated and results giving number I and area of operational holdings at various administrative levels like Block/Tehsil, District and State are generated according to various social groups, size classes, types of holdings and gender. This phase provides the broad picture of how agricultural land is distributed across the country.
- Phase II, only 20 percent of the villages in each Tehsil or Block are selected and detailed II information on aspects such as tenancy, land use, irrigation, cropping pattern of all the operational holdings of these selected villages is collected. This sample-based approach allows for deeper analysis without requiring complete enumeration.
- Phase III of the Agriculture Census, which is known as Input Survey, the data is collected on use III of different inputs from selected holdings of selected villages (7 per cent). This phase captures data on fertilizer use, seed varieties, machinery, and other inputs that farmers employ.
- The Government of India provides financial and administrative support as well as all technical guidance to States/UTs required for Census operations.
- The reference period for Agriculture Census is the Agricultural year (July-June). This means the data collected reflects farming activities from July of one year to June of the next.
- The first comprehensive Agriculture Census in the country was conducted with reference year 1970-71. So far, nine Agriculture Censuses have been conducted in the country. The current Agriculture Census with reference year 2015-16 is Tenth in the series carried out in 36 states/UTs. Previous one was conducted in 2010-11.
- Being the ultimate unit for taking agriculture-related decisions, operational holding has been taken as statistical unit at micro-level for data collection. This is important because the operational holding reflects the actual farming unit, regardless of legal ownership.
-
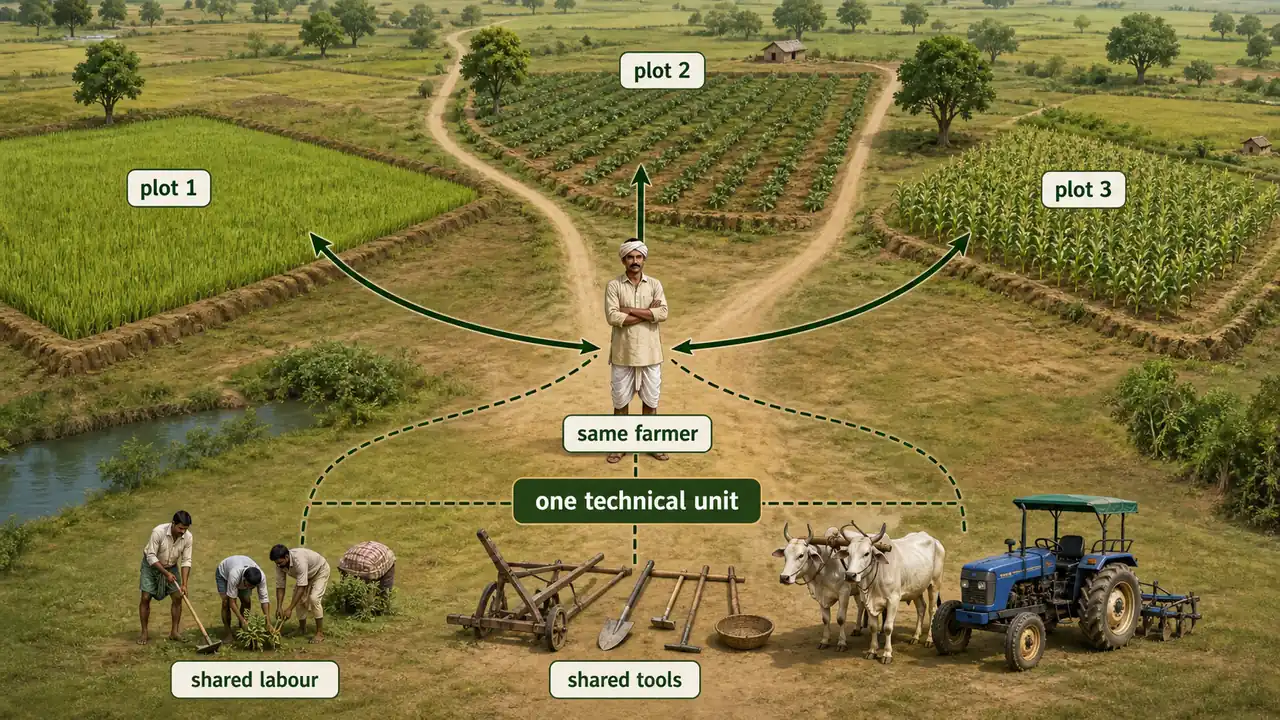
Operational Holding: All land which is used wholly or partly for agricultural production and is operated as one technical unit by one person alone or with others without regard to the title, legal form, size or location. In simple terms, it refers to the total land a farmer actually cultivates, irrespective of whether it is owned, leased, or shared.
-
Technical Unit: A unit of land which is under the same management and has the same means of production such as labour force, machinery and animals. This concept ensures that fragmented parcels managed by the same farmer using the same resources are counted together as a single operational unit.
Key Trends from the 10th Census
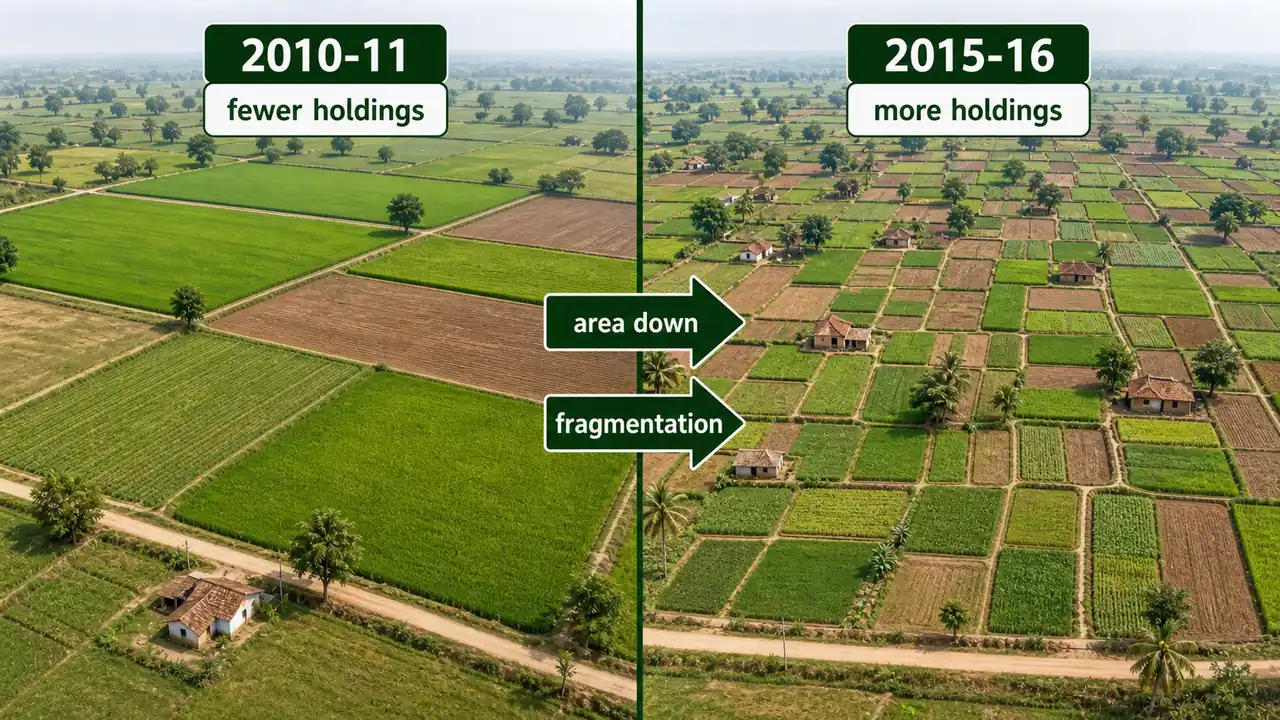
- The total number of operational holdings in the country has increased from 138.35 million in 2010-11 to 146.45 million in 2015-16 showing an increase of 5.86%.[4]
- The total operated area in the country has decreased from 159.59 million ha. in 2010-11 to 157.82 million ha in 2015-16 showing a decrease of 1.11%.[4]
- Increase in number of operational holdings and Decrease in operated area represents fragmentation of land holdings. This is a significant trend indicating that land is being subdivided into smaller and smaller parcels with each generation, which has serious implications for farm productivity and mechanization.
IMPORTANT
The simultaneous increase in holdings and decrease in area is the hallmark of land fragmentation -- the most critical trend in India's agrarian structure. This is frequently tested in exams.
State-wise Distribution
-
In a total of 146.45 million operational holdings in the country, the highest number of operational holders belonged to Uttar Pradesh (23.82 million i.e. 16%) followed by Bihar (16.41 million), Maharashtra (15.29 million), Madhya Pradesh (10.00 million), Karnataka (8.68 million), Andhra Pradesh (8.52 million), Tamil Nadu (7.94 million), Rajasthan (7.66 million), Kerala (7.58 million) etc.
-
As regards operated area, out of a total of 157.82 million ha, the highest operated area was contributed by Rajasthan (20.87 million ha), followed by Maharashtra (20.51 million ha.), Uttar Pradesh (17.45 million ha.), Madhya Pradesh (15.67 million ha.), Karnataka (11.81 million ha.) etc. Rajasthan tops in operated area largely because of its vast arid and semi-arid land, even though much of it is rain-dependent.
-
Among states, the highest increase in holdings was observed in the case of Madhya Pradesh(12.74%) followed by Andhra Pradesh (11.85%), Maharashtra (11.58%), Rajasthan (11.12%), Kerala (11.02%), Meghalaya (10.90%), Karnataka (10.83%) and Nagaland (10.16%) etc.
-
14 out of 36 States/UTs in the country accounted for about 91.01% of the total number of operational holdings and about 88.19% of the total area operated in the country. These States were Andhra Pradesh, Bihar, Chhattisgarh, Gujarat, Karnataka, Kerala, Madhya Pradesh, Maharashtra, Odisha, Rajasthan, Tamil Nadu, Telangana, Uttar Pradesh and West Bengal. This concentration shows that the bulk of India's agricultural activity is centered in these 14 major agricultural states.
Average Size and Gender Trends
-
The average size of operational holding has declined to 1.08 ha in 2015-16 as compared to 1.15 in 2010-11. This continued decline reflects the ongoing trend of land fragmentation across India.
-
The percentage share of female operational holders has increased from 12.79% in 2010-11 to 13.96% (approx. 14%) in 2015-16 with the corresponding figures of 10.36% and 11.72% in the operated area. This shows that more and more females are participating in the management and operation of agricultural lands. The rising share of women farmers is an encouraging trend towards gender inclusion in agriculture.
Size-class Distribution
-
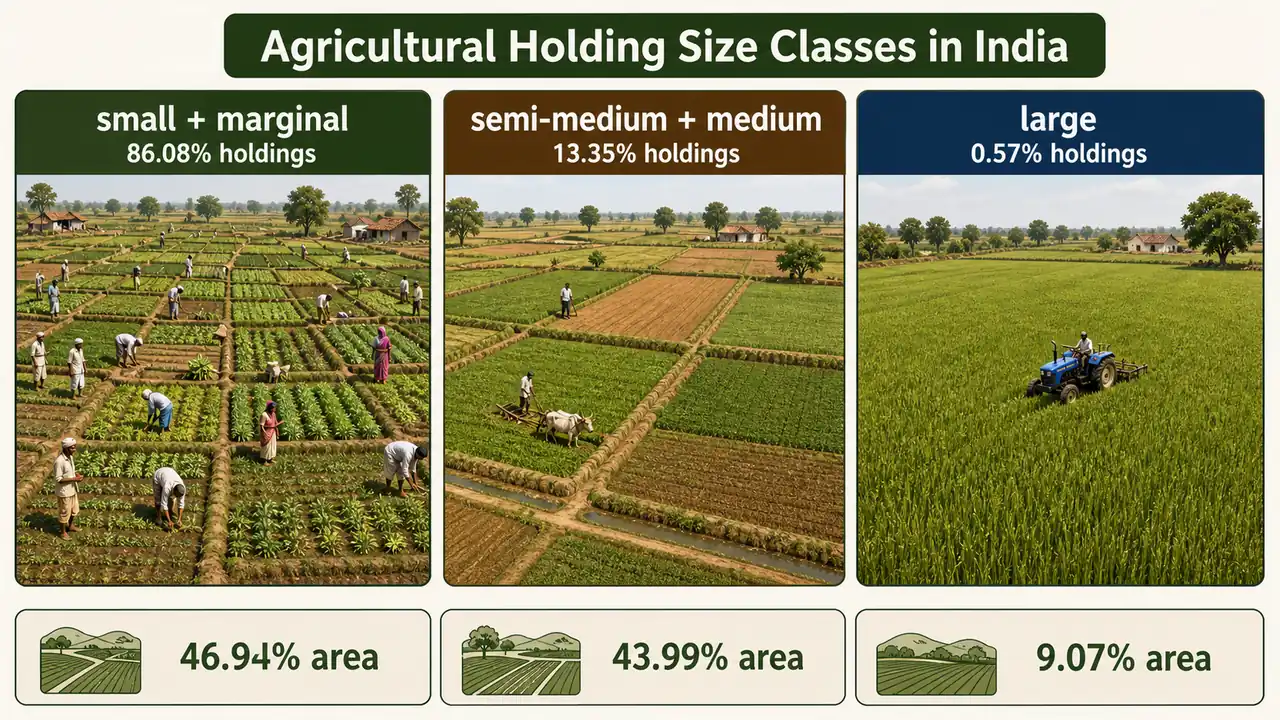
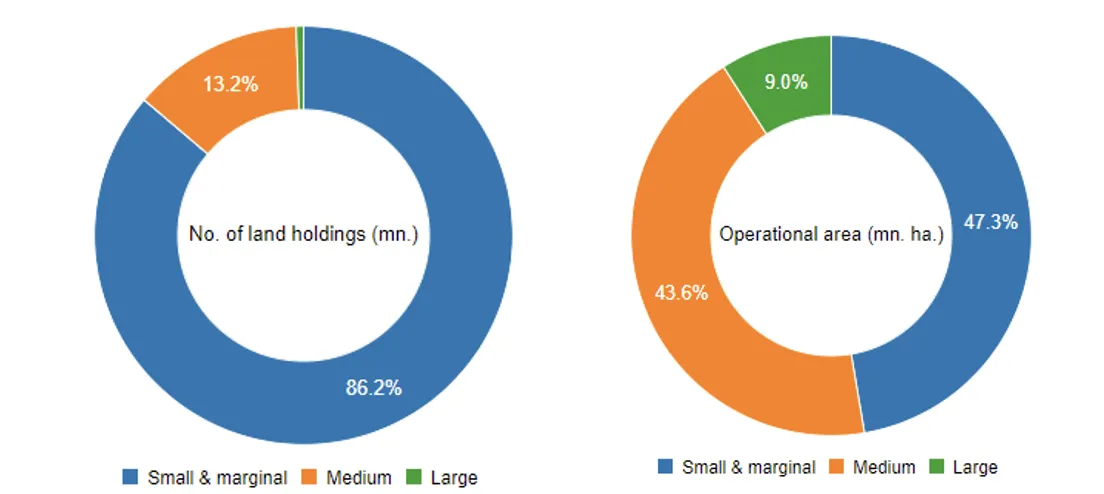
The Small and Marginal holdings taken together (0.00-2.00 ha.) constituted 86.08 % of the total holdings in 2015-16 against 85.01% in 2010-11 while their share in the operated area stood at 46.94 % in the current census as against 44.58% in 2010-11. This means the overwhelming majority of Indian farmers work on very small plots of land, yet collectively they operate less than half the total farmland.
-
The Semi-medium and Medium operational holdings (2.00-10.00 ha.) in 2015-16 were only 13.35% with 43.99 % operated area. The corresponding figures for 2010-11 census were 14.29% and 44.82%.
-
The large holdings (10.00 ha. & above) were merely 0.57 % of total number of holdings in 2015-16 and had a share of 9.07 % in the operated area as against 0.70% and 10.59% respectively for 2010-11 census. This illustrates the highly skewed nature of land distribution in India, where a tiny fraction of holdings command a disproportionately large area.
Notable State-level Records
-
The average size of farm holding was the highest in Nagaland at 5.06 hectares and the lowest in Kerala at 0.18 hectare. This enormous variation reflects differences in terrain, population density, and farming traditions across states.
-
Kerala has highest percentage of the number of marginal land holdings with 96.70% of the total operational land holdings. The all-India average is 68.52%. Kerala's extremely high proportion of marginal holdings is driven by its high population density and limited arable land.
TIP
State Records to Remember: Highest avg. holding → Nagaland (5.06 ha) | Lowest avg. holding → Kerala (0.18 ha) | Highest marginal holdings % → Kerala (96.70%) | Most holdings by number → Uttar Pradesh | Most operated area → Rajasthan.
- According to census 2011, there are 11.8 crore cultivators and 14.4 crore agricultural workers. The fact that the number of agricultural labourers exceeds cultivators highlights the growing trend of landlessness and dependence on wage labour in rural India.
Size classes and size groups of operational holdings
| Classification | Range (ha) | Average Size of Holding | Number | Area |
|---|---|---|---|---|
| Marginal | Less than 1 | 0.38 | 86.08% | 46.94% |
| Small | 1 to < 2 | 1.41 | ||
| Semi Medium | 2 to < 4 | 2.70 | 13.35% | 43.99% |
| Medium | 4 to < 10 (NABARD 2021) | 5.72 | ||
| Large | 10 and above | 17.10 | 0.57% | 9.07% |
| Total | 1.08 |
State with highest operation land holding class
| Size group | State with highest |
|---|---|
| Marginal Size group highest | Uttar Pradesh (in area and operational holdings) |
| Small Size group highest | Uttar Pradesh (in number and Maharashtra in size of operational holdings) |
| Semi-Medium Size group highest | Maharashtra (in area and number of operational holdings) |
| Medium Size group highest | Rajasthan (in area and number) |
| Large Size group highest | Rajasthan (in area and number) |
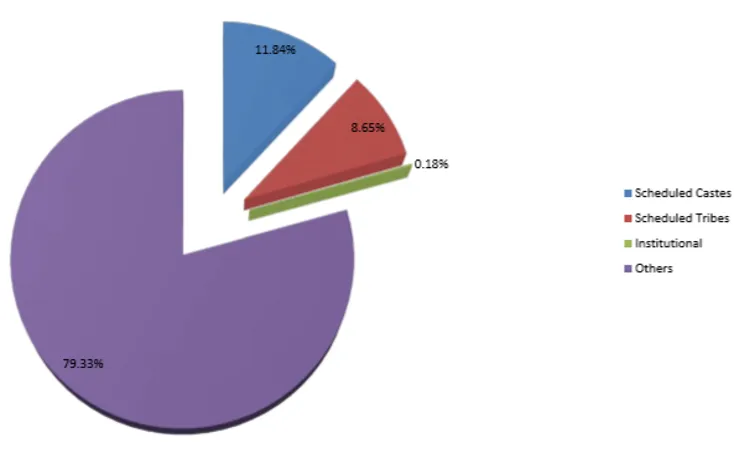
Percentage share of different social groups in number of operational holding
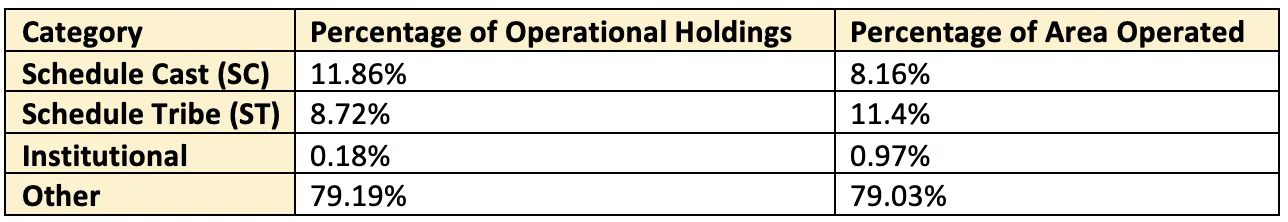
- 11.84 % of the total number of operational holdings are held by Scheduled Castes & 8.65 % by ST. Together, these groups hold about one-fifth of all operational holdings, reflecting the historically disadvantaged position of SC/ST communities in terms of land ownership.
11th Agricultural Census 2021-22
The 11th Agricultural Census with reference year 2021-22 was officially launched on 28th July, 2022 by the Union Minister of Agriculture and Farmers Welfare in New Delhi.[1] It is the eleventh in the series since the first census of 1970-71.
NOTE
The 10th census had reference year 2015-16. The 11th was originally due in 2020-21 but was delayed by one year due to the COVID-19 pandemic.[1] This is a frequently asked exam point.
Why the 11th Census is Historic
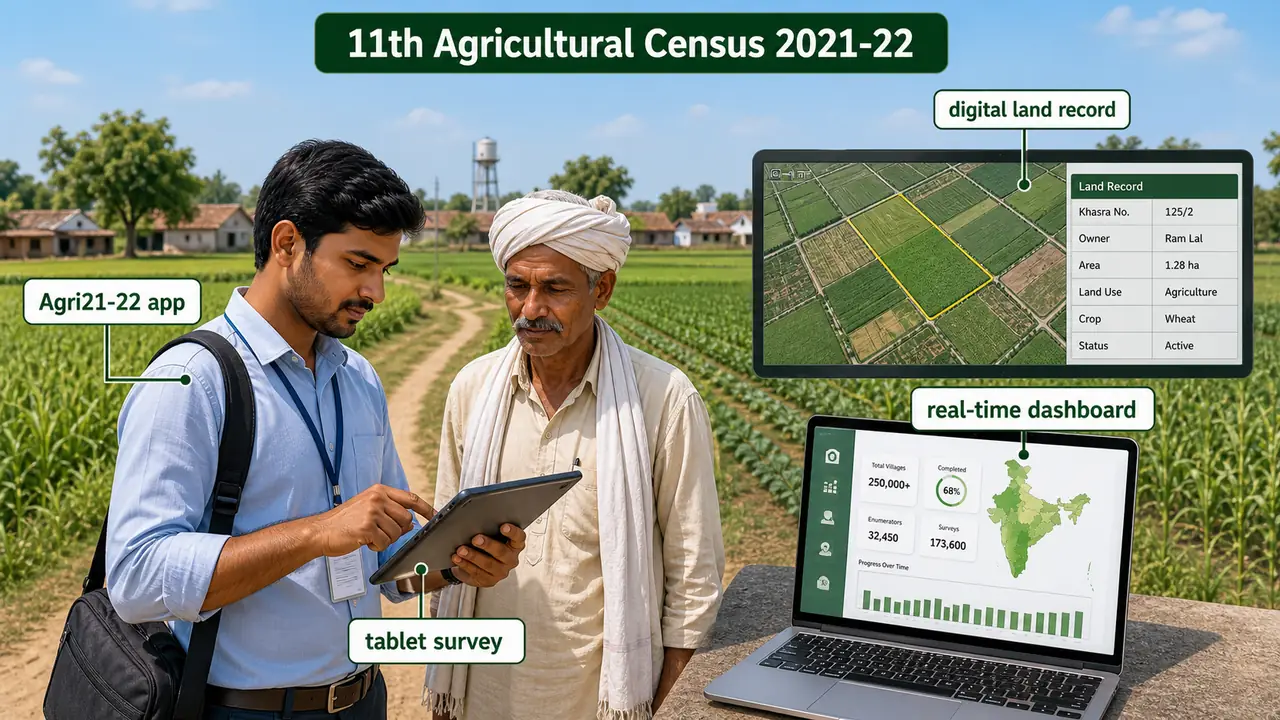
- India's first fully digital agricultural census -- a complete shift from paper-based enumeration used in all previous censuses.[2]
- Data collected via smartphones and tablets using a dedicated mobile app (Agri21-22), developed by NIELIT.[2]
- Uses digitized land records (land title records, survey/settlement reports) integrated directly into data collection -- no manual paper entry.[1]
- A dedicated web portal with real-time monitoring dashboard tracks fieldwork progress live -- first time in census history.[2]
New Initiatives in the 11th Census (Exam Focus)
| Feature | Detail |
|---|---|
| Data collection mode | Smartphones/tablets (first time ever) |
| Land records integration | Digital land title + survey records used directly |
| Village coverage | All villages enumerated -- including states without digitised land records |
| Real-time monitoring | Web portal for live progress tracking |
| App | Agri21-22 (Phase-I) developed by NIELIT |
| Coordinating agency | Directorate of Economics and Statistics, MoAFW |
| Reference year | 2021-22 (July 2021 -- June 2022) |
These changes aim to make data available faster and with greater accuracy than previous paper-based censuses, and will enable creation of a comprehensive national database of operational holdings.[3]
Timeline and Current Status
- Launched: 28 July 2022 [1]
- Phase-I target completion: December 2023 [2]
- Fieldwork status (2024): Phase-I completed in several states (e.g., Kerala completed August 2024); data processing underway
- Final national results: Not yet published as of early 2026 -- currently in processing and validation stage
IMPORTANT
For exams: Know that the 11th Agricultural Census has been launched (2021-22) but results are pending. Key facts tested: launch date (28 July 2022), reference year (2021-22), serial number (11th), COVID delay from 2020-21, and digital-first methodology. Do NOT confuse with India's Population Census 2027 (a separate exercise beginning April 2026).
Other Agriculture Related Surveys
Beyond the national census, India also participates in international agricultural data exercises and conducts specialised input surveys. These provide additional layers of data for policy planning and international comparison.
World Census of Agriculture
After every 10 years World Census of Agriculture sponsored by Food and Agriculture Organization (FAO) of the United Nations essentially constitutes a series of National Agriculture Census taken all over the world in or around the same year within the framework of uniform concepts and definitions and a common programme of items coverage and tabulation. This global coordination ensures international comparability of agricultural data, making it possible to analyze farming trends across different countries and regions.
- The first World Census of Agriculture was conducted in 1930. This is a short chronology fact that often appears in direct MCQs.
Input Survey
In addition to Agriculture Census, an Input Survey is also conducted in the following year of the Agriculture Census at the interval of five years to collect information on use of various inputs like fertilizers, manures, Agriculture credit, implements and machinery, seeds, livestock etc. So far eight Input Surveys since 1976-77 have been completed. The Input Survey is essentially Phase III of the Agriculture Census and provides valuable data on how farmers allocate resources and what technologies they adopt in their farming operations.
Summary Cheat Sheet
| Concept / Topic | Key Details |
|---|---|
| Agriculture Census interval | Every 5 years; coordinated by Directorate of Economics and Statistics |
| First Census | Reference year 1970-71 |
| 10th Census | Reference year 2015-16; conducted in 36 States/UTs |
| 11th Census | Reference year 2021-22; launched 28 July 2022; results pending |
| 11th Census -- why delayed | COVID-19 pandemic delayed from 2020-21 to 2021-22 |
| 11th Census -- key feature | India's first digital census -- smartphones/tablets, NIELIT app |
| 11th Census -- land records | Digital land title records + survey reports integrated directly |
| 11th Census -- monitoring | Real-time web portal (first time ever) |
| Three phases | Phase I: full enumeration; Phase II: 20% villages (detailed); Phase III: 7% villages (Input Survey) |
| Total operational holdings | 146.45 million (2015-16); increased 5.86% from 2010-11 |
| Total operated area | 157.82 million ha (2015-16); decreased 1.11% from 2010-11 |
| Land fragmentation | Holdings increasing + area decreasing = fragmentation trend |
| Average holding size | 1.08 ha (2015-16); declined from 1.15 ha in 2010-11 |
| Most holdings (state) | Uttar Pradesh (23.82 million, 16%) |
| Most operated area (state) | Rajasthan (20.87 million ha) |
| Highest avg. holding | Nagaland (5.06 ha) |
| Lowest avg. holding | Kerala (0.18 ha) |
| Highest marginal holdings % | Kerala (96.70%) |
| Small & Marginal holdings | 86.08% of total holdings; 46.94% of operated area |
| Large holdings | Only 0.57% of holdings; 9.07% of operated area |
| Female operational holders | 13.96% (2015-16); rising trend |
| SC holdings | 11.84% of total; ST = 8.65% |
| Census 2011 data | 11.8 crore cultivators, 14.4 crore agricultural workers |
| World Census of Agriculture | Every 10 years; sponsored by FAO |
| Input Survey | Conducted in year following Census; 8 surveys since 1976-77 |
References
4 sources • [1] [2] [3] [4]
References
Used for: Official PIB press release covering the launch date (28 July 2022), COVID delay, and reference year 2021-22.
Used for: PIB release detailing digital-first methodology: smartphone/tablet data collection, NIELIT app, Phase-I target (December 2023), real-time monitoring portal.
Used for: Official census portal — census framework, five-yearly intervals, three-phase structure, Directorate of Economics and Statistics as coordinating body.
Used for: Official report: 146.45 million operational holdings, 157.82 million ha operated area, size-class breakup, state rankings, gender and SC/ST data.
TIP
Next: The next lesson covers SECC 2011 -- India's first caste-based census since independence, with its three-tier BPL methodology, deprivation indicators, and key findings on rural poverty.