📊 Fisheries Statistics — India & Global
Comprehensive fisheries data covering production, state rankings, global position, classification, and key schemes
Fish is often called "Brain Food", "Heart Food", and "Rich Food for Poor People" — reflecting its nutritional value and affordability. India is a major player in global fisheries, and this sector is critical for exams like NABARD, FCI, and exams.
Nutritional Profile of Fish
| Parameter | Value |
|---|---|
| Protein content | 18–20% |
| Fat content | 0.2–25% (varies by species) |
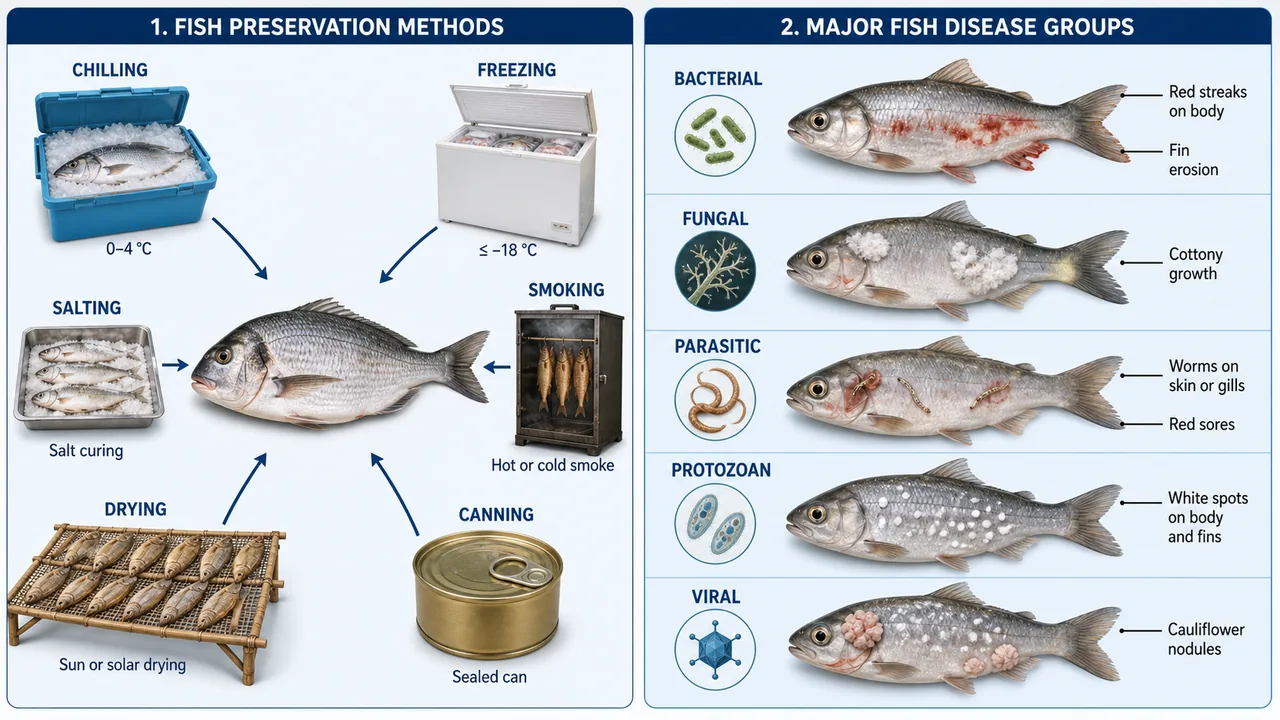
| Post-harvest losses | 20–25% |
NOTE
The high post-harvest loss (20-25%) in fisheries is a major concern and a frequently asked statistic. It highlights the need for cold chain infrastructure.
India's Fish Production
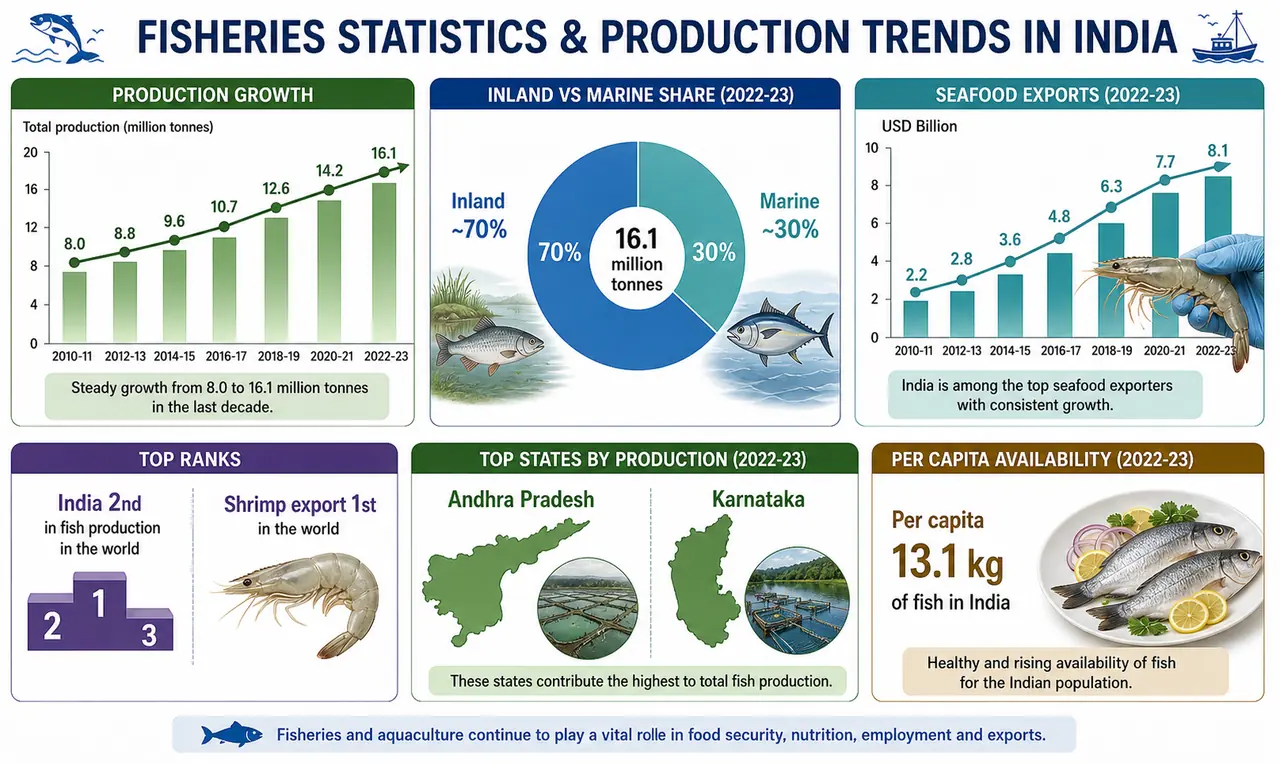
| Category | 2024-25 (Lakh Tonnes) | 2023-24 (Lakh Tonnes) |
|---|---|---|
| Total Fish Production | 197.75 | 184.02 |
| Marine | — | 44.90 |
| Inland | — | 139.10 |
Key structural facts:
Pro Content Locked
Upgrade to Pro to access this lesson and all other premium content.
₹99 charged monthly · Cancel anytime
- All Agriculture & Banking Courses
- AI Lesson Questions (100/day)
- AI Doubt Solver (50/day)
- Glows & Grows Feedback (30/day)
- AI Section Quiz (20/day)
- 22-Language Translation (100/day)
- Recall Questions (20/day)
- AI Quiz (15/day)
- AI Quiz Paper Analysis (100/day)
- AI Step-by-Step Explanations (100/day)
- Spaced Repetition Recall (FSRS)
- AI Tutor
- Immersive Text Questions
- Audio Lessons — Hindi & English
- Mock Tests & Previous Year Papers
- Summary & Mind Maps
- XP, Levels, Leaderboard & Badges
- Generate New Classrooms
- Voice AI Teacher (AgriDots Live)
- AI Revision Assistant
- Knowledge Gap Analysis
- Interactive Revision (LangGraph)
🔒 Secure via Razorpay · Cancel anytime · No hidden fees
Fish is often called "Brain Food", "Heart Food", and "Rich Food for Poor People" — reflecting its nutritional value and affordability. India is a major player in global fisheries, and this sector is critical for exams like NABARD, FCI, and exams.
Nutritional Profile of Fish
| Parameter | Value |
|---|---|
| Protein content | 18–20% |
| Fat content | 0.2–25% (varies by species) |
| Post-harvest losses | 20–25% |
NOTE
The high post-harvest loss (20-25%) in fisheries is a major concern and a frequently asked statistic. It highlights the need for cold chain infrastructure.
India's Fish Production
| Category | 2024-25 (Lakh Tonnes) | 2023-24 (Lakh Tonnes) |
|---|---|---|
| Total Fish Production | 197.75 | 184.02 |
| Marine | — | 44.90 |
| Inland | — | 139.10 |
Key structural facts:
- ~70% of India's fish production comes from inland waters
- Aquaculture contributes ~62% of total production
- Average aquaculture productivity: 4.77 tonnes/ha
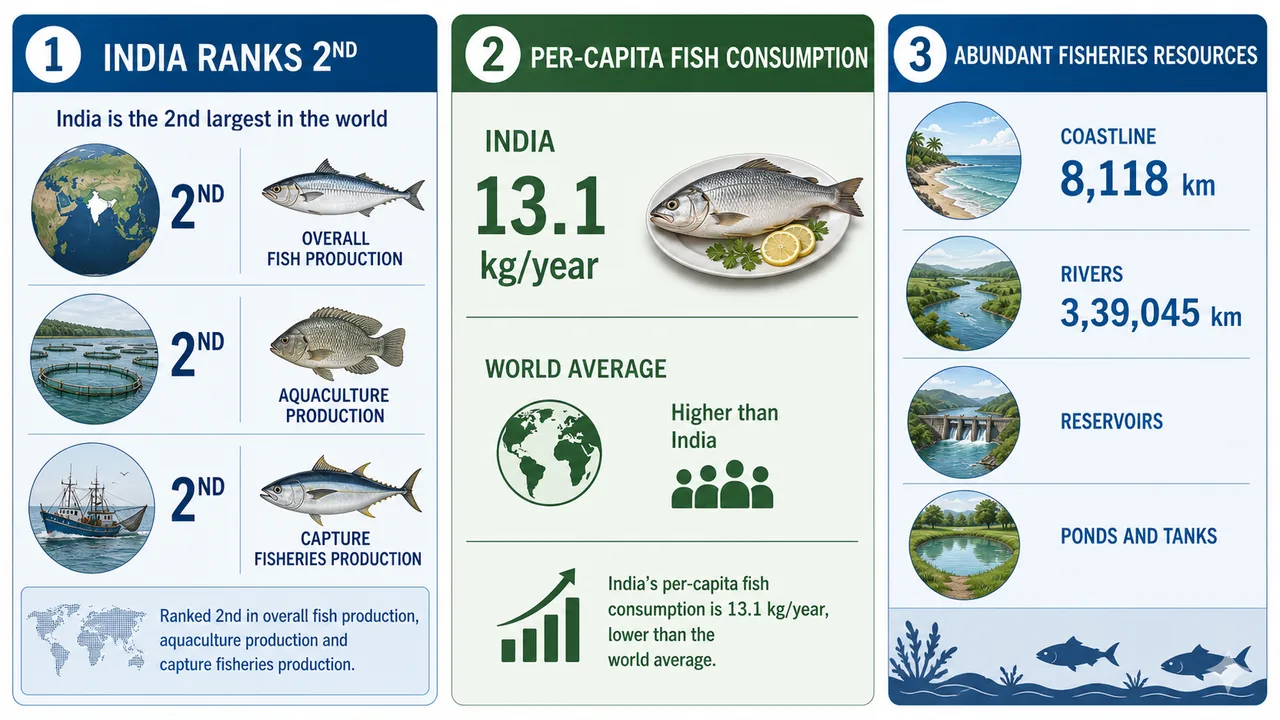
India's Global Position in Fisheries (2024-25)
| Category | India's Rank |
|---|---|
| Overall Fish Production | 2nd (1st is China) |
| Aquaculture | 2nd (1st is China) |
| Capture Fisheries | 2nd |
| Shrimp Production & Export | 1st |
| India's share in global output | 8% |
NOTE
India has moved up from 3rd to 2nd largest fish producer globally (overtaking Indonesia), as per MoFAHD (Jan 2026). Previously, India was ranked 3rd overall — this is a major update for exams.
Economic Contribution
| Parameter | Value |
|---|---|
| Fisheries share in Agriculture GVA | 7.43% (highest among agri & allied sectors) |
| India's share in world fish production | 8% |
| Seafood exports (2024-25) | 16.98 lakh MT worth ₹62,408 crore (US$ 7.45 billion) |
| Seafood exports (2023-24) | 17.82 lakh MT worth US$ 7.38 billion |
| Value-added exports growth | 56% increase in 5 years (₹4,863 → ₹7,590 crore) |
Per Capita Fish Consumption
| Region/Standard | Consumption (kg/year) |
|---|---|
| India | 13.1 kg |
| World average | 20.7 kg |
| ICMR recommendation | 12 kg |
NOTE
India's per capita consumption (13.1 kg) exceeds the ICMR recommendation (12 kg) but is well below the world average (20.7 kg).
Inland Fishery Resources
| Resource | Value |
|---|---|
| Coastline length | 8,118 km |
| River length | 3,39,045 km |
| Ponds & Tanks | 2.75 million ha |
Top states by river length: UP > Rajasthan > West Bengal
Top states by ponds & tanks area: Telangana > Andhra Pradesh
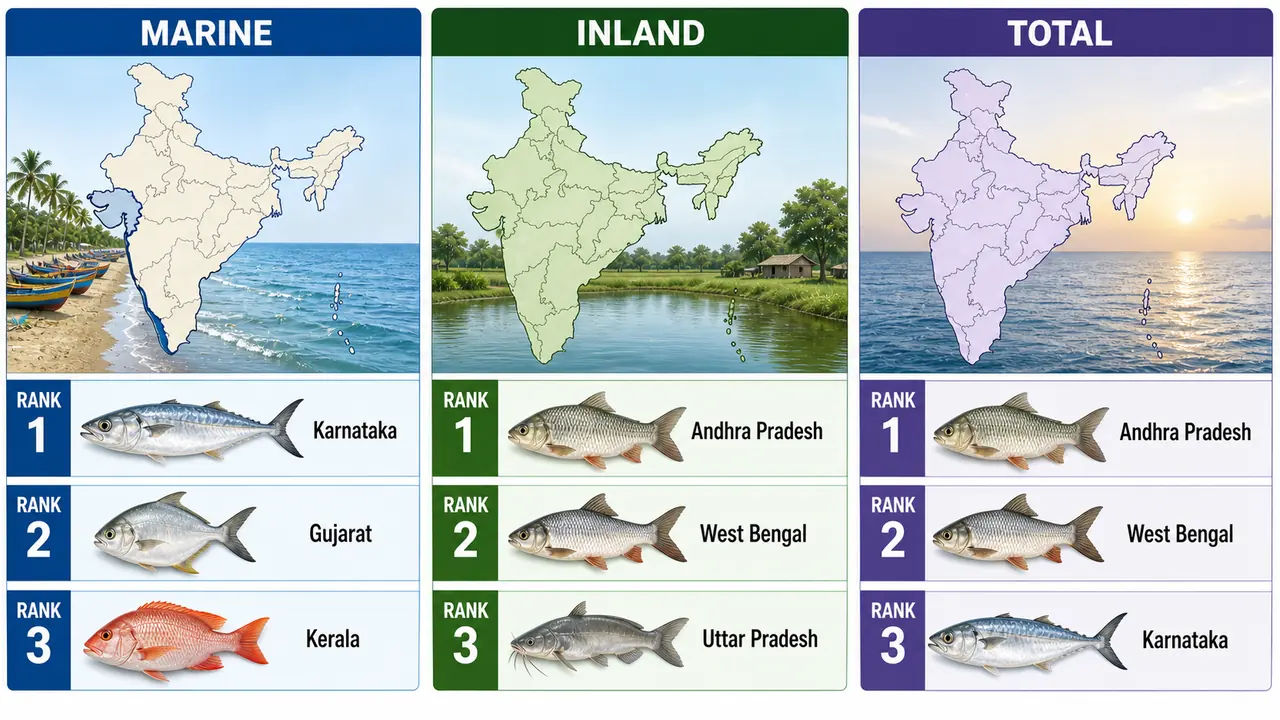
State-wise Fish Production Rankings
Marine Production (Lakh Tonnes)
| Rank | State | Production |
|---|---|---|
| 1 | Karnataka | 7.30 |
| 2 | Gujarat | 7.03 |
| 3 | Kerala | 6.91 |
Inland Production (Lakh Tonnes)
| Rank | State | Production |
|---|---|---|
| 1 | Andhra Pradesh | 45.06 |
| 2 | West Bengal | 18.56 |
| 3 | Uttar Pradesh | 9.15 |
Total Fish Production (Lakh Tonnes)
| Rank | State | Production |
|---|---|---|
| 1 | Andhra Pradesh | 51.06 |
| 2 | West Bengal | 20.45 |
| 3 | Karnataka | 12.25 |
TIP
AP dominates inland and total fish production. For marine, remember "KGK" = Karnataka, Gujarat, Kerala.
Fish Seed Production: Assam > Jharkhand > West Bengal
Top Fish Consuming States (Per Capita)
| Rank | State/UT | Per Capita (kg/year) |
|---|---|---|
| 1 | Andaman & Nicobar Islands | 114 kg |
| 2 | Lakshadweep | 89 kg |
| 3 | Tripura | 27.62 kg |
| 4 | Karnataka | — |
| 5 | Kerala | — |
NOTE
Island territories consume far more fish per capita than mainland states. A&N Islands at 114 kg is nearly 9x the national average!
Fisheries Infrastructure
| Infrastructure | Count |
|---|---|
| Major Fishing Harbours | 7 |
| Minor Fishing Harbours | 63 |
| Fish Landing Centres | 1,547 |
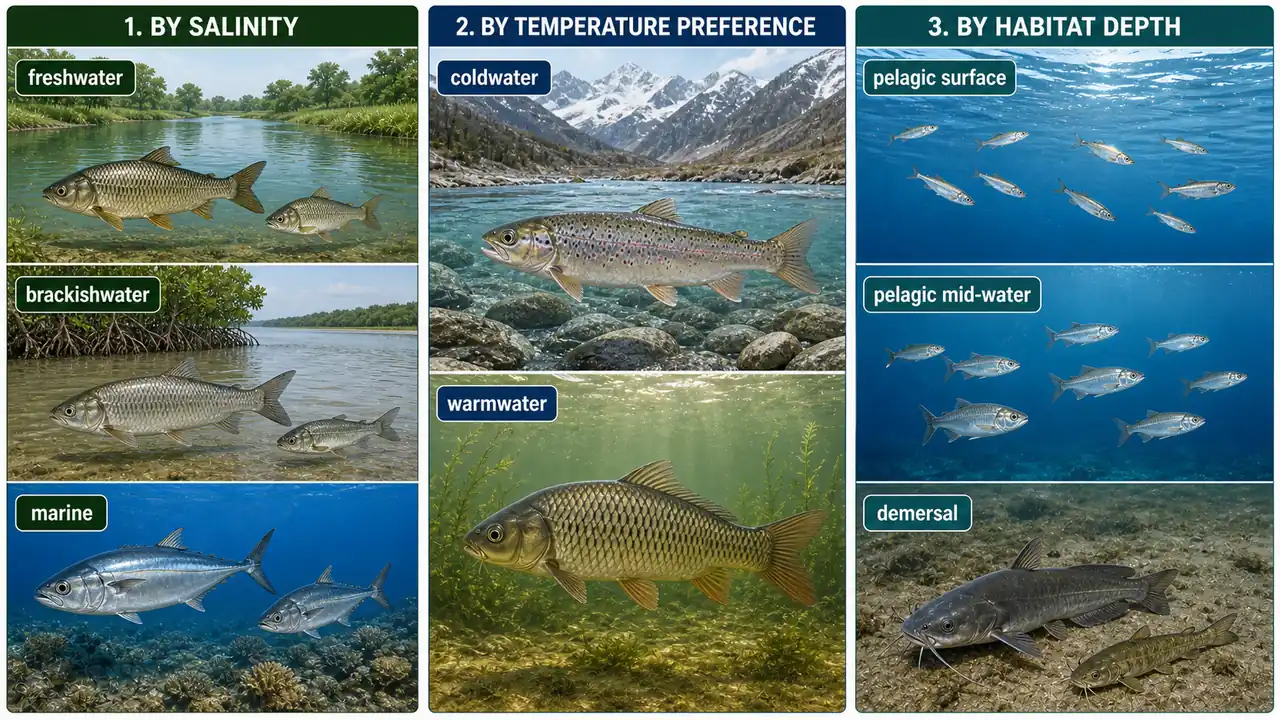
Classification of Fish
By Water Salinity
| Type | Salinity (ppt) | Examples |
|---|---|---|
| Freshwater | < 0.5 ppt | Carps, Catfish |
| Brackishwater | 0.5–30 ppt | Mullet, Milkfish |
| Marine | > 30 ppt | Sardines, Tuna |
By Temperature Preference
| Type | Temperature | Examples |
|---|---|---|
| Coldwater fish | 5–20°C | Mahseer, Trout |
| Warmwater fish | 25–35°C | Carps, Catfish |
By Habitat Depth
| Type | Habitat | Examples |
|---|---|---|
| Pelagic (Surface) | Near surface | Sardines, Mackerel, Tuna |
| Pelagic (Mid-water) | Mid-depth | Bombay Duck, Cobia |
| Demersal | Near bottom | Perches, Pomfrets |
Special Facts
- Finfish = fish with fins (majority of fish species)
- Shellfish = shrimp, crab, lobster, molluscs (no true fins)
- Moonfish (Opah) = the only known warm-blooded fish
TIP
The Moonfish being warm-blooded is a unique fact that appears in exams and NABARD prelims. All other fish are cold-blooded (ectothermic).
Global Fisheries Statistics (2022)
| Category | Production (Million Tonnes) |
|---|---|
| Total Global Fisheries | 223.2 |
| Total Capture | 91.0 |
| — Inland Capture | 11.3 |
| — Marine Capture | 79.7 |
| Total Aquaculture | 94.4 |
| — Inland Aquaculture | 59.1 |
| — Marine Aquaculture | 35.3 |
NOTE
Globally, aquaculture (94.4 MT) has surpassed capture fisheries (91.0 MT) — a historic milestone reflecting the shift toward fish farming.
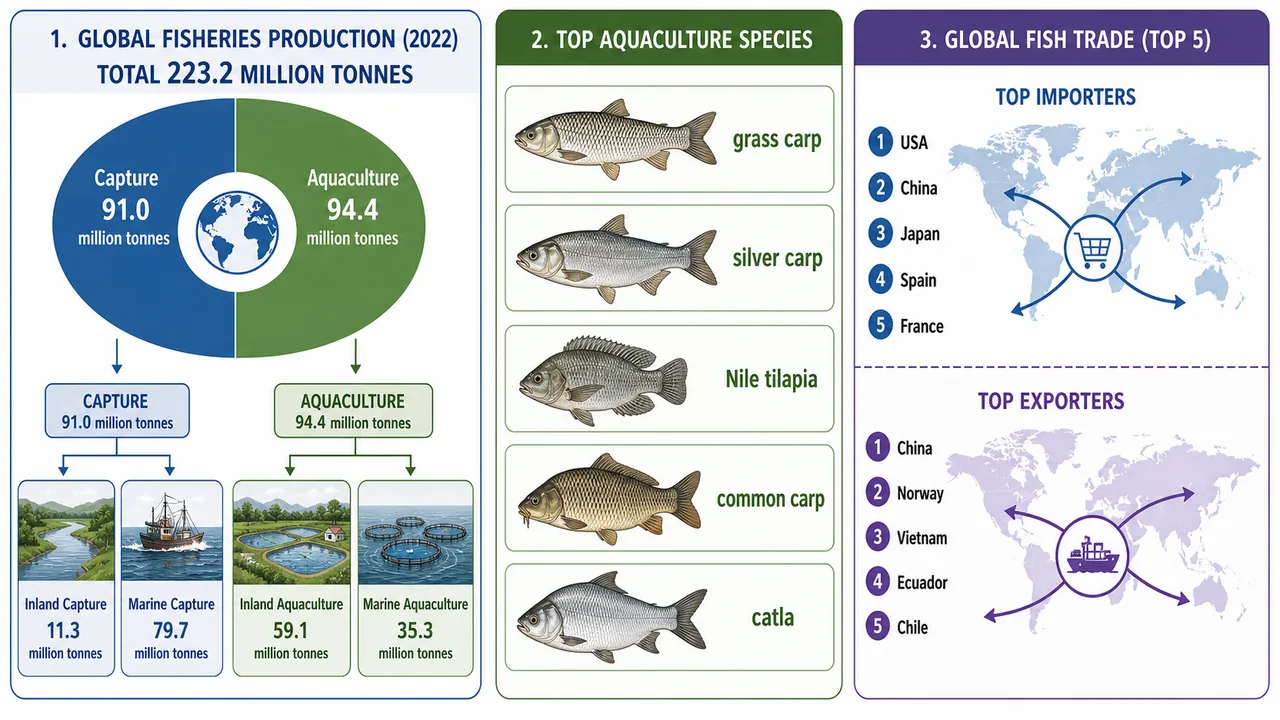
Top Aquaculture Species (Global)
| Species | Share (%) |
|---|---|
| Grass Carp | 11.8% |
| Silver Carp | 10.0% |
| Nile Tilapia | 9.0% |
| Common Carp | 8.6% |
| Catla | 7.2% |
TIP
Mnemonic for top aquaculture species: "Grass Silver Nile Common Catla" — "GSNCC" or remember "Grass grows Silver Nile Common Catla"
Global Trade in Fisheries
Top Importing Countries
USA > China > Japan > Spain > France
Top Exporting Countries
China > Norway > Vietnam > Ecuador > Chile
TIP
China is both a top importer (#2) AND the top exporter (#1) — a frequently tested fact highlighting China's dominance in global fisheries trade.
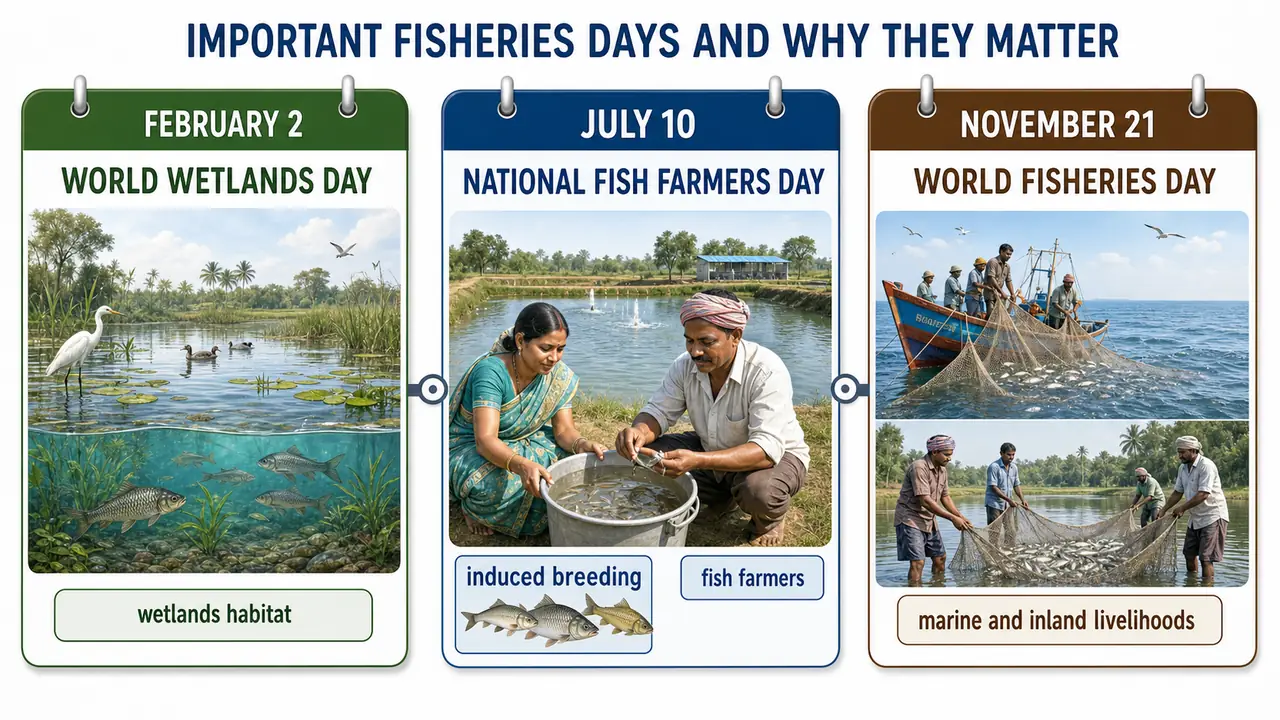
Important Days Related to Fisheries
| Date | Day |
|---|---|
| February 2 | World Wetlands Day |
| July 10 | National Fish Farmers Day |
| November 21 | World Fisheries Day |
TIP
National Fish Farmers Day (July 10) commemorates the contribution of Prof. Hiralal Chaudhuri and Dr. K.H. Alikunhi who successfully demonstrated induced breeding of Indian Major Carps on this day in 1957.
Summary Cheat Sheet
| Concept / Topic | Key Details / Explanation |
|---|---|
| Fish – common names | "Brain Food", "Heart Food", "Rich Food for Poor People" |
| Fish protein content | 18–20% |
| Post-harvest losses in fisheries | 20–25% |
| Total fish production (2024-25) | 197.75 lakh tonnes |
| Marine production (2023-24) | 44.90 lakh tonnes |
| Inland production (2023-24) | 139.10 lakh tonnes (~70% of total) |
| Aquaculture share | ~62% of total production |
| Aquaculture productivity | 4.77 tonnes/ha |
| India's rank – Overall fish production | 2nd (China is 1st) |
| India's rank – Aquaculture | 2nd (China is 1st) |
| India's rank – Capture fisheries | 2nd |
| India's rank – Shrimp production & export | 1st |
| Fisheries share in Agriculture GVA | 7.43% (highest among agri & allied) |
| India's share in world fish production | 8% |
| Seafood exports (2024-25) | 16.98 lakh MT worth US$ 7.45 billion (₹62,408 crore) |
| Per capita – India | 13.1 kg/year |
| Per capita – World average | 20.7 kg/year |
| ICMR recommendation | 12 kg/year |
| Coastline length | 8,118 km |
| River length | 3,39,045 km |
| Ponds & Tanks area | 2.75 million ha |
| Top river-length states | UP > Rajasthan > West Bengal |
| Top ponds & tanks states | Telangana > Andhra Pradesh |
| Marine production top states | Karnataka > Gujarat > Kerala |
| Inland production top states | Andhra Pradesh > West Bengal > UP |
| Total production top states | AP > WB > Karnataka |
| Fish seed production | Assam > Jharkhand > West Bengal |
| Highest per capita fish consumption | Andaman & Nicobar Islands – 114 kg/year |
| 2nd highest per capita | Lakshadweep – 89 kg/year |
| Major Fishing Harbours | 7 |
| Minor Fishing Harbours | 63 |
| Fish Landing Centres | 1,547 |
| Freshwater fish salinity | < 0.5 ppt (e.g., Carps, Catfish) |
| Brackishwater salinity | 0.5–30 ppt (e.g., Mullet, Milkfish) |
| Marine salinity | > 30 ppt (e.g., Sardines, Tuna) |
| Coldwater fish | 5–20°C — Mahseer, Trout |
| Warmwater fish | 25–35°C — Carps, Catfish |
| Pelagic (surface) fish | Sardines, Mackerel, Tuna |
| Demersal fish | Near bottom — Perches, Pomfrets |
| Warm-blooded fish | Moonfish (Opah) — only known warm-blooded fish |
| Global total fisheries (2022) | 223.2 million tonnes |
| Global aquaculture milestone | Aquaculture (94.4 MT) surpassed capture fisheries (91.0 MT) |
| Top aquaculture species globally | Grass Carp (11.8%) > Silver Carp (10.0%) > Nile Tilapia (9.0%) |
| Top fish importing countries | USA > China > Japan > Spain > France |
| Top fish exporting countries | China > Norway > Vietnam > Ecuador > Chile |
| World Wetlands Day | February 2 |
| National Fish Farmers Day | July 10 (commemorates 1957 induced breeding success) |
| World Fisheries Day | November 21 |
& Sources
| Source | Details |
|---|---|
| PIB, Ministry of Fisheries (Jan 2026) | Fish production 197.75 LT in FY 2024-25, India 2nd largest producer globally |
| MPEDA Export Performance (2024-25) | Seafood exports: 16.98 lakh MT, US$ 7.45 billion |
| FAO SOFIA Report (2024) | Global fisheries 223.2 MT, aquaculture surpassed capture fisheries |
| Handbook on Fisheries Statistics 2023 | 2022-23 detailed breakdowns (marine/inland, state-wise) |
| Department of Fisheries, GoI | Infrastructure data, classification, resource statistics |
NOTE
Data vintage: Production figures are from FY 2024-25 (PIB Jan 2026). Marine/inland breakdown and state-wise rankings are from FY 2023-24 (latest published breakdown). Global statistics are from FAO SOFIA 2024 (reporting 2022 data). Always check the Department of Fisheries website (dof.gov.in) for the most current Handbook on Fisheries Statistics.
Lesson Doubts
Ask questions, get expert answers