👥 Population & Demographics of UP
An exam-focused explanation of Uttar Pradesh's demographic profile using Census 2026 data, including population, density, sex ratio, literacy, SC/ST share, rural-urban split, and major district records.
Census 2011 — The Foundation
Demography questions become confusing when students mix three things together: official Census numbers, later projections, and casual rounded estimates. For exam safety, keep them separate.
As of 3 June 2026, the latest completed Population Census remains Census 2011, so almost all standard UP demographic questions still use those figures as the official baseline. That is why this lesson keeps returning to Census 2011 instead of newer unofficial estimates.
You should not memorize these numbers as isolated statistics. Try to read them as a social picture of the state:
- UP has a very large population
- it is dense and mostly rural
- literacy and sex ratio are below the national average
- SC population is very large in absolute terms
- ST share is small, and geographically concentrated
| Parameter | Uttar Pradesh | India | UP's Rank |
|---|---|---|---|
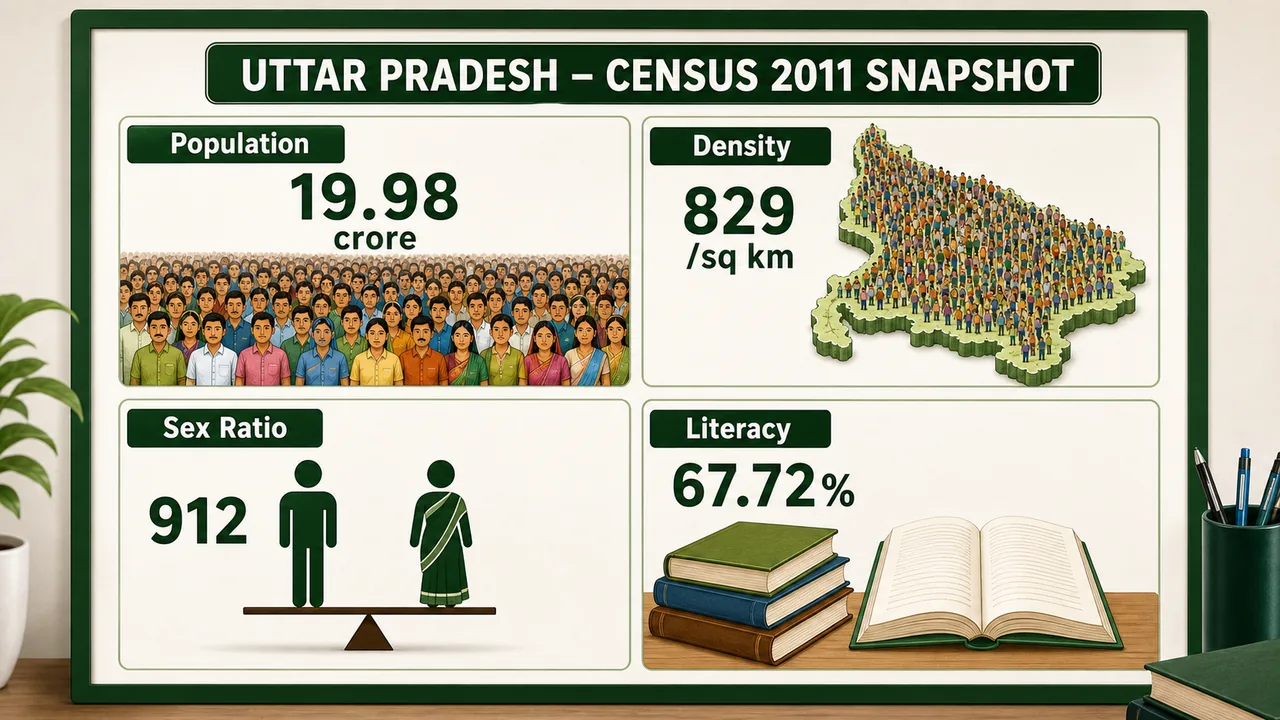
| Total Population | 19,98,12,341 (~20 crore) | 121.08 crore | 1st |
| % of India's Population | 16.51% | — | — |
| Decadal Growth (2001-11) | 20.23% | 17.72% | — |
| Population Density | 829 per sq km | 382 per sq km | 4th (among states) |
| Sex Ratio (overall) | 912 | 943 | Below national avg |
| Child Sex Ratio (0-6 yrs) | 902 | 914 | Below national avg |
| Literacy Rate | 67.72% | 73.00% | Below national avg |
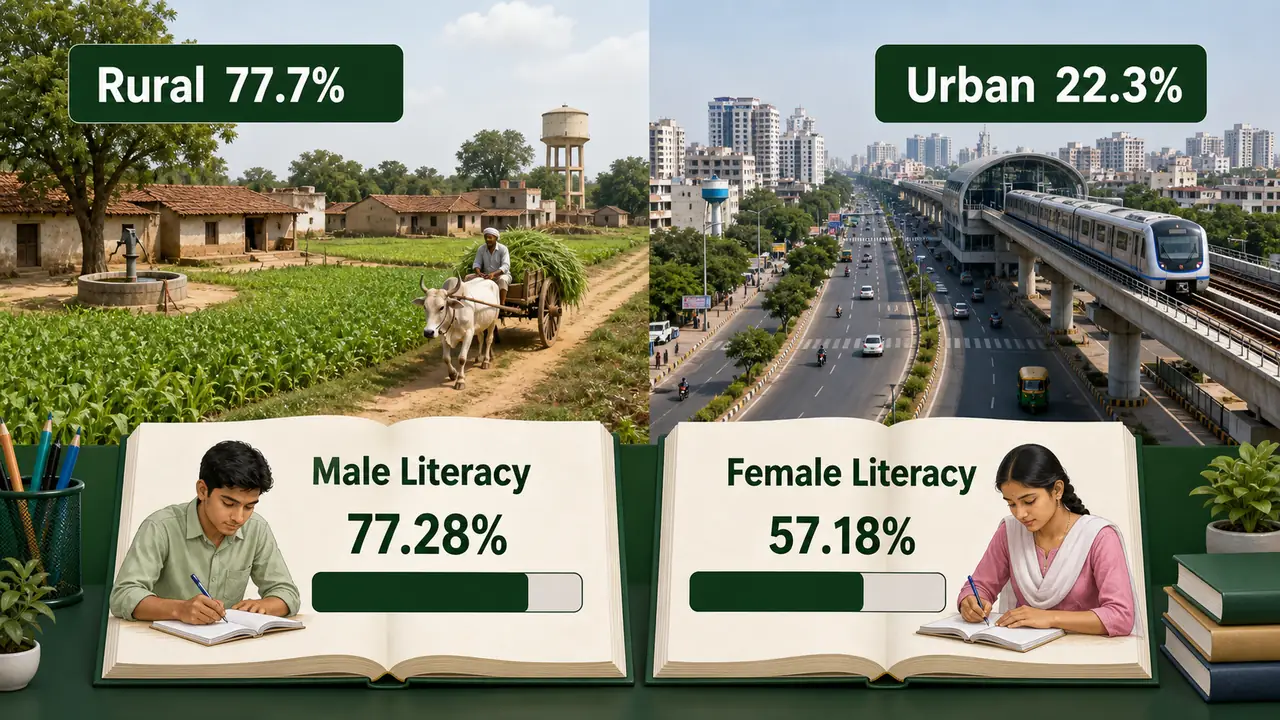
| Male Literacy | 77.28% | 80.89% | — |
| Female Literacy | 57.18% | 64.64% | — |
Exam Tip: UP's population is approximately 1/6th of India (16.51%). The density of 829/sq km is more than double the national average. Both are favourite exam questions.
Population Distribution — Urban vs Rural
Uttar Pradesh remains a predominantly rural state. The urbanization level is significantly below the national average.
| Category | UP | India |
|---|---|---|
| Rural Population | ~77.7% | 68.84% |
| Urban Population | ~22.3% | 31.16% |
This matters for exam understanding because a mostly rural population affects:
- agriculture dependence
- lower urban service access in many districts
- stronger village-based social structure
- uneven educational and health outcomes across regions
The major urban centres include Lucknow, Kanpur, Ghaziabad, Agra, Varanasi, Meerut, Prayagraj, and Noida. The Ghaziabad-Noida belt stands out because NCR expansion accelerated urban growth there far more than in eastern and Terai districts.
Sex Ratio Analysis
The sex ratio (females per 1000 males) is a critical social indicator and a staple of exam questions.
| Sex Ratio Type | UP | National Average |
|---|---|---|
| Overall Sex Ratio | 912 | 943 |
| Child Sex Ratio (0-6) | 902 | 914 |
The child sex ratio is especially important because it signals the condition of the youngest age group. If the child sex ratio is weak, the problem is deeper than just adult migration or population structure.
District Extremes — Sex Ratio
| Record | District | Value |
|---|---|---|
| Highest Sex Ratio | Jaunpur | ~1,024 |
| Lowest Sex Ratio | Gautam Buddha Nagar | ~851 |
Exam Tip: Standard UP GK material usually cites Jaunpur among the highest sex-ratio districts and Gautam Buddha Nagar among the lowest. Learn the pattern too: densely urban-industrial districts often show skew because of male-dominated migration.
Literacy — The Gender Gap
UP's literacy rate of 67.72% is below the national average of 73%. The gender gap in literacy is particularly striking — a difference of about 20 percentage points between male (77.28%) and female (57.18%) literacy.
This is one of the most meaningful numbers in the lesson. It tells you that demographic pressure in UP is not only about population size; it is also about human development gaps, especially for women.
District Extremes — Literacy
| Record | District | Approx. Rate |
|---|---|---|
| Highest Literacy | Gautam Buddha Nagar | ~80% |
| Lowest Literacy | Shravasti | ~46% |
The Terai belt districts such as Shravasti, Bahraich, and Balrampur are often associated with lower literacy in UP GK material. In contrast, NCR-linked districts benefit from stronger urbanization, service-sector growth, and educational infrastructure.
Scheduled Castes & Scheduled Tribes
UP has a very significant SC population but a negligible ST population.
| Category | UP | National Reference |
|---|---|---|
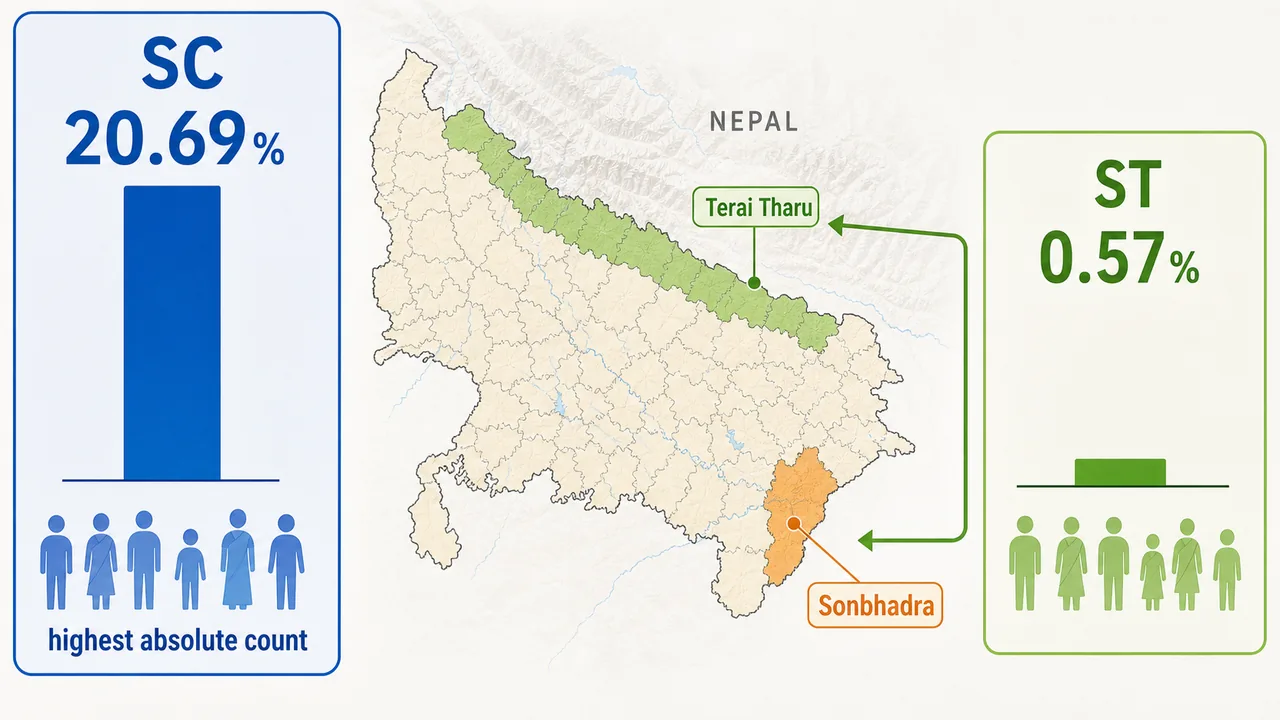
| SC Population | 20.69% of state total | National avg: ~16.6% |
| SC Absolute Count | ~4.13 crore | Highest in India |
| ST Population | 0.57% of state total | National avg: ~8.6% |
Key SC/ST Facts
- UP has the highest absolute number of SC population in India — approximately 4.13 crore
- In percentage terms, Punjab has a higher SC proportion, but UP leads in absolute numbers
- The ST population is concentrated mainly in Sonbhadra district (Kol, Gond, Baiga, and Chero tribes)
- The Tharu tribe in the Terai region (Lakhimpur Kheri, Bahraich, Shravasti) is the most well-known tribal group of UP
Exam Tip: "Highest SC population in India" = UP (absolute numbers). Don't confuse with percentage — Punjab leads by percentage.
This contrast between high SC numbers and low ST share is a classic exam differentiator. Students often remember only one side and miss the contrast.
District-Level Population Records
| Record | District | Value |
|---|---|---|
| Most Populous District | Prayagraj | ~60 lakh |
| Least Populous District | Mahoba | ~8.8 lakh |
| Highest Density | Ghaziabad | ~3,971/sq km |
| Lowest Density | Sonbhadra | ~270/sq km |
| Highest Decadal Growth | Gautam Buddha Nagar | ~44% |
| Lowest Decadal Growth | Kanpur Nagar | ~10% |
Interesting Patterns
- Ghaziabad has the highest density because of its small area and massive urban population as part of NCR
- Sonbhadra has the lowest density — it is the second-largest district by area but largely forested and tribal
- Gautam Buddha Nagar (Noida) saw very high growth due to NCR expansion, real estate development, and service-industry migration
- Kanpur Nagar had the slowest growth, reflecting industrial decline and outward migration
Comparison with National Averages
| Parameter | UP | India | Gap |
|---|---|---|---|
| Density | 829 | 382 | UP is 2.2x denser |
| Sex Ratio | 912 | 943 | UP is 31 below |
| Literacy | 67.72% | 73.00% | UP is 5.3% below |
| Decadal Growth | 20.23% | 17.72% | UP is 2.5% above |
| Urban % | 22.3% | 31.2% | UP is 8.9% below |
This comparison helps you move from rote learning to interpretation:
- higher density means greater pressure on land, jobs, housing, and services
- higher decadal growth adds to development pressure
- lower literacy and sex ratio point to social-development challenges
- lower urbanization shows that much of the state still depends on a rural base
Summary Cheat Sheet
| Item | Quick Fact |
|---|---|
| Census Baseline | As of 3 June 2026, official completed population census baseline remains Census 2011 |
| Total Population (2011) | 19,98,12,341 (~20 crore) |
| % of India | 16.51% (Rank: 1st) |
| Density | 829/sq km (Rank: 4th among states) |
| Sex Ratio | 912 (Child: 902) |
| Literacy | 67.72% (M: 77.28%, F: 57.18%) |
| Decadal Growth | 20.23% |
| SC % | 20.69% (highest absolute in India) |
| ST % | 0.57% (small share; Sonbhadra and Terai tribes are key examples) |
| Rural % | ~77.7% |
| Most Populous District | Prayagraj |
| Densest District | Ghaziabad |
| Best Sex Ratio District | Jaunpur |
| Highest Literacy District | Gautam Buddha Nagar |
| Lowest Literacy District | Shravasti |
Lesson Doubts
Ask questions, get expert answers