🧫 SOIL FERTILITY
SOIL FERTILITY.
LECTURE 13
. SOIL FERTILITY EVALUATION
Calibration, Correlation of crop responses, yield prediction,
fertilizer recommendation
SOIL TESTING RESEARCH IN INDIA
Farming is a business and, like all businesspersons, the farmer operates
farming business for profit. Obviously, to reach a decision before planting a crop,
a farmer needs all of the reliable information from the country’s soil evaluation
programme. In our country, system of fertility evaluation is being modified from
time to time in various stages incorporating crop response data.
Some Important landmarks in soil testing research in India:
Year Landmark
1953 Soil fertility and fertilizer use project
1955 Establishment of Soil Testing Laboratories
1956 All India Coordinated Agronomic Research
Project
1960s Establishment of Agricultural Universities
23 (1/16)
1967 All India Coordinated Research Project on Soil
Test Crop Response (STCR) correlation
1967 All India Coordinated Research Project on
Micronutrients in Soils and Plants
22 (6/6) 8 (6/6) 1970 All India Coordinated Research Project on Long
term Fertilizer Experiments
1980s Emphasis on fertilizer prescription for whole
cropping system based on initial soil tests.
Since Liebig’s time around 1840 many methods and approaches have
been tried to get a precise or workable basis for predicting the fertilizer
requirements of crops. The fertilizer use project initiated in 1953 following a
study by Stewart (1947) was the first systematic attempt in the whole of the
country to relate the knowledge of soils to the judicious use of fertilizers.
The establishment of soil testing laboratories was initiated in 1955-56.
The project on Model Agronomic Experiments on Experimental Farms
and Simple fertilizer trials on cultivators’ Fields was started in 1957. The Soil
Test Crop Response (STCR) correlation work carried out at Indian
Agricultural Research Institute, New Delhi had resulted in the selection of
soil test methods and categorizing the tests into low, medium, and high soil
fertility classes.
Soil fertility evaluation
Soils are very heterogeneous in respect to forms of nutrients they
contain, which greatly complicates the interpretation of Soil Test for
assessing fertilizer needs. The total amount of a nutrient present in a soil
offers little information relative to the amount of that nutrient which is
available. Numerous extracting solutions and procedures have been used to
remove nutrient elements from the soil, but none remove exactly the amount
that plant roots obtain.
This means that, in order to interpret the data, the results from each
analytical procedure must be correlated with the plant response obtained in
field experiments by applying that fertilizer nutrient.
By this calibration, the requirement of fertilizer is calculated for achieving
specific yield target. Soil fertility evaluation preferably employs a particular
method of calibration as per the utility of the outcome.
Crop Response Data
In nutrient rating experiments, soil test data is correlated with the
response of crop. The response is measured in terms of ‘percent yield’ or
‘percent yield increase’. Both represent the ratio of the yield obtained in
unfertilized soil (nutrient limiting deficient soil) to the yield in fertilizer nutrient
applied soil (non-limiting or nutrient sufficient soil). The yield in non-limiting
soil is otherwise known as maximum attainable yield or yield of standard
treatment with all nutrients applied.
While comparing native fertility, in experiments that are conducted at
different locations, percent yield is used.
Yield without fertilizer nutrient Percent yield =
Yield in standard treatment
X 100
While conducting multi location trials, or a pot experiment in a single
location with soils brought from different locations, percent yield increase is
worked out for every level of fertilizer application. The highest yield obtained
in the experiment with all fertilizer nutrient applied, is taken as Maximum
attainable yield
23 (2/16)
Yield at fertilizer
Yield without
Percent yield nutrient level fertilizer nutrient
X 100
increase =
nutrient level
Maximum attainable yield
The soils analyzed by standard nutrient extraction method are
grouped. The soil tests are calibrated into different fertility groups by various
procedures.
Present approaches in formulation of fertilizer recommendations extensively
used in India:
Soil testing programme was initially started adopting the International
soil fertility evaluation and improvement programme (Fitts, 1956). In this
approach much stress is laid on laboratory characterization, followed by
potted-plant studies ultimately leading to field - verification trials. These two
initial steps help in eliminating arbitrariness of field trials. However, this
approach had low adoption as it arrived one critical value below which
economic responses are possible. Later, many improvements were
suggested.
AGRONOMIC APPROACH
This is based on fertilizer rate experiments (recording yield at
increasing nutrient levels) conducted at many locations. The level at which
yields are high are recorded and averaged. From these results, the optimum
dose of fertilizer is recommended for a crop at given agro-climatic region.
Eg. A blanket dose of 120-50-50 kg/ha of N, P2O5, K2O respectively is
recommended for rice.
CRITICAL LIMIT APPROACH
Waugh and Fitts (1965) developed this technique which is largely
meant for less mobile nutrients like P, K and micronutrients. Soils vary
considerably in fixing capacities. Due to it a part of applied P, which is fixed
in soil, is not readily available to plants.
The method includes incubation study. For P, Soil is incubated for 72
hours with graded doses of soluble P in the form of monocalcium phosphate.
Then, the amount of phosphates released (extracted) with an extracting
reagent (Olsen or Bray) will be determined. The extracted P versus the
amount of P applied is plotted. If the relationship is unique, then for high P
fixing soils a larger amount of fertilizer P application is needed. This amount
of P fixed is estimated as X-value.
Critical limit
% Yield
0 2 4 6 8 10 12 14 16 18 20 22
Soil Test P
23 (6/16)
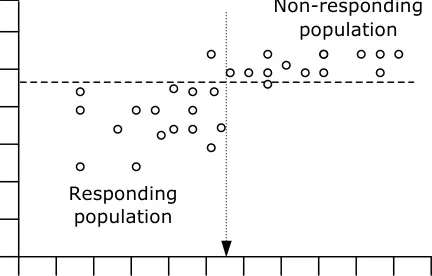
Then, in potted experiment fertilizer P is added at 0, 0.5X, X, 2X levels,
and the test crop was grown to find out the soil critical value. The percentage
yield obtained is plotted against the soil-test value for different soils. By using
a plastic overlay, these data are grouped into two populations as described by
Cate and Nelson (1965). The soil-test value where the vertical line crosses
the x-axis is designated as the soil critical limit.
Critical limit for the soil test value is the limit below which a positive
or economic response to added fertilizer is possible and above which the
response diminishes at a faster rate or vanishes .
The validity of critical value is verified by conducting verification trials
in the field locations where from the soil samples have been collected for pot
studies.
Summary Cheat Sheet
Key Recall Points
- SOIL FERTILITY is exam-relevant for SSAC122 and objective questions in soil science.
- Use soil-test based interpretation with focus on pH, CEC, and nutrient availability.
- Apply the 4R principle: right source, right rate, right time, and right method.
Exam Traps
- Do not mix up soil fertility concepts with fertilizer quantity alone.
- Numerical and term-based questions often test definitions, units, and threshold values.
- In problem-solving, interpretation must follow soil reaction, crop stage, and management context.
References
3 sources • [1] [2] [3]
References
ICAR e-Course: Soil Chemistry, Soil Fertility and Nutrient Management
OfficialBrady and Weil, The Nature and Properties of Soils
BookLesson Doubts
Ask questions, get expert answers