📊 Strip plot design
Strip plot design.
This lesson builds core statistical understanding for BSc Agriculture exam preparation through clear concepts, worked structures, and application-focused interpretation.
Strip plot design – layout – ANOVA Table
Strip Plot Design
This design is also known as split block design. When there are two factors in an experiment and both the factors require large plot sizes it is difficult to carryout the experiment in split plot design. Also the precision for measuring the interaction effect between the two factors is higher than that for measuring the main effect of either one of the two factors. Strip plot design is suitable for such experiments.
In strip plot design each block or replication is divided into number of vertical and horizontal strips depending on the levels of the respective factors.
Replication 1 Replication 2
a0 a2 a3 a1 a3 a0 a2 a1
b1 | | | | ---|---|---|---|--- b0 | | | | b2 | | | | b1 | | | | ---|---|---|---|--- b2 | | | | b0 | | | |
In this design there are plot sizes.
- Vertical strip plot for the first factor – vertical factor
- Horizontal strip plot for the second factor – horizontal factor
- Interaction plot for the interaction between 2 factors
The vertical strip and the horizontal strip are always perpendicular to each other. The interaction plot is the smallest and provides information on the interaction of the 2 factors. Thus we say that interaction is tested with more precision in strip plot design.
Analysis
The analysis is carried out in 3 parts.
- Vertical strip analysis
- Horizontal strip analysis
- Interaction analysis
Suppose that A and B are the vertical and horizontal strips respectively. The following two way tables, viz., A X Rep table, B X Rep table and A X B table are formed. From A X Rep table, SS for Rep, A and Error (a) are computed. From B X Rep table, SS for B and Error (b) are computed. From A X B table, A X B SS is calculated.
When there are r replications, a levels for factor A and b levels for factor B, then the ANOVA table is
X | d.f. | SS | MS | F
---|---|---|---|--- Replication | (r-1) | RSS | RMS | RMS/EMS (a) A | (a-1) | ASS | AMS | AMS/EMS (a) Error (a) | (r-1) (a-1) | ESS (a) | EMS (a) | B | (b-1) | BSS | BMS | BMS/EMS (b) Error (b) | (r-1) (b-1) | ESS (b) | EMS (b) | AB | (a-1) (b-1) | ABSS | ABMS | ABMS/EMS (c) Error (c) | (r-1) (a-1) (b-1) | E SS (c) | EMS (c) | Total (rab – 1) TSS
Analysis
Arrange the results as follows:
Treatment Combination | Replication | Total
---|---|---
R1 | R2 | R3 | …
A0B0 | a0b0 | a0b0 | a0b0 | … | T00 A0B1 | a0b1 | a0b1 | a0b1 | … | T01 A0B2 | a0b2 | a0b2 | a0b2 | … | T02 Sub Total | A01 | A02 | A03 | … | T0 A1B0 | a1b0 | a1b0 | a1b0 | … | T10 A1B1 | a1b1 | a1b1 | a1b1 | … | T11 A1B2 | a1b2 | a1b2 | a1b2 | … | T12 Sub Total | A11 | A12 | A13 | … | T1 . . . | . . . | . . . | . . . | . . . | . . . Total | R1 | R2 | R3 | … | G.T
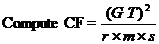 TSS = [ (a0b0)2 + (a0b1)2+(a0b2)2+…]-CF
- Vertical Strip Analysis
Form A x R Table and calculate RSS, ASS and Error(a) SS
Treatment | Replication | Total
---|---|---
R1 | R2 | R3 | …
A0 | A01 | A02 | A03 | … | T0 A1 | A11 | A12 | A13 | … | T1 A2 | A21 | A22 | A23 | … | T2 . . . | . . . | . . . | . . . | . . . | . . . Total | R1 | R2 | R3 | … | GT

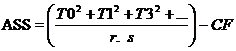
 Error (a) SS= A x R TSS-RASS-ASS.
- Horizontal Strip Analysis
Form B x R Table and calculate RSS, BSS and Error(b) SS
Treatment | Replication | Total
---|---|---
R1 | R2 | R3 | …
B0 | B01 | B02 | B03 | … | T0 B1 | B11 | B12 | B13 | … | T1 B2 | B21 | B22 | B23 | … | T2 . . . | . . . | . . . | . . . | . . . | . . . Total | R1 | R2 | R3 | … | GT
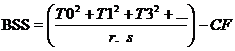

- Error (b) SS= B x R TSS-RSS-BSS
- Interaction Analysis Form A xB Table and calculate BSS, Ax B SSS and Error (b) SS
Treatment | Replication | Total
---|---|---
B0 | B1 | B2 | …
A0 | T00 | T01 | T02 | … | T0 A1 | T10 | T11 | T12 | … | T1 A2 | T20 | T21 | T22 | … | T2 . . . | . . . | . . . | . . . | . . . | . . . Total | C0 | C1 | C2 | … | GT
 ABSS= A x B Table SS – ASS- ABSS
Error (c) SS= TSS-ASS-BSS-ABSS –Error (a) SS.- –Error (a) SS
Then complete the ANOVA table.
ABSS= A x B Table SS – ASS- ABSS
Error (c) SS= TSS-ASS-BSS-ABSS –Error (a) SS.- –Error (a) SS
Then complete the ANOVA table.
---|---
Summary Cheat Sheet
- Focus: core definitions, classification logic, and design/analysis workflow from this lesson.
- Exam Use: revise key terms, assumptions, and interpretation steps for objective and descriptive questions.
- Practice: solve one representative numerical or conceptual question from this topic.
References
1 source • [1]
References
Standard BSc Agriculture Statistics notes used for lesson preparation.
Lesson Doubts
Ask questions, get expert answers