📊 t-test for two samples
t-test for two samples.
This lesson explains key concepts in a structured way and connects them to practical agricultural applications and exam-oriented understanding.
t-test for two samples
t-test for two samples and ANOVA with One-way classification
t-test for two samples assuming equal variances:
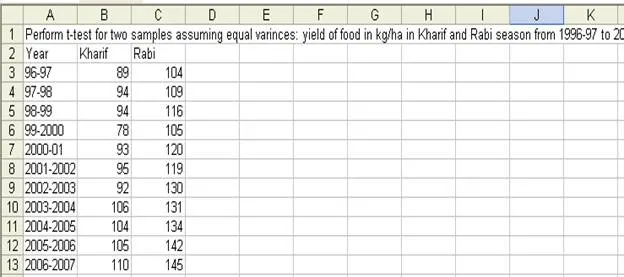
- Example: Perform t-test for two samples assuming equal variances for yield of food in kg/ha in Kharif and Rabi season from 1996-97 to 2006-07.
- The data is entered in Excel sheet as shown below:
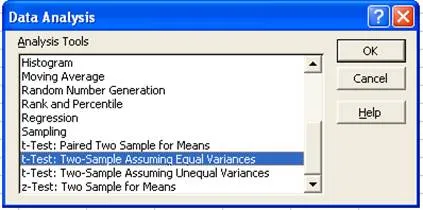
- Choose t-Test: Two-Samples assuming Equal Variances in the Data Analysis window:
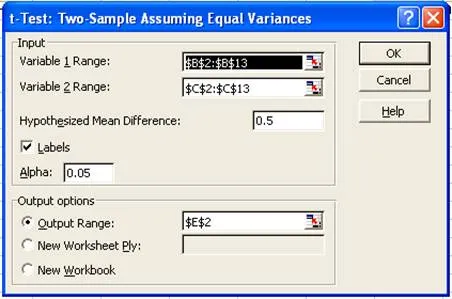
- In the t-Test: Two-Samples assuming Equal Variances window enter the Variable 1 Range and Variable 2 Range.
- Check the Labels option
- Hypothesized mean difference be 0.5
- Let Alpha value be 0.05
- Set output range as E2.
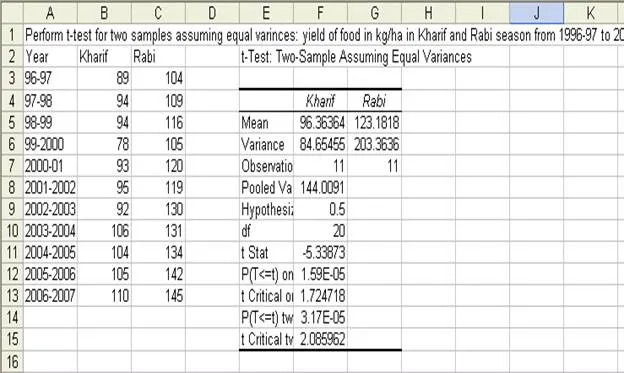
- The result will be displayed from E2 as shown below:
ANOVA(Analysis od Variances) with One-way Classification
- Example: Perform ANOVA One Way Classification for yield of food in kg/ha in three seasons from 1996-97 to 2006-07
- The data is entered in Excel sheet as follows:
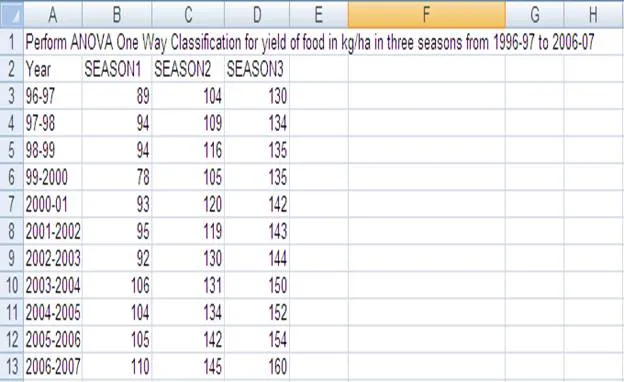
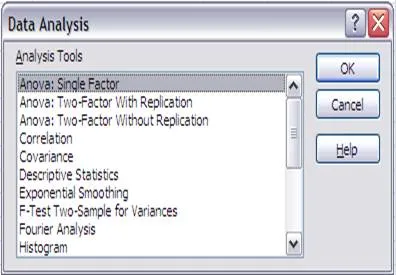
- Choose ANOVA: Single Factor from Data Analysis window.
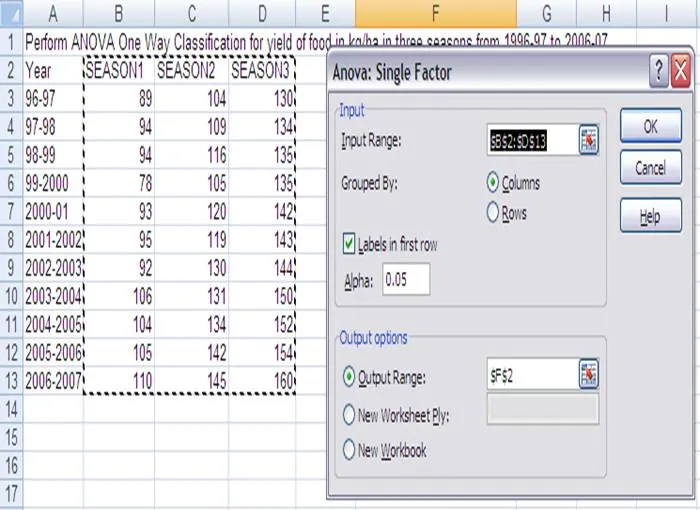
- In the ANOVA: Single Factor window enter the input range. The input range in the example is B2:D13
- Choose Group by Columns
- Check Labels in the first row
- Output range is set to F2 as follows:
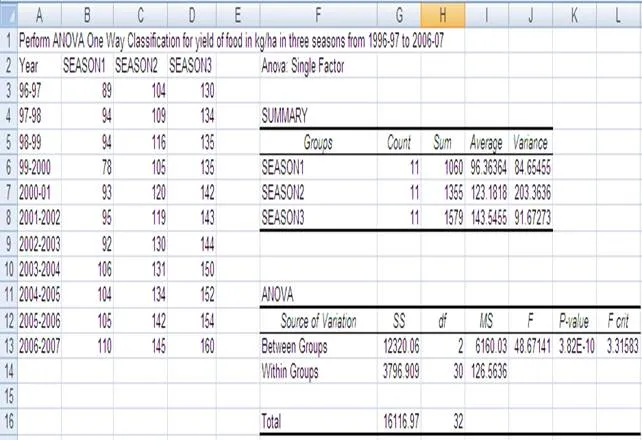
- The result of the ANOVA with One-way classification is displayed from F2 as shown below:
---|---
Summary Cheat Sheet
- Core concepts: revise definitions, components, and workflows from this lesson.
- Exam focus: memorize key terms, differences, and practical application points.
- Practice: apply the topic steps once in a real or simulated computer task.
References
2 sources • [1] [2]
References
[1]
Course Notes
[2]
AgriDots Lesson Source
Lesson Doubts
Ask questions, get expert answers