📃 Profit & Loss Account and Cash Flow Statement
Understanding the format of P&L Account, revenue recognition, expense classification, Cash Flow Statement types, and Fund Flow analysis for banking exams.
Why Do We Need a Profit & Loss Account?
A Balance Sheet tells a banker what a business owns and owes at a single point in time—like a photograph. But a photograph doesn't tell you if the business is running fast or slowly bleeding to death. Did sales grow this year? Are raw material costs eating up all the margins? Is the business actually generating enough money to repay a loan?
The Profit & Loss (P&L) Account (often called the Income Statement) answers these questions. It records all income earned and expenses incurred during a specific period (usually a financial year), and the final difference gives us the net profit or loss.
Think of it this way:
- Balance Sheet = A snapshot of your wealth on 31st March.
- P&L Account = A continuous video recording of every rupee earned and spent from 1st April to 31st March.
The Building Blocks: Debit and Credit
Before reading any financial statement, you must understand the basic accounting rule of what goes on which side.
Pro Content Locked
Upgrade to Pro to access this lesson and all other premium content.
₹99 charged monthly · Cancel anytime
- All Agriculture & Banking Courses
- AI Lesson Questions (100/day)
- AI Doubt Solver (50/day)
- Glows & Grows Feedback (30/day)
- AI Section Quiz (20/day)
- 22-Language Translation (100/day)
- Recall Questions (20/day)
- AI Quiz (15/day)
- AI Quiz Paper Analysis (100/day)
- AI Step-by-Step Explanations (100/day)
- Spaced Repetition Recall (FSRS)
- AI Tutor
- Immersive Text Questions
- Audio Lessons — Hindi & English
- Mock Tests & Previous Year Papers
- Summary & Mind Maps
- XP, Levels, Leaderboard & Badges
- Generate New Classrooms
- Voice AI Teacher (AgriDots Live)
- AI Revision Assistant
- Knowledge Gap Analysis
- Interactive Revision (LangGraph)
🔒 Secure via Razorpay · Cancel anytime · No hidden fees
Why Do We Need a Profit & Loss Account?
A Balance Sheet tells a banker what a business owns and owes at a single point in time—like a photograph. But a photograph doesn't tell you if the business is running fast or slowly bleeding to death. Did sales grow this year? Are raw material costs eating up all the margins? Is the business actually generating enough money to repay a loan?
The Profit & Loss (P&L) Account (often called the Income Statement) answers these questions. It records all income earned and expenses incurred during a specific period (usually a financial year), and the final difference gives us the net profit or loss.
Think of it this way:
- Balance Sheet = A snapshot of your wealth on 31st March.
- P&L Account = A continuous video recording of every rupee earned and spent from 1st April to 31st March.
The Building Blocks: Debit and Credit
Before reading any financial statement, you must understand the basic accounting rule of what goes on which side.
For the P&L Account:
| Left Side (Debit) | Right Side (Credit) |
|---|---|
| Expenses & Losses — what the business spent | Incomes & Gains — what the business earned |
| Rent, salaries, raw materials, interest, depreciation | Sales revenue, interest income, dividends received |
The difference = Profit (if right > left) or Loss (if left > right).
For the Balance Sheet (Indian Format):
| Left Side (Liabilities) | Right Side (Assets) |
|---|---|
| Sources of Funds — where the money came from | Uses of Funds — what the business owns |
| Owner's capital, bank loans, trade creditors | Cash, machinery, land, inventory, debtors |
🚨 Exam Alert: In Indian accounting (and for your banking exams), the Balance Sheet places Liabilities on the Left and Assets on the Right. This is strictly opposite to the US format (which puts Assets on the left). Always follow the Indian format!
How to quickly memorize this:
- P&L: Left = Money OUT (Expenses), Right = Money IN (Income)
- Balance Sheet: Left = WHO gave you the money (banks, owners), Right = WHAT you bought with it (machinery, stock).
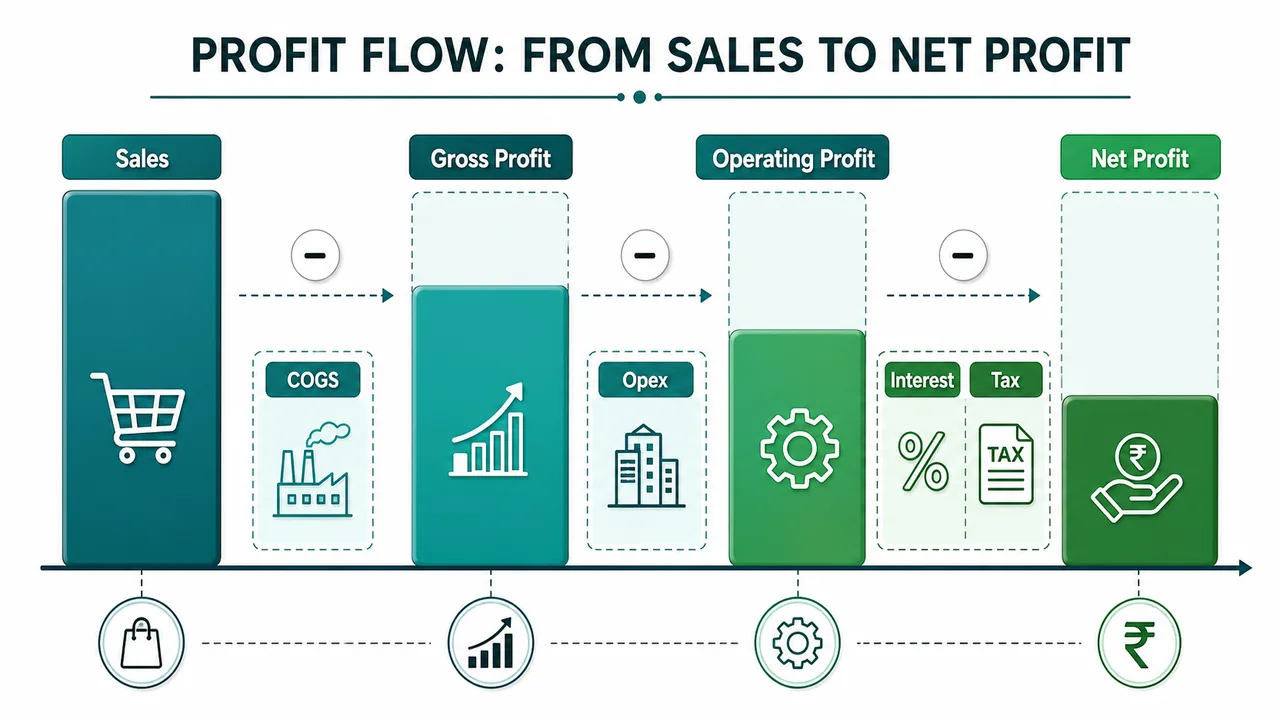
Building the P&L: From Sales to Net Profit
To truly understand a business, bankers don't just look at the final Net Profit. They read the P&L in stages. Let's build a P&L from scratch using a loan applicant's file.
The Loan File: Kavita Textiles
Kavita starts a garment manufacturing business. Here are her core transactions for her first year of operations:
1. The Setup:
- She invests her own capital: Rs. 50 Lakh
- Takes a bank loan: Rs. 30 Lakh
- Buys machinery & factory space: Rs. 40 Lakh
2. The Operations (The P&L stuff):
- Purchases raw cloth: Rs. 40 Lakh (25L cash + 15L on credit)
- Pays factory workers (direct labor): Rs. 8 Lakh
- Pays office rent and admin salaries: Rs. 6 Lakh
- Spends on marketing/distribution: Rs. 4 Lakh
- Pays interest to the bank: Rs. 3 Lakh
- Wear and tear on machinery (Depreciation): Rs. 4 Lakh
3. The Sales:
- She manufactured goods worth Rs. 90 Lakh.
- She sold garments worth Rs. 85 Lakh (35L cash + 50L on credit).
- She has unsold garments (Closing Stock) sitting in the warehouse worth Rs. 12 Lakh.
Let's build her financial statements step-by-step to see if she is actually profitable.
Stage 1: Trading Account (Gross Profit)
The Trading Account is the top half of the P&L. It strictly captures the core production economics — how much did it cost to physically make the goods vs how much were they sold for?
| Expenses (Debit) | Amount | Income (Credit) | Amount |
|---|---|---|---|
| Opening Stock | 0 | Sales (Cash + Credit) | 85 Lakh |
| Raw Material Purchased | 40 Lakh | Closing Stock (Unsold goods) | 12 Lakh |
| Direct Labour (Factory workers) | 8 Lakh | ||
| Gross Profit (c/d) | 49 Lakh | ||
| Total | 97 Lakh | Total | 97 Lakh |
How we calculate Cost of Goods Sold (COGS):
- COGS = Opening Stock + Purchases + Direct Labour - Closing Stock
- COGS = 0 + 40 + 8 - 12 = Rs. 36 Lakh
- Gross Profit = Sales (85) - COGS (36) = Rs. 49 Lakh
🏦 The Credit Officer's View: Gross Profit is a critical metric. It tells the banker if the core product is viable. If Kavita's Gross Profit margin starts shrinking year-over-year, it means either her raw material costs are spiking, or she is being forced to slash her selling prices to survive against competitors.
Stage 2: P&L Account (Operating & Net Profit)
Now we take that Gross Profit and subtract all the indirect overheads (rent, marketing, interest, depreciation) to find the final bottom line.
| Expenses (Debit) | Amount | Income (Credit) | Amount |
|---|---|---|---|
| Admin Expenses (rent, salaries) | 6 Lakh | Gross Profit (b/d) | 49 Lakh |
| Selling & Marketing Expenses | 4 Lakh | ||
| Depreciation on Machinery | 4 Lakh | ||
| Operating Profit (EBIT) | 35 Lakh | (Subtotal before interest) | |
| Interest on Bank Loan | 3 Lakh | ||
| Net Profit | 32 Lakh | ||
| Total | 49 Lakh | Total | 49 Lakh |
🏦 The Credit Officer's View: Bankers look very closely at Operating Profit (also known as EBIT - Earnings Before Interest & Taxes). Why? Because EBIT shows how much money the business made before paying the bank! If EBIT is Rs. 35 Lakh, and the bank interest is Rs. 3 Lakh, the banker knows Kavita can comfortably pay her interest 11 times over. This is called the Interest Coverage Ratio!
Net Profit = Gross Profit (49) - Operating Expenses (14) - Interest (3) = Rs. 32 Lakh
The Balance Sheet (for completeness)
Just to prove that our double-entry accounting works, let's look at Kavita's final Balance Sheet at the end of the year. Notice how the Rs. 32 Lakh Net Profit flows directly into the Reserves!
| Liabilities (Sources) | Amount | Assets (Uses) | Amount |
|---|---|---|---|
| Owner's Capital | 50 Lakh | Factory Machinery (40 - 4 depreciation) | 36 Lakh |
| Bank Loan | 30 Lakh | Closing Stock (Unsold garments) | 12 Lakh |
| Mehta Fabrics (Trade Creditor) | 5 Lakh | Reliance Retail (Trade Debtor) | 10 Lakh |
| Net Profit (Added to Reserves) | 32 Lakh | Cash & Bank Balance | 59 Lakh |
| Total | 117 Lakh | Total | 117 Lakh |
How did we get 59 Lakh Cash? She started with 80L (Capital + Loan). She spent 96L (machinery, cloth, labour, rent, interest, paying Mehta). She received 75L (cash sales + Reliance paying their bill). 80 - 96 + 75 = 59 Lakh.
🏦 The Golden Rule of Banking: Kavita made Rs. 32 Lakh in Profit, but she has Rs. 59 Lakh in Cash. If she had sold everything on credit, she might show a massive profit but have zero cash to pay her EMI! This is the most important lesson in credit appraisal: Profit is an accounting opinion; Cash is a hard fact. This is exactly why bankers demand a Cash Flow Statement.
Schedule III Format (Companies Act, 2013)
While Kavita's simple P&L is great for understanding the concepts, registered companies cannot use their own formats.
Under the Companies Act, 2013, all companies must submit a standardized, vertical P&L Account called the Statement of Profit and Loss (Schedule III).
Bankers love this format because it forces companies to separate their core operating business from one-time flukes. Here is the official structure, broken down into what bankers actually look for:
Part 1: The Top Line (Revenue)
| Particulars | Note No | Current Year |
|---|---|---|
| I. Revenue from operations (Core business sales) | ||
| II. Other Income (Rent, dividends, selling scrap) | ||
| III. Total Revenue (I + II) |
🚨 Credit Officer Trap: Always check "Other Income". A failing company might show a profit just because they sold an old warehouse (Other Income). If "Revenue from operations" is dropping, the core business is dying, regardless of the Total Revenue.
Part 2: The Burn (Expenses)
| Particulars | Note No | Current Year |
|---|---|---|
| IV. Expenses: | ||
| Cost of materials consumed | ||
| Purchases of stock-in-trade | ||
| Changes in inventories of FG and stock-in-trade | ||
| Employee benefit expense (Salaries) | ||
| Finance costs (Interest paid to banks) | ||
| Depreciation & amortisation expense | ||
| Other expenses (Rent, admin, marketing) | ||
| Total Expenses |
Part 3: The Noise (Exceptional & Extraordinary Items)
| Particulars | Note No | Current Year |
|---|---|---|
| V. Profit before exceptional and extraordinary items (III - IV) | ||
| VI. Exceptional items (e.g., massive write-off of bad inventory) | ||
| VII. Profit before extraordinary items (V - VI) | ||
| VIII. Extraordinary items (e.g., earthquake destroying a factory) | ||
| IX. Profit before tax (VII - VIII) |
🏦 Why separate these? Bankers want to know the sustainable profit (Item V). If a company lost 50 Lakhs because of a freak flood (Extraordinary Item), the banker shouldn't penalize their core business rating, because a flood won't happen every year.
Part 4: The Bottom Line (Taxes & Final Profit)
| Particulars | Note No | Current Year |
|---|---|---|
| X. Tax expense: (1) Current tax (2) Deferred tax | ||
| XI. Profit (Loss) from continuing operations (IX - X) | ||
| XII. Profit/(Loss) from discontinuing operations (Divisions being shut down) | ||
| XIII. Tax expense of discontinuing operations | ||
| XIV. Profit/(Loss) from discontinuing operations (after tax) | ||
| XV. Profit (Loss) for the period (XI + XIV) | ||
| XVI. Earnings per equity share: (1) Basic (2) Diluted |
1. Revenue from Operations vs. Other Income
Schedule III strictly separates Core Revenue from Other Income. Why? Because the core revenue is sustainable, while other income is often a one-off fluke. Note how this changes depending on the business type:
| Item | Non-Finance Company (e.g., Tata Motors) | Finance Company (e.g., HDFC Bank) |
|---|---|---|
| Interest Income | Other Income (Just extra cash in FD) | Revenue from Operations (Core business!) |
| Dividend Income | Other Income (Investments) | Revenue from Operations (If trading shares) |
| Sale of Products | Revenue from Operations (Selling cars) | Not Applicable |
2. Finance Costs
Bankers look here to see exactly how much debt burden the company is carrying. This includes:
- Interest expense on borrowings (Term Loans, CC/OD limits)
- Bank processing fees and loan guarantee charges
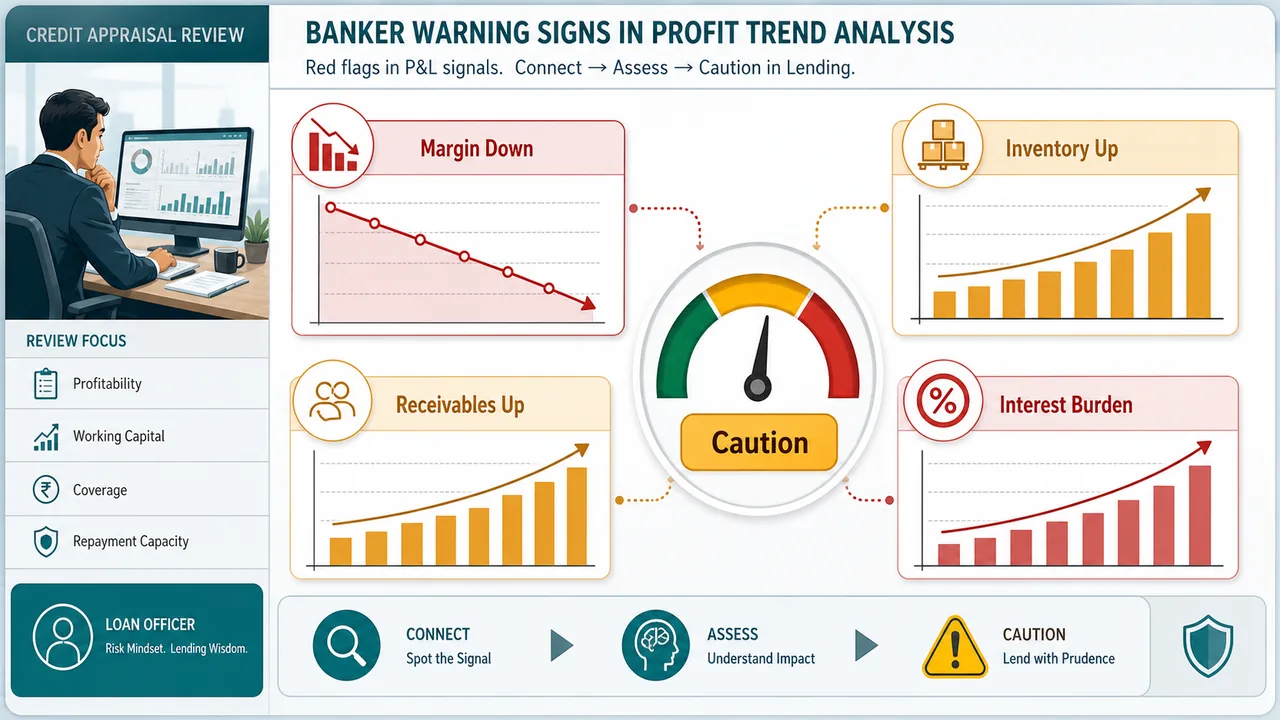
Analyzing Profit Trends: The Credit Officer's Playbook
When a banker evaluates a loan proposal, they never look at just one year. A single year can be manipulated. Bankers always demand 3 to 5 years of audited financials to spot trends. Here is what they look for:
1. The Sales Trend (Top-Line Growth)
| Trend | The Banker's Translation |
|---|---|
| Consistently increasing (>10%) | Healthy demand. The business is successfully capturing market share. |
| Flat or stagnant (2-5%) | 🚨 The Inflation Trap: If inflation is 6% and sales grew by 3%, the company actually sold fewer products this year! They just raised prices. This is a massive warning sign. |
| Declining | Red flag. The product is becoming obsolete, or competitors are winning. |
2. Margin Analysis
Bankers track these three margins religiously over a 3-year period to spot hidden problems:
| Metric | Formula | What It Reveals |
|---|---|---|
| Gross Profit Margin | (Gross Profit / Sales) × 100 | Pricing Power: If this drops, it means raw material costs are rising, but the company is too scared to raise prices on its customers. |
| Operating Profit (EBIT) Margin | (EBIT / Sales) × 100 | Core Efficiency: How well the business runs before the bank takes its interest cut. |
| Net Profit Margin | (Net Profit / Sales) × 100 | Bottom Line: What the owners actually take home. |
Example using Kavita Textiles:
- Gross Profit Margin = (49 / 85) x 100 = 57.6% (Excellent for a manufacturing unit)
- Net Profit Margin = (32 / 85) x 100 = 37.6% (Extremely healthy)
3. Red Flags in the P&L
If a credit officer spots any of these trends, the loan application goes under extreme scrutiny:
| Warning Sign | The Banking Reality |
|---|---|
| Debtors growing faster than Sales | The Channel Stuffing Trap: The company is desperately shipping products to dealers on huge credit terms just to record fake "sales" for the year. |
| Inventory growing faster than Sales | The company is producing goods that nobody wants to buy. That inventory will soon become dead stock. |
| Raw Material cost jumping suddenly | The company has lost its supplier discounts, or global prices spiked (like cotton or steel). |
| High Repair costs vs. Zero Depreciation | The company is using completely broken, outdated machinery instead of investing in new assets. |
| Administrative Expenses spiking | The owners are likely siphoning off money through inflated "consulting fees" or massive salary hikes for themselves. |
The Gap: Why Profit Does Not Equal Cash
This is one of the most important concepts in financial analysis, and it's frequently tested in banking exams.
Kavita Textiles made Rs. 32 Lakh profit. But does she have Rs. 32 Lakh extra cash sitting in her drawer? No. Here's why:
| Factor | Amount | Effect on Actual Cash |
|---|---|---|
| Sold goods on credit to Reliance Retail | Rs. 50 Lakh | Recorded as 'Income' on P&L, but the cash hasn't arrived yet! |
| Bought cloth on credit from Mehta | Rs. 15 Lakh | Recorded as 'Expense' on P&L, but the cash hasn't left her bank account yet. |
| Depreciation charged | Rs. 4 Lakh | Recorded as 'Expense' on P&L, but no cash went out (you don't write a cheque to your machinery). |
| Unsold stock sitting in warehouse | Rs. 12 Lakh | Cash was heavily spent to produce this, but it hasn't been recovered through sales yet. |
🚨 The Banker's Nightmare: Accounts are prepared on an accrual basis — income is recorded when a bill is generated, not when cash is received. This is exactly why a profitable company can go bankrupt. They might show massive profits on paper, but have zero cash to pay their loan EMIs.
Cash Flow Statement
What Is It?
If the P&L is a video of business performance, the Cash Flow Statement is a harsh spotlight on the actual bank account. It explains exactly how cash moved from the opening balance to the closing balance.
The Three Engines of Cash
Every single cash movement falls into one of three buckets:
| Bucket | What It Covers | The Banker's Question |
|---|---|---|
| 1. Operating Activities (The Core Engine) | Cash from day-to-day business (sales, salaries, suppliers) | Can the business survive on its own? |
| 2. Investing Activities (The Growth Engine) | Purchase/sale of long-term assets (buying factories) | Is the business expanding or selling off its parts? |
| 3. Financing Activities (The Funding Engine) | Capital, bank loans, loan repayments, dividends | How is this business being funded? |
Operating Activities (The Most Critical Bucket)
This MUST be positive. If a company consistently generates negative operating cash flow, it is burning cash to stay alive. It will eventually default on its loans, no matter how profitable the P&L looks.
Kavita Textiles — Operating Cash Flow:
- Received from customers: +75 Lakh
- Paid for raw materials/labour/admin: -53 Lakh
- Paid for interest: -3 Lakh
- Net Operating Cash Flow = +19 Lakh
(Notice how her Operating Cash Flow of 19 Lakh is much lower than her Net Profit of 32 Lakh. This is because cash is trapped in unsold stock and unpaid debtors!)
Complete Cash Flow Summary for Kavita
| Activity | Amount |
|---|---|
| Operating Activities | +19 Lakh |
| Investing Activities (Bought factory) | -40 Lakh |
| Financing Activities (Owner's capital + Bank loan) | +80 Lakh |
| Net Change in Cash | +59 Lakh |
This exactly matches our Balance Sheet cash balance of Rs. 59 Lakh.
The Cheat Code: How Working Capital Affects Cash Flow
This is a favourite exam topic. The rule is simple, but students often get confused.
Current Assets (Debtors, Inventory, Prepaid Expenses): When Current Assets increase, Cash DECREASES.
- Logic: If you buy extra stock, your cash is trapped on the warehouse floor. If you give customers more credit (Debtors increase), your cash is trapped in their pockets.
Current Liabilities (Creditors, Borrowings, Income in Advance): When Current Liabilities increase, Cash INCREASES.
- Logic: If your supplier gives you an extra 30 days to pay (Creditors increase), you get to keep that cash in your bank account for 30 more days.
🧠 Memory Rule: Current Assets move opposite to cash. Current Liabilities move in the same direction as cash.
Preparation: Direct vs. Indirect Method
Bankers almost exclusively look at the Indirect Method because it forces the borrower to explain where their Net Profit disappeared to.
| Method | Approach |
|---|---|
| Direct Method | Just lists actual cash receipts and payments (like a simple bank statement). |
| Indirect Method | Starts with Net Profit and manually adjusts it by adding back non-cash expenses (like depreciation) and subtracting trapped cash (like rising inventory). |
Indirect method example (Kavita Textiles):
- Start with Net Profit: +32 Lakh
- Add back Depreciation (no cash left the building): +4 Lakh
- Less: Money trapped in new Debtors: -10 Lakh
- Less: Money trapped in Unsold Stock: -12 Lakh
- Add: Cash saved by not paying Creditors yet: +5 Lakh = Operating Cash Flow: 19 Lakh
Fund Flow Statement
What Is It?
While Cash Flow tracks actual cash, the Fund Flow statement tracks changes in Working Capital between two balance sheet dates. (In accounting, "Fund" = Working Capital).
🚨 The Exam Hack: When Does a "Flow" Occur?
This is tested in almost every banking exam. A flow of funds ONLY occurs when a transaction crosses the boundary between "Current" and "Non-Current".
| Transaction Type | Flow of Funds? | Example |
|---|---|---|
| Both accounts are Current | ❌ No flow | Cash paid to creditor (Cash ↓, Creditor ↓ — both are current, so working capital stays identical) |
| Both accounts are Non-Current | ❌ No flow | Land exchanged for machinery (Both non-current) |
| One Current + One Non-Current | ✅ Flow occurs | Machinery bought for cash (Cash ↓ current, Machinery ↑ non-current) |
Sources and Uses of Funds
| Sources (Inflow of Funds) | Uses (Outflow of Funds) |
|---|---|
| Issue of new shares | Repayment of long-term debt |
| Taking long-term loans | Buying fixed assets |
| Sale of fixed assets | Payment of dividends |
| Funds from operations (Net Profit + Depreciation) | Operational losses |
Key Rule: Taking a loan is a source of funds. Repaying a loan is a use of funds.
Cash Flow vs. Fund Flow: The Final Comparison
| Feature | Cash Flow Statement | Fund Flow Statement |
|---|---|---|
| Focuses on | Cash and bank balances ONLY | Working Capital (All current assets & liabilities) |
| Tells the banker | Can they pay next month's EMI? | How is long-term money being used? |
| Mandatory? | Yes, legally required by Companies Act | No, but heavily used by bank credit teams |
| Future projection | Use a Cash Budget | Not used for projections |
Terminal Questions: MCQ Practice Questions
Question 1
Which financial statement focuses specifically on cash movements rather than working capital?
- Balance Sheet
- Cash Flow Statement
- Fund Flow Statement
- Income Statement
Answer
Correct Answer: 2 — Cash Flow Statement
Why this is correct: The Cash Flow Statement strictly tracks the movement of cash and cash equivalents. Bankers use it to verify if a company has actual liquidity to pay its EMIs.
Why others are wrong:
- Balance Sheet: Shows a snapshot of assets and liabilities, not cash movements over time.
- Fund Flow Statement: Tracks changes in broader working capital, not just cash.
- Income Statement: Prepared on an accrual basis, so it shows paper profit, not actual cash flow.
Question 2
Which of the following is a SOURCE of cash, not a use?
- Buying new machinery
- Profitable operations
- Redemption of debentures
- Paying cash dividends
Answer
Correct Answer: 2 — Profitable operations
Why this is correct: Profitable operations (when adjusted for non-cash items) generate a net inflow of cash into the business. This is the primary source of cash that keeps the 'Operating Engine' running.
Why others are wrong:
- Buying new machinery: Cash goes out to the supplier (Investing outflow).
- Redemption of debentures: Cash goes out to repay bondholders (Financing outflow).
- Paying cash dividends: Cash goes out to shareholders (Financing outflow).
Question 3
A decrease in debtors (accounts receivable) indicates that:
- Cash collections are less than credit sales
- Cash collections are greater than credit sales
- All sales are on credit
- Cash sales have stopped
Answer
Correct Answer: 2 — Cash collections are greater than credit sales
Why this is correct: If the outstanding debtor balance went down, it means the company collected more old cash from customers than the new credit sales it added to the books. The 'trapped cash' was released!
Why others are wrong:
- If cash collections were less than credit sales, the debtor balance would increase (this is a red flag known as the Channel Stuffing Trap).
- Options 3 and 4 are completely unrelated to the specific collection dynamic of the debtor account.
Question 4
An increase in inventory implies that cash outflow is:
- Equal to cost of goods sold
- Less than cost of goods sold
- Greater than cost of goods sold
- Unrelated to cost of goods sold
Answer
Correct Answer: 3 — Greater than cost of goods sold
Why this is correct: If inventory levels increased over the year, the company physically bought or produced more goods than it actually sold (COGS). That means extra cash left the bank account and is now trapped sitting as physical stock on the warehouse floor.
Why others are wrong:
- If outflow was equal to COGS, inventory levels would remain flat.
- If outflow was less than COGS, inventory levels would have decreased (meaning they sold off old stock).
Question 5
Which tool is used for FUTURE cash projections?
- Fund Flow Statement
- Cash Flow Statement
- Trial Balance
- Cash Budget
Answer
Correct Answer: 4 — Cash Budget
Why this is correct: A Cash Budget estimates future cash inflows and outflows. Credit officers demand Cash Budgets to verify if the borrower will have enough cash to service next year's debt.
Why others are wrong:
- Cash Flow & Fund Flow Statements: These are purely historical (they only show what happened last year).
- Trial Balance: A historical accounting check to ensure debits equal credits.
Question 6
The primary objective of a Profit and Loss Account is to determine:
- The financial position of the company
- The solvency of the company
- The profitability of the company
- The cash flows of the company
Answer
Correct Answer: 3 — The profitability of the company
Why this is correct: The P&L (Income Statement) matches all earned incomes against incurred expenses over a specific period to calculate the Net Profit or Loss.
Why others are wrong:
- Financial position & Solvency: These are determined by analyzing the Balance Sheet (assets vs liabilities).
- Cash flows: Determined by the Cash Flow Statement, since P&L operates on an accrual basis (paper profit).
Question 7
An increase in current liabilities results in:
- Funds outflow
- Funds inflow
- No change in funds
- Decrease in working capital
Answer
Correct Answer: 2 — Funds inflow
Why this is correct: When current liabilities increase (e.g., you delay paying your supplier for raw materials), you get the goods but keep the cash in your pocket. Because you preserved cash that you otherwise would have spent, it acts as an effective inflow of funds.
Why others are wrong:
- Funds outflow: This happens when current liabilities decrease (because you spent cash to pay off the supplier).
- Decrease in working capital: Working capital technically decreases (CA - CL), but the direction of the flow is an inflow.
Question 8
Fund flow occurs when a transaction involves:
- Two current accounts
- Two non-current accounts
- One current and one non-current account
- Only cash accounts
Answer
Correct Answer: 3 — One current and one non-current account
Why this is correct: This is the golden rule of Fund Flow. A flow (change in working capital) only occurs when a transaction crosses the boundary between a current item and a non-current item (e.g., buying a non-current machine using current cash).
Why others are wrong:
- Two current accounts: E.g., paying a creditor with cash. Both decrease, so total working capital is unchanged (no flow).
- Two non-current accounts: E.g., trading land for machinery. Neither affects working capital.
Terminal Questions: Key Takeaways
- P&L Account shows income vs expenses over a period — it reveals profitability
- Trading Account gives Gross Profit (Sales minus Cost of Goods Sold); P&L Account gives Net Profit (after all overheads)
- Schedule III of Companies Act, 2013 prescribes the mandatory P&L format
- Revenue from operations differs: product/service sales for regular companies, interest income for finance companies
- Bankers analyze 3-5 year trends — look at sales growth, margin changes, and expense patterns
- Profit ≠ Cash — accrual accounting means income is recorded when earned, not when cash is received
- Cash Flow Statement has 3 parts: Operating (must be positive), Investing, and Financing
- Operating cash flow must be positive — a business that can't generate cash from operations will eventually fail
- Current asset increase reduces cash flow; Current liability increase boosts cash flow
- Indirect method: Start with Net Profit → Add back depreciation → Adjust for working capital changes = Operating Cash Flow
- Fund Flow tracks working capital changes; fund flow occurs only when one current + one non-current account are involved
- Sources of funds: share issues, asset sales, long-term borrowings, operating profit
- Uses of funds: asset purchases, debt repayment, dividend payments
- Cash Flow is historical — use Cash Budget for future projections
- EBIT (Earnings Before Interest and Tax) = Operating Profit — measures core business performance independent of financing decisions
Summary Cheat Sheet
| Concept / Topic | Key Details / Explanation |
|---|---|
| P&L Account Purpose | Records all income earned and expenses incurred during a period; determines profit or loss |
| Balance Sheet vs P&L | BS = snapshot (position at a date); P&L = movie (performance over a period) |
| P&L Debit Side | Expenses (rent, salaries, raw materials, interest, depreciation) |
| P&L Credit Side | Incomes (sales revenue, interest income, dividends received) |
| Indian BS Format | Liabilities on left, Assets on right (opposite to US format) |
| Trading Account | Calculates Gross Profit = Sales - Cost of Goods Sold |
| COGS Formula | Opening Stock + Purchases + Direct Labour - Closing Stock |
| P&L Account (Stage 2) | Net Profit = Gross Profit - All Indirect Expenses (admin, selling, interest, depreciation) |
| Gross Profit Margin | (Gross Profit / Sales) x 100 — measures pricing power and production efficiency |
| Net Profit Margin | (Net Profit / Sales) x 100 — measures overall cost control and profitability |
| EBIT (Operating Profit) | Profit before Interest and Tax — core business performance ignoring financing |
| Schedule III P&L Format | Revenue from Operations + Other Income = Total Revenue; less Total Expenses = Profit before exceptional items; then exceptional, extraordinary, tax adjustments |
| Revenue — Non-Finance Co. | Sale of products, sale of services, other operating revenues (less Excise Duty) |
| Revenue — Finance Co. | Interest income, other financial services income |
| Finance Costs | Interest on borrowings, other borrowing costs, applicable net forex loss |
| P&L Red Flags | Raw materials rising faster than sales; high sales returns; debtors growing faster than sales; excessive inventory build-up; increasing bad debts; sudden admin expense jump |
| Profit ≠ Cash | Accounts prepared on accrual basis; income recorded when earned, not when cash received |
| Why Profitable Co. Can Fail | Profit on paper but no cash to pay salaries, suppliers, or loan EMIs |
| Cash Flow Statement | Shows actual movement of cash; reconciles opening to closing cash balance |
| 3 Cash Flow Categories | Operating (day-to-day survival), Investing (long-term asset growth), Financing (funding sources) |
| Operating Cash Flow | Must be positive for business survival; cash from sales collections minus payments to suppliers/employees/taxes |
| Investing Activities | Purchase/sale of long-term assets (machinery, property, investments) |
| Financing Activities | Capital infusion, bank loans, loan repayments, dividends |
| Working Capital & Cash Flow | Current asset increase = cash flow decreases; Current liability increase = cash flow increases |
| Memory Rule | CA and cash flow move in opposite directions; CL and cash flow move in same direction |
| Direct Method | Lists actual cash receipts and payments |
| Indirect Method | Starts with Net Profit → add back depreciation → adjust for working capital changes = Operating Cash Flow (more commonly used) |
| Cash Flow for Bankers | Validates profitability, shows debt repayment ability, measures operational efficiency |
| Cash Flow = Historical | For future projections, use Cash Budget (not cash flow statement) |
| Fund Flow Statement | Tracks changes in working capital (CA - CL) between two BS dates |
| "Fund" in Accounting | = Working Capital for most purposes |
| Fund Flow Occurs When | Transaction involves one current + one non-current account |
| No Fund Flow | Both accounts current (e.g., cash to creditor) or both non-current (e.g., land for machinery) |
| Sources of Funds | Share issues, long-term borrowings, sale of fixed assets, funds from operations (NP + Depreciation) |
| Uses of Funds | Purchase of fixed assets, repayment of long-term debt, redemption of debentures, payment of dividends |
| Cash Flow vs Fund Flow | Cash Flow = cash & equivalents only, mandatory; Fund Flow = working capital changes, not mandatory but useful for bank analysis |
Lesson Doubts
Ask questions, get expert answers