📈 Ratio Analysis
Understanding financial ratios including liquidity ratios, current ratio, quick ratio, and net working capital calculations for banking exams.
What is a Financial Ratio?
A financial ratio is a relationship between two or more financial variables — it converts raw numbers into meaningful comparisons. For example, comparing sales and stocks to calculate the stock turnover ratio.
How Ratios are Expressed
Financial ratios can be expressed in three ways:
| Format | Example | Meaning |
|---|---|---|
| As a Percentage (%) | Net profit is 5% of sales | Profit = 5 rupees for every 100 rupees of sales |
| As a Proportion | Current ratio is 2:1 | For every 2 rupees of CA, there is 1 rupee of CL |
| As Number of Times | Sales are 10 times of stocks | Sales volume is 10x the stock value |
Types of Financial Ratios
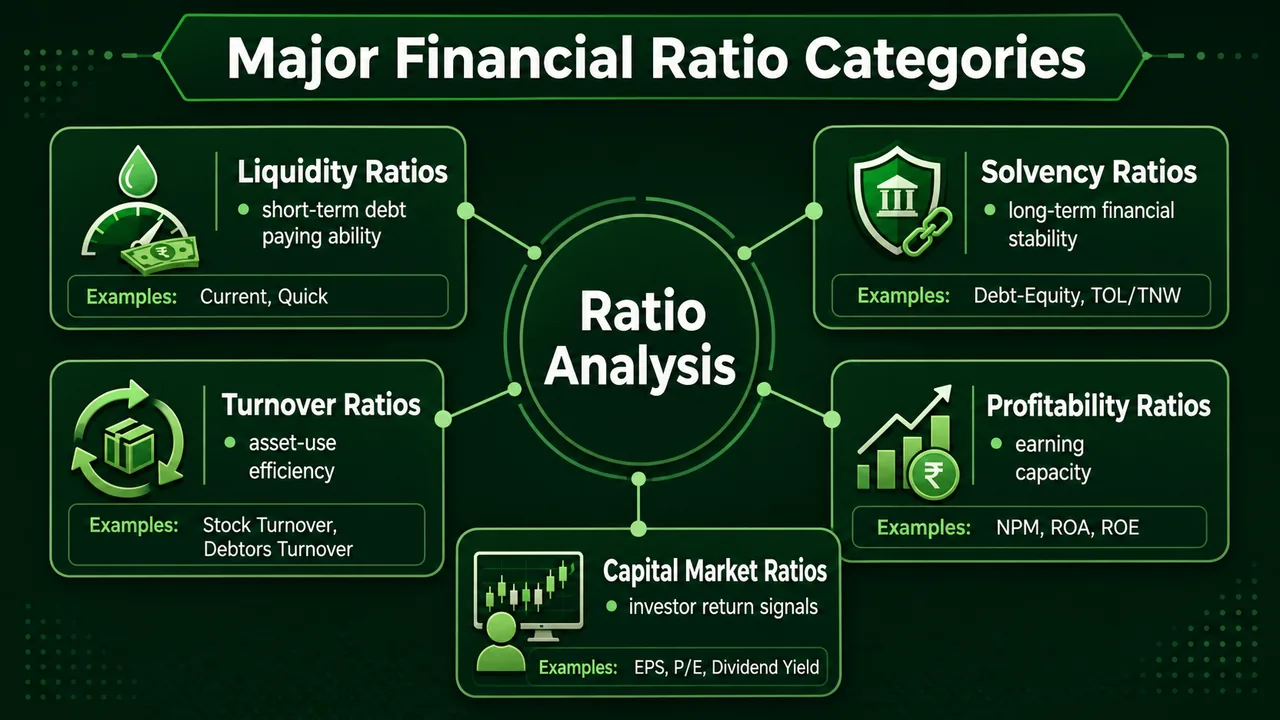
Financial ratios are classified into 5 major categories:
| Category | Purpose | Key Ratios |
|---|---|---|
| 1. Liquidity Ratios | Measure short-term ability to pay debts (can the firm meet obligations due within 1 year?) | Current Ratio, Quick Ratio |
| 2. Solvency Ratios | Measure long-term financial stability (can the firm survive over years?) | Debt-Equity Ratio, TOL/TNW |
| 3. Turnover Ratios | Measure efficiency of asset utilization (how fast are assets converted to revenue?) | Stock Turnover, Debtors Turnover |
| 4. Profitability Ratios | Measure earning capacity (how much profit per rupee of sales/capital?) | Net Profit Margin, ROA, ROE |
| 5. Capital Market Ratios | Measure investor returns (used by stock market investors) | EPS, P/E Ratio, Dividend Yield |
Interpreting Ratios: Key Principles
Before diving into individual ratios, understand these universal principles that apply to every ratio:
Interactive Preview
Try the embedded exercise below. Full lesson access still requires Pro.
Pro Content Locked
Upgrade to Pro to access this lesson and all other premium content.
₹99 charged monthly · Cancel anytime
- All Agriculture & Banking Courses
- AI Lesson Questions (100/day)
- AI Doubt Solver (50/day)
- Glows & Grows Feedback (30/day)
- AI Section Quiz (20/day)
- 22-Language Translation (100/day)
- Recall Questions (20/day)
- AI Quiz (15/day)
- AI Quiz Paper Analysis (100/day)
- AI Step-by-Step Explanations (100/day)
- Spaced Repetition Recall (FSRS)
- AI Tutor
- Immersive Text Questions
- Audio Lessons — Hindi & English
- Mock Tests & Previous Year Papers
- Summary & Mind Maps
- XP, Levels, Leaderboard & Badges
- Generate New Classrooms
- Voice AI Teacher (AgriDots Live)
- AI Revision Assistant
- Knowledge Gap Analysis
- Interactive Revision (LangGraph)
🔒 Secure via Razorpay · Cancel anytime · No hidden fees
What is a Financial Ratio?
A financial ratio is a relationship between two or more financial variables — it converts raw numbers into meaningful comparisons. For example, comparing sales and stocks to calculate the stock turnover ratio.
How Ratios are Expressed
Financial ratios can be expressed in three ways:
| Format | Example | Meaning |
|---|---|---|
| As a Percentage (%) | Net profit is 5% of sales | Profit = 5 rupees for every 100 rupees of sales |
| As a Proportion | Current ratio is 2:1 | For every 2 rupees of CA, there is 1 rupee of CL |
| As Number of Times | Sales are 10 times of stocks | Sales volume is 10x the stock value |
Types of Financial Ratios
Financial ratios are classified into 5 major categories:
| Category | Purpose | Key Ratios |
|---|---|---|
| 1. Liquidity Ratios | Measure short-term ability to pay debts (can the firm meet obligations due within 1 year?) | Current Ratio, Quick Ratio |
| 2. Solvency Ratios | Measure long-term financial stability (can the firm survive over years?) | Debt-Equity Ratio, TOL/TNW |
| 3. Turnover Ratios | Measure efficiency of asset utilization (how fast are assets converted to revenue?) | Stock Turnover, Debtors Turnover |
| 4. Profitability Ratios | Measure earning capacity (how much profit per rupee of sales/capital?) | Net Profit Margin, ROA, ROE |
| 5. Capital Market Ratios | Measure investor returns (used by stock market investors) | EPS, P/E Ratio, Dividend Yield |
Interpreting Ratios: Key Principles
Before diving into individual ratios, understand these universal principles that apply to every ratio:
- A single ratio isn't inherently good or bad — it must be viewed against past data, industry standards, and market conditions
- A consistent high debt-equity ratio is less concerning than a sudden spike, which might indicate unplanned borrowing
- Bankers focus on debt servicing capacity (interest + principal coverage)
- Investors prioritize return on equity and dividend yield
NOTE
Always compare ratios across time (trend analysis) and peers (industry benchmarks) before drawing conclusions. A ratio in isolation can be misleading.
Important Terms for Ratio Analysis
Before diving into ratios, let's understand key terms using a sample balance sheet. These terms appear in almost every ratio formula, so mastering them here will pay off throughout this chapter:
Sample Balance Sheet
| Liabilities (Sources) | Amount | Assets (Uses) | Amount |
|---|---|---|---|
| Networth or Equity | 30 | Fixed Assets | 40 |
| Long term liabilities or Debt | 50 | Non-current assets | 10 |
| Current liabilities | 40 | Intangible Assets | 10 |
| Current Assets | 60 | ||
| Total Liabilities | 120 | Total Assets | 120 |
Key Calculations
| Sr. | Term | Formula | Calculation | Result |
|---|---|---|---|---|
| 1 | Net Worth (NW) | Capital + Reserves | Given | 30 |
| 2 | Tangible Net Worth (TNW) | NW − Intangible Assets | 30 − 10 | 20 |
| 3 | Long Term Liabilities (LTL) | Term Loans + Debentures | Given | 50 |
| 4 | Long Term Sources (LTS) | NW + LTL | 30 + 50 | 80 |
| 5 | Current Liabilities (CL) | Short Term Sources | Given | 40 |
| 6 | Total Outside Liabilities (TOL) | LTL + CL | 50 + 40 | 90 |
| 7 | Long Term Uses (LTU) | FA + NCA + IA | 40 + 10 + 10 | 60 |
| 8 | Current Assets (CA) | Short Term Uses = WC | Given | 60 |
| 9 | Net Working Capital (NWC) | CA − CL | 60 − 40 | 20 |
| 10 | NWC (Alternate) | LTS − LTU | 80 − 60 | 20 |
| 11 | Quick Assets (QA) | CA − Stock − Prepaid Exp | 60 − 30 − 2 | 28 |
TIP
Key Insight: Net Working Capital can be calculated two ways:
- NWC = CA − CL (from the Current side)
- NWC = LTS − LTU (from the Long Term side)
Both methods always give the same answer! Exams often test the alternate formula, so remember both.
1. Current Ratio
Definition
Current Ratio measures the company's ability to pay its short-term obligations (within 1 year). In simple terms, it answers: "For every rupee the company owes in the near term, how many rupees of short-term assets does it have to cover that?"
Key Points
- Purpose: Used to examine liquidity over a 1-year period and for sanction of Working Capital limits — this is the first ratio a banker checks when evaluating a loan proposal
- Ideal Levels:
- 2:1 — Global/International standard (i.e., twice as many current assets as current liabilities)
- 1.33:1 — As per RBI/Banking norms (India) — the minimum threshold banks use while sanctioning working capital
- 1.25:1 — For MSME sector (relaxed norm, since small businesses operate on tighter margins)
- A ratio > 1 means CA > CL (positive working capital) — the firm can meet its short-term obligations
- A ratio < 1 means CA < CL (negative working capital - risky!) — the firm may struggle to pay its dues
- Too high current ratio may indicate accumulated stock and unrealisable debtors — not necessarily a good sign, as idle assets earn no return
- Too low current ratio indicates the risk of not being able to pay short-term liabilities
TIP
Remember: 1.33:1 is the magic number for Indian banking exams. It corresponds to the Tandon Committee and RBI norms for working capital assessment.
Practice Examples
Example 1: If CA = 60 and CL = 40, what is Current Ratio?
**Answer**
Current Ratio = CA / CL = 60 / 40 = 1.5:1
Example 2: If CA = 100 and Current Ratio = 2:1, what is CL?
**Answer**
CR = CA / CL 2 = 100 / CL CL = 100 / 2 = 50
Example 3: If CL = 80 and Current Ratio = 1.5:1, what is CA?
**Answer**
CR = CA / CL 1.5 = CA / 80 CA = 80 × 1.5 = 120
Example 4: If CL = 40 and NWC = 25, what is Current Ratio?
**Answer**
Step 1: Find CA NWC = CA − CL 25 = CA − 40 CA = 65
Step 2: Calculate CR CR = CA / CL = 65 / 40 = 1.625:1 (or approximately 1.61:1)
Limitations of Current Ratio
| Limitation | Explanation |
|---|---|
| Static measure | Captures only a single point in time |
| Industry-specific | Utilities and auto dealers typically have low CR; trading firms have high CR |
| Doesn't differentiate asset types | Treats cash and slow-moving inventory the same |
| May overstate liquidity | If inventory is substantial but hard to convert quickly (e.g., industrial equipment) |
| Doesn't show conversion ease | Doesn't tell how easily assets can be converted to cash |
TIP
To get a clear understanding of liquidity, consider each current asset's liquidity individually. Check the Quick Ratio (next section) which removes less liquid assets like inventory from the equation.
NWC/CA Relationship
- Net Working Capital (NWC) alone isn't significant unless expressed as a ratio to Total Current Assets — this ratio shows what proportion of current assets is funded by long-term sources
- For an acceptable Current Ratio of 1.33:1, the NWC/CA should be 25% — meaning one-quarter of current assets are financed from long-term funds
- Higher CR indicates better safety margins for creditors since more assets are available to cover liabilities
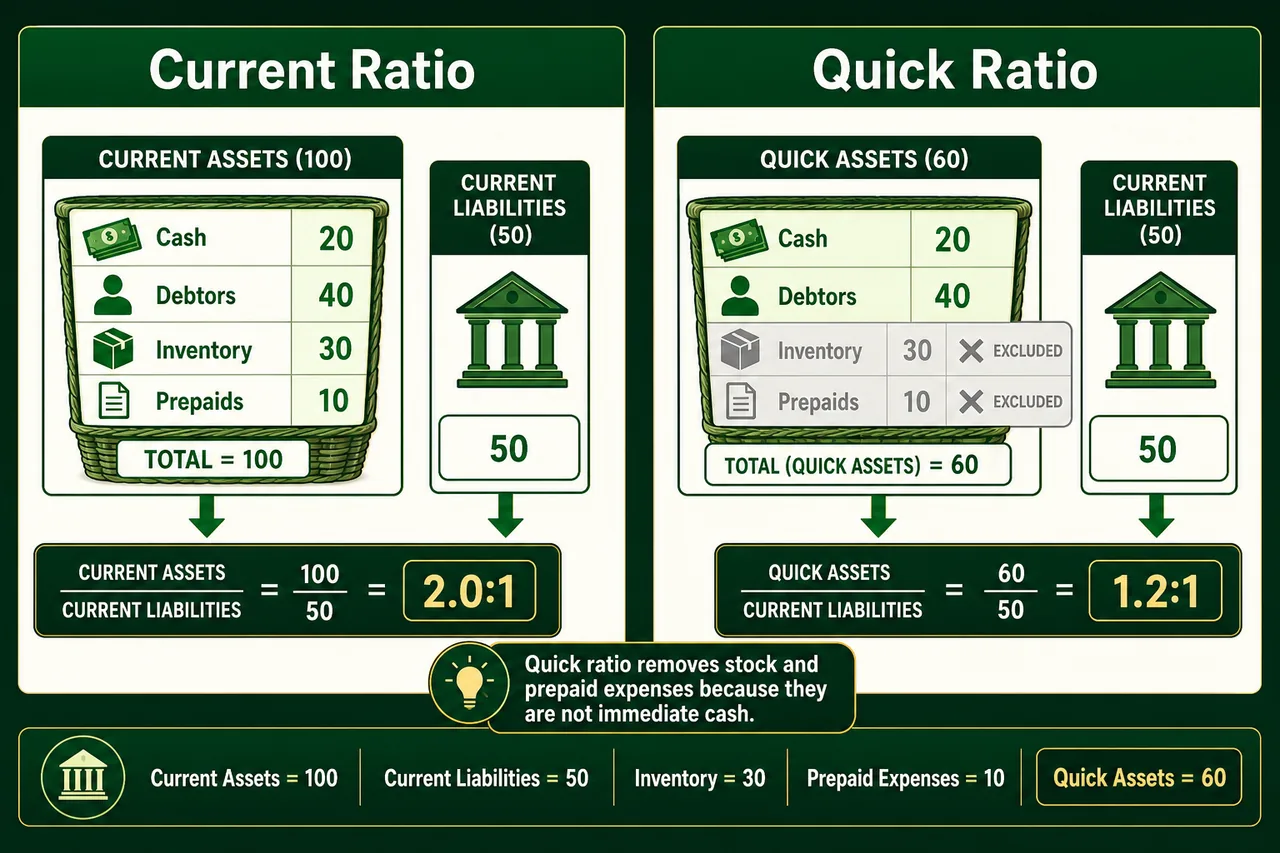
2. Quick Ratio (Acid Test Ratio)
Definition
Quick Ratio measures immediate liquidity — your ability to pay short-term debts using only the most liquid assets (i.e., assets that can be converted to cash almost immediately). Unlike the Current Ratio, it strips out slower-moving items like inventory.
Where: Quick Assets = Current Assets − Stock − Prepaid Expenses
Key Points
- Purpose: Used to examine short-term liquidity (1-2 months) and at the time of issuing Letter of Credit (LC). Measures instant debt paying capacity.
- Ideal Level: 1:1 is considered satisfactory — meaning for every rupee you owe in the short term, you have at least one rupee in liquid assets to cover it.
- Called "Acid Test" because it's a strict, no-nonsense test of liquidity — like the acid test historically used to verify gold purity
- Excludes stock (inventory) because it may not be quickly convertible to cash
- Too high Quick Ratio may indicate unrealisable debtors (money owed to you that you may never actually collect)
- Too low Quick Ratio indicates risk of not being able to pay short-term liabilities instantly
IMPORTANT
Quick Ratio is stricter than Current Ratio. A company might have a healthy Current Ratio of 2:1 but a poor Quick Ratio if most of its current assets are tied up in slow-moving inventory.
Why Exclude Stock & Prepaid Expenses?
| Item | Reason for Exclusion |
|---|---|
| Stock/Inventory | May take time to sell, may become obsolete — not "quick" cash |
| Prepaid Expenses | Cannot be converted to cash, already spent (e.g., rent paid in advance) |
Practice Examples
Example 1: If CA = 60 (including stocks 30, prepaid expenses 5) and CL = 50, what is Quick Ratio?
**Answer**
Step 1: Calculate Quick Assets QA = CA − Stock − Prepaid Expenses QA = 60 − 30 − 5 = 25
Step 2: Calculate Quick Ratio QR = QA / CL = 25 / 50 = 0.5:1
Example 2: If QA = 60 (out of total CA of 80) and CL = 80, what is Quick Ratio?
**Answer**
QR = QA / CL = 60 / 80 = 0.75:1
Cash Ratio (Structural Liquidity)
Definition
The Cash Ratio is the strictest liquidity measure — it ignores debtors, inventory, and everything else, counting only cash and cash equivalents (bank balances, short-term deposits, treasury bills) against current liabilities. Think of it as: "If we had to pay all short-term debts right now, how much actual cash do we have?"
Key Points
- Represents the firm's ability to cover current liabilities with cash held by liquidating assets
- Surplus cash = good liquidity health; Deficit = poor liquidity
- Startups and firms with insufficient cash might not have significant issues if operations generate consistent cash flows
- Most conservative liquidity test — even more strict than Quick Ratio
TIP
The three liquidity ratios form a spectrum from lenient to strict: Current Ratio (includes all current assets) > Quick Ratio (excludes stock & prepaid) > Cash Ratio (only cash and equivalents). Exams often test which ratio is the "strictest" — it is always the Cash Ratio.
3. Net Working Capital (NWC)
Definition
Net Working Capital represents the borrower's contribution (margin) in current assets funding. In simple terms, it is the cushion of current assets left over after all short-term obligations are paid. It answers: "How much of the day-to-day assets are funded by the borrower's own long-term money rather than short-term borrowings?"
Where: TOL = Long Term Liabilities + Current Liabilities
Key Points
- Ideal Level: 3:1 is considered satisfactory
- A low TOL/TNW reflects more security for creditors
- A very high ratio is considered as risk for the creditors as it may put the company into difficulty meeting its long-term liabilities
- Measures total external borrowing against owner's funds
- Higher ratio means more dependence on borrowed funds
Practice Examples
Example 1: If LTL = 500, CL = 400, and TNW = 300, what is TOL/TNW?
**Answer**
Step 1: Calculate TOL TOL = LTL + CL = 500 + 400 = 900
Step 2: Calculate TOL/TNW TOL/TNW = 900 / 300 = 3:1
Note: In this case, Debt Equity Ratio = 500/300 = 1.67:1
Example 2: If LTL = 60, CL = 60, and TNW = 30, what are DER and TOL/TNW?
**Answer**
DER = LTL / TNW = 60 / 30 = 2:1
TOL = LTL + CL = 60 + 60 = 120 TOL/TNW = 120 / 30 = 4:1
Funded Debt Equity Ratio
Definition
Funded Debt Equity Ratio represents the relationship between term liabilities and equity. It indicates the owner's stake in financing a project — how much of the project cost is being borne by the promoter vs borrowed from banks.
Key Points
- Purpose: Used during project appraisal and term loan sanction — banks check whether the promoter has enough "skin in the game"
- Shows how much of the project is funded by long-term debt vs owner's equity
- For medium-sized units, ideal funded debt is less than 60% of project cost — meaning the promoter should contribute at least 40%
- Amount of funded debt should consider the project's lifespan and its income generation capacity
- A lower owner's stake may be acceptable in certain capital-intensive industries (e.g., infrastructure, power)
- Interpretation:
- Lower is Better: More promoter contribution = less risk for the bank
- Higher ratio: Indicates the project is heavily debt-funded — riskier for lenders
Practice Example
Example: A project costs ₹10 lakh. Promoter contributes ₹4 lakh (Net Worth) and takes a term loan of ₹6 lakh. What is Funded DER?
**Answer**
Funded DER = Total Term Liabilities / Net Worth = 6,00,000 / 4,00,000 = 1.5:1
Funded debt = 6 lakh out of 10 lakh = 60% of project cost — this is at the upper acceptable limit for medium-sized units.
Capital Structure Ratio
Definition
Similar to Debt Equity Ratio but expressed per 100 parts of equity. It shows the proportion of debt to equity in the overall capital structure — essentially answering: "For every ₹100 of owner's money, how much has the company borrowed from outsiders?"
× 100Key Points
- Purpose: Provides a percentage view of leverage, making it easier to compare across companies and industries
- A ratio of 200 means creditors' stake is twice the owners' — for every ₹100 of equity, there is ₹200 of outside borrowing
- Lower is better — indicates less financial risk
- High leverage can restrict additional borrowings and may lead to financial distress
- Used alongside DER for comprehensive solvency assessment
Practice Example
Example: If TOL = 600 and TNW = 200, what is Capital Structure Ratio?
**Answer**
Capital Structure Ratio = TOL / TNW × 100 = 600 / 200 × 100 = 300
This means for every ₹100 of owner's funds, the company has borrowed ₹300 from outside — a highly leveraged position.
6. Debt Service Coverage Ratio (DSCR)
What is DSCR?
Debt Service Coverage Ratio (DSCR) is the most critical ratio for bankers when sanctioning Term Loans. It answers a simple question: "Does the borrower earn enough cash to pay back the loan installments and interest?"
Think of it like a personal loan eligibility check: If your monthly EMI is ₹10,000, the bank wants to see that your surplus income is at least ₹20,000 (DSCR of 2).
The Formula Explained
The formula compares Available Cash (Numerator) used to pay the debt with Required Payment (Denominator).
Understanding the Components
1. Numerator (Cash Source)
This represents the total cash generated by the business available to service the debt.
- Net Profit: The bottom-line profit after tax.
- ADD Depreciation: We add this back because it is a non-cash expense. Although it reduces profit on paper, no actual cash leaves the bank account.
- ADD LTL Interest: We add this back because we want to see total funds available before paying the interest obligation.
2. Denominator (Cash Use)
This represents the total debt obligation (EMI) for the year.
- LTL Installment: The principal portion of the loan to be repaid this year.
- LTL Interest: The interest portion to be paid this year.
Interpretation
- Ideal DSCR = 2.0 (or 2:1)
- This means the company earns twice as much cash as it needs to pay its debt.
- It provides a safety "cushion" — even if profits drop by 50%, the bank still gets paid.
- DSCR < 1.0: Danger Zone. The business is not generating enough cash to pay its loan obligations and will likely default.
IMPORTANT
DSCR is the single most important ratio for bankers when sanctioning Term Loans. A DSCR of 1.5 to 2.0 is the benchmark range acceptable to most lenders.
Practice Examples
Example 1: If PAT = 20, Depreciation = 10, TL Interest = 10, and TL Installment = 10, what is DSCR?
**Answer**
DSCR = (PAT + Depreciation + TL Interest) / (TL Installment + TL Interest) DSCR = (20 + 10 + 10) / (10 + 10) DSCR = 40 / 20 = 2
Example 2: If PBT = 90, Tax = 30%, Depreciation = 8, Total Interest = 40 (of which WC Interest = 28), and TL Installment = 10, what is DSCR?
**Answer**
Step 1: Calculate PAT Tax = 90 × 30% = 27 PAT = 90 − 27 = 63
Step 2: Calculate TL Interest TL Interest = Total Interest − WC Interest = 40 − 28 = 12
Step 3: Calculate DSCR DSCR = (63 + 8 + 12) / (10 + 12) DSCR = 83 / 22 = 3.77
How to Interpret DSCR
| DSCR Level | Meaning | Implication |
|---|---|---|
| Below 1 | Operating income is less than required debt payments | Insufficient cash flow; signal for default risk |
| 1.0 to 1.5 | Barely covering obligations | Risky; little room for error or downturns |
| 1.5 to 2.0 | Satisfactory coverage | Benchmark range; acceptable to most lenders |
| Above 2.0 | Strong cash generation | Favorable; company can comfortably service debt |
| Too High (e.g., 5+) | Company can take more debt but isn't | May indicate missed opportunities for leveraging debt benefits |
NOTE
A declining DSCR in initial years suggests cash flow challenges and poor early output from plans. Acceptable DSCR levels may differ based on country, loan type, and industry.
How to Improve DSCR
| Strategy | How it Helps |
|---|---|
| Increase sales volume | Boosts net income available for debt servicing |
| Reduce operating costs | Improves net profit, increasing numerator |
| Extend loan duration | Reduces yearly installments, lowering denominator |
| Negotiate lower interest rate | Decreases installment amounts |
| Minimize fresh investments | Focuses resources on loan repayment |
| Renegotiate repayment plans | Find flexible installment schedules with creditors |
TL Installment Calculation (Reverse Problem)
Example: If PAT = 60, Depreciation = 20, TL Interest = 10, and DSCR = 2, what is TL Installment?
**Answer**
Step 1: Set up the equation DSCR = (PAT + Dep + TL Int) / (Installment + TL Int) 2 = (60 + 20 + 10) / (Installment + 10) 2 = 90 / (Installment + 10)
Step 2: Solve for (Installment + 10) Installment + 10 = 90 / 2 = 45
Step 3: Calculate Installment Installment = 45 − 10 = 35
7. Interest Coverage Ratio (ICR)
Definition
Interest Coverage Ratio measures the ability to pay interest obligations from operating profits. While DSCR checks if the company can pay both principal and interest, ICR focuses only on interest — making it a more specific check on the company's ability to service the cost of borrowing.
Key Points
- Also called Fixed Charges Cover
- Purpose: Used to assess whether a company earns enough to comfortably cover its interest burden — especially important for highly leveraged firms
- Measures how many times interest can be paid from earnings
- Interpretation:
- Higher is Better: An ICR of 7 means the company can pay its interest 7 times over from its earnings — very comfortable
- ICR < 1: The company cannot even cover its interest payments — severe distress signal
- ICR 1-2: Tight; any downturn could lead to interest default
- ICR > 3: Generally considered comfortable by most lenders
- Difference from DSCR: DSCR includes principal repayment in the denominator; ICR only considers interest. A company may have a good ICR but poor DSCR if principal installments are large
Practice Examples
Example 1: If NP = 40, Depreciation = 20, and TL Interest = 10, what is ICR?
**Answer**
ICR = (NP + Depreciation + TL Interest) / TL Interest ICR = (40 + 20 + 10) / 10 ICR = 70 / 10 = 7
This means the company can pay interest 7 times from its earnings.
Example 2: If NP = 5, Depreciation = 10, and TL Interest = 20, what is ICR?
**Answer**
ICR = (5 + 10 + 20) / 20 = 35 / 20 = 1.75
This is a tight position — the company barely covers its interest. Any drop in profits could lead to difficulty servicing debt.
8. Fixed Assets Turnover Ratio (FAR)
What is this Ratio?
First, a clarification: While sometimes called Fixed Assets Turnover Ratio in older banking texts, this formula (Fixed Assets / Long Term Funds) is actually the Fixed Assets Ratio (a Solvency ratio), NOT an efficiency ratio.
It serves as a critical Financial Discipline Check:
- Golden Rule of Banking: "Long-term assets should be funded by long-term liabilities."
- Analogy: You should not buy a house (Long Term Asset) using a Credit Card (Short Term Liability). You should use a Home Loan (Long Term Liability) or your own Savings (Net Worth).
Formula
Understanding the Logic
- Long Term Funds = Net Worth + Long Term Liabilities (The "Correct" sources)
- Fixed Assets = Land, Building, Machinery (The "Long Term" uses)
Interpretation
- Ideal Level: ≤ 1 (Less than or equal to 1)
- Implication: This means 100% of your Fixed Assets are funded by Long Term Funds, and you still have some surplus Long Term Funds left over to help fund your Working Capital (Positive NWC).
- Danger Zone: > 1
- Implication: You have used Short Term Funds (like Overdraft or Creditors) to buy Fixed Assets. If ratio is less than 1, it shows diversion of funds.
- Risk: Short term lenders can recall money anytime, but your money is stuck in machinery/buildings. This creates a severe Asset-Liability Mismatch.
Note: Fixed Asset Coverage Ratio is the opposite of Loan to Value Ratio. It shows the extent up to which fixed assets cover long-term debts — for each rupee of LT loan/debt, how much net block is available.
Practice Example
Example: If Long Term Funds = 300 and Fixed Assets = 250, what is FAR?
**Answer**
FAR = Fixed Assets / Long Term Funds = 250 / 300 = 0.83:1
Verdict: < 1. Healthy. The company has adhered to financial discipline. The surplus (300 - 250 = 50) is available as Net Working Capital.
Comprehensive Problem
Question: A firm has total assets of Rs. 1000. Its current ratio is 1.5:1, debt equity ratio is 2:1, and current assets are 600. What is the amount of current liabilities, net worth, and long-term liabilities, if there are no intangible assets?
**Answer**
Step 1: Find Current Liabilities CR = CA / CL 1.5 = 600 / CL CL = 600 / 1.5 = 400
Step 2: Find NW + LTL Total Assets = Total Liabilities 1000 = NW + LTL + CL NW + LTL = 1000 − 400 = 600
Step 3: Apply Debt Equity Ratio DER = LTL / TNW (TNW = NW since no intangible assets) 2 = LTL / NW LTL = 2 × NW
Step 4: Substitute in Step 2 NW + 2NW = 600 3NW = 600 NW = 200
Step 5: Calculate LTL LTL = 600 − 200 = 400
Summary:
- Current Liabilities = 400
- Net Worth = 200
- Long Term Liabilities = 400
Verification:
- Total Liabilities = 200 + 400 + 400 = 1000 ✓
- DER = 400/200 = 2:1 ✓
- CR = 600/400 = 1.5:1 ✓
Quick Reference: Solvency Ratios Summary
| Ratio | Formula | Ideal Level | Use Case |
|---|---|---|---|
| Debt Equity Ratio | LTL / TNW | 2:1 | Long-term borrowing capacity |
| TOL/TNW | (LTL + CL) / TNW | 3:1 | Total leverage assessment |
| DSCR | (PAT + Dep + Int) / (Inst + Int) | 2 | TL sanction, installment |
| ICR | (PAT + Dep + Int) / Int | Higher is better | Interest payment ability |
| Funded DER | Total Term Liabilities / NW | < 60% of cost | Project financing assessment |
| Capital Structure Ratio | TOL / TNW × 100 | Lower is better | Overall leverage per 100 parts |
| Fixed Assets Ratio | FA / Long Term Funds | ≤ 1 | Asset financing check |
Profit Waterfall — Step-by-Step Calculation
Before studying profitability ratios, understand how profits flow from Turnover down to Retained Profit. Each level strips away a different category of expenses — mastering this waterfall is essential for solving case study problems in exams:
| Step | Item | Formula |
|---|---|---|
| 1 | Gross Profit | Turnover − Cost of Sales |
| 2 | Operating Profit | Gross Profit − (Distribution Costs + Admin Expenses) |
| 3 | Profit Before Tax (PBT) | Operating Profit − Interest |
| 4 | Profit Attributable to Shareholders | Profit Before Tax − Tax |
| 5 | Retained Profit | Profit Attributable to Shareholders − Dividend |
TIP
Exam Shortcut: Each level strips away a category of expenses. Gross Profit removes production costs; Operating Profit removes overheads; PBT removes finance costs; PAT removes government's share; Retained Profit removes what's distributed to shareholders. Remember the order: Production → Overheads → Finance → Tax → Dividends.
Key Margin Formulas
| Margin | Formula |
|---|---|
| Gross Profit Margin | (Gross Profit / Turnover) × 100 |
| Operating Margin | (Operating Profit / Turnover) × 100 |
| Net Profit Margin | (Net Profit / Sales) × 100 |
| ROCE | (EBIT or Net Operating Profit) / Capital Employed × 100 |
9. Gross Margin or Gross Profit Ratio
Definition
The Gross Profit Ratio indicates the efficiency of production or core operations. It measures the relationship between Gross Profit and Net Sales — answering: "Out of every ₹100 of sales, how much is left after paying for the cost of producing/buying the goods?"
× 100Key Points
- Gross Profit = Net Sales − Cost of Goods Sold (COGS)
- Purpose: The first profitability check — if the gross margin itself is poor, no amount of cost-cutting in admin/distribution will save the business
- Interpretation:
- Higher is Better: Indicates efficient production and cost control
- Low Ratio: May indicate high cost of production, low sales price, or both
- Declining trend: Signals rising raw material costs, pricing pressure, or production inefficiency
- It covers administrative and other operating expenses and leaves a balance for net profit
- Industry comparison matters: Trading firms typically have lower GP margins than manufacturing firms; luxury goods have higher margins than commodities
Practice Examples
Que: If sales 2000, cost of sales 1400 and NP 200, GPR & NPR = ?
**Answer**
Step 1: Calculate Gross Profit GP = Sales − Cost of Sales = 2000 − 1400 = 600
Step 2: Calculate GP Ratio GP ratio = 600 / 2000 × 100 = 30%
Step 3: Calculate NP Ratio NP ratio = 200 / 2000 × 100 = 10%
10. Net Margin or Net Profit Ratio
Definition
The Net Profit Ratio measures the overall efficiency of the business. It indicates the portion of sales that remains as profit after covering all expenses — production, administration, selling, interest, and tax. It answers: "Out of every ₹100 of sales, how much actually reaches the bottom line?"
× 100Key Points
- Net Profit = Gross Profit − Operating Expenses − Interest − Tax
- Purpose: The ultimate profitability check — while GP Ratio tests production efficiency, NP Ratio tests total business efficiency including financing decisions and tax management
- Interpretation:
- Higher is Better: Indicates strong overall management and cost efficiency
- Benchmark: Limits vary by industry, but consistent growth is expected
- GP high but NP low: Signals that overheads, interest, or tax are eating into profits — the production side is fine but management/financial side needs attention
- It determines the firm's capacity to withstand adverse economic conditions
Practice Examples
Que: If Net profits are 100 & net profit ratio is 20%, the sales = ?
**Answer**
Net Profit Ratio = Net Profit / Sales × 100 20 = 100 / Sales × 100 Sales = 100 × 100 / 20 Sales = 500
11. Return on Equity or Return on Net Worth (No benchmark)
Definition
This ratio measures the productivity of the owners' capital. It tells common shareholders how effectively their money is being employed.
× 100Key Points
- Also known as: Return on Net Worth (RONW) or Return on Proprietors' Funds.
- Interpretation:
- Higher is Better: Indicates the company is generating good returns for its shareholders.
- Compared with the return on other safe investments (like FDs or Bonds). If ROE < Safe Rate, the business is not viable for investors.
Practice Examples
Example: Net profit = 120 and tangible net worth = 300. Calculate ROE.
**Answer**
ROE or RONW = 120 / 300 × 100 = 40%
Indication: Promoters' funds are earning a return of 40%.
12. Return on Investment or Return on Capital Employed
Definition
Return on Investment (ROI) or Return on Capital Employed (ROCE) measures the return generated on the total long-term funds invested in the business (Equity + Debt).
× 100Where: Investment = Tangible Net Worth + Long Term Liabilities
Key Points
- Purpose: Essential for checking the overall viability of the business model, regardless of financing structure.
- Leverage Check: If ROI > Interest Rate on Debt, using debt is beneficial — this concept is called Trading on Equity (or Financial Leverage).
TIP
Trading on Equity: If a company borrows at 10% interest but earns 15% ROI, the extra 5% benefits equity shareholders. This is why companies borrow even when they have their own funds — as long as ROI exceeds the borrowing cost.
- Interpretation:
- Higher is Better: Indicates efficient use of long-term capital.
Practice Examples
Example: Net profit = 120 and tangible net worth = 300 and long term liabilities 500. Calculate ROCE.
**Answer**
Step 1: Calculate Investment Investment = TNW + LTL = 300 + 500 = 800
Step 2: Calculate ROCE ROI or ROCE = 120 / 800 × 100 = 15%
Indication: This indicates that the promoters' funds and long term liabilities together are earning a return of 15%.
12A. Return on Equity Share Capital
Definition
Measures the return specifically on equity share capital (excluding preference shares). While ROE uses total net worth (equity + reserves), this ratio isolates the return on only the face value of equity shares — giving a sharper view of what ordinary shareholders are earning.
× 100Key Points
- Purpose: Helps equity shareholders understand the return specifically on their paid-up capital, separate from accumulated reserves
- A higher ratio shows the return on equity share capital is good
- Different from ROE/RONW — this uses only equity share capital in the denominator, not total net worth (which includes reserves)
- Useful for assessing returns available to common/ordinary shareholders specifically
- Preference dividends are subtracted from Net Profit because preference shareholders get paid first — the remainder belongs to equity holders
Practice Example
Example: Net Profit = 50, Preference Dividend = 10, Equity Share Capital = 200. Calculate Return on Equity Share Capital.
**Answer**
Return on Equity Share Capital = (50 − 10) / 200 × 100 = 40 / 200 × 100 = 20%
This means for every ₹100 of equity share capital, the shareholders are earning ₹20 in returns.
Quick Reference: Profitability Ratios Summary
| Ratio | Formula | Ideal Level | Use Case |
|---|---|---|---|
| Gross Profit Ratio | GP / Sales × 100 | Higher is better | Gross margin efficiency |
| Operating Margin | Operating Profit / Turnover × 100 | Higher is better | Operational efficiency |
| Net Profit Ratio | NP / Sales × 100 | Higher is better | Net margin efficiency |
| ROE / RONW | NP / TNW × 100 | No benchmark | Owner's return |
| Return on Equity Share Capital | (NP − Pref Div) / Equity Share Capital × 100 | Higher is better | Equity shareholders' return |
| ROI / ROCE | NP / (TNW + LTL) × 100 | Higher is better | Long-term fund return |
13. Stock Turnover Ratio OR Inventory Turnover Ratio
Definition
The Stock Turnover Ratio (STR) measures the velocity of stock movement. It indicates how many times the average stock is "turned over" (sold and replaced) during the year.
Key Points
- Average Inventory = (Opening Stock + Closing Stock) / 2
- Interpretation:
- Higher is Better: Indicates fast-moving goods and efficient inventory management.
- Low Ratio: Indicates over-stocking, obsolete stock, or poor sales.
TIP
Sometimes "Cost of Goods Sold" is used instead of Net Sales in the numerator for more accuracy, but in banking exams, "Net Sales" is commonly used unless specified.
Practice Examples
Example 1: If sales 2000 and stocks 400, STR = ?
**Answer**
STR = 2000 / 400 = 5 times
Example 2: Firm-A: Sales 4000 & stock 400, Firm B 6000 & 500, STR of A and B = ?
**Answer**
STR A = 4000 / 400 = 10
STR B = 6000 / 500 = 12
Which of these manages the stock better?
B better in stock management. (Higher turnover = better efficiency)
Inventory Holding Period
The Inventory Holding Period reflects how long items stay before being sold.
(in days)OR: 12 / Inventory Turnover Ratio (in months)
Alternative Formulas
| Formula | Use Case |
|---|---|
| COGS / Average Inventory | More accurate when COGS is available |
| Cost of Production / Average WIP Inventory | For work-in-progress holding period |
| Cost of Sales / Average FG Inventory | For finished goods holding period |
What Examiners Look For
| Check | Why it Matters |
|---|---|
| Reasons for abnormal inventory levels | May indicate poor management or market issues |
| Monthly sales vs inventory levels | Reveals seasonal patterns or buildup |
| Comparison with last year | Shows improvement or deterioration |
| Extremely high turnover | Risk of lost sales due to inventory shortage |
Worked Example — Inventory Holding Period
Manufacturer with COGS of ₹2,00,000/year. Opening stock ₹5,000, Closing stock ₹15,000.
- Average stock = (5,000 + 15,000) / 2 = ₹10,000
- Stock Turnover = 2,00,000 / 10,000 = 20 times
- Holding Period = 365 / 20 = 18.25 days
This means inventory sits in the warehouse for about 18 days on average before being sold.
14. Debtors' Turnover Ratio
Definition
Debtors' Turnover Ratio (DTR) indicates the efficiency of credit collection. It shows how many times the average debtors are converted into cash during a year.
Key Points
- Average Debtors = (Opening Debtors + Closing Debtors) / 2
- Interpretation:
- Higher is Better: Indicates efficient collection policy and high quality of debtors.
- Low Ratio: Indicates inefficient collection or bad debts.
Practice Examples
Example 1: If sales 2000 and debtors 500, DTR = ?
**Answer**
DTR = 2000 / 500 = 4 times
Example 2: Firm A sales 6000 & debtors 400, Firm B 8000 & debtor 800, DTR of A & B = ?
**Answer**
DTR A = 6000 / 400 = 15
DTR B = 8000 / 800 = 10
Which one is managing the debtors' recovery better?
Debtor recovery is better of Firm A. (Higher turnover = faster collection)
15. Debtors' Collection Period OR Debtor Velocity Ratio
Definition
This ratio expresses the collection efficiency in terms of time. It represents the average number of months or days for which credit is granted to customers.
× 12 (for months) or × 365 (for days)Key Points
- Relationship with DTR: High DTR = Low Collection Period (inverse relationship).
- Interpretation:
- Lower is Better: Means cash is collected quickly.
- If DCP is significantly higher than the industry average or the credit terms allowed, it indicates poor liquidity management.
Practice Examples
Example 1: If sales 2000 and debtors 500, DCP = ?
**Answer**
DCP = 500 / 2000 × 12 = 3 months
Example 2: Firm A sale 6000 & debtors 400. Firm B 8000 & 800, DCP of A and B = ?
**Answer**
DCP-A = 400 / 6000 × 12 = 0.8 month
DCP-B = 800 / 8000 × 12 = 1.2 month
Firm A has better debtor management (shorter collection period).
Debtors Turnover: Detailed Insights
About Credit Sales:
- Average Trade Debtors includes both Trade Debtors & Bills Receivable
- Ideally, the formula should use Net Credit Sales (not total sales)
- In banking exams, if not specified, total sales are commonly used
Interpretation Guidelines:
| Observation | Meaning |
|---|---|
| High DTR | Effective receivable management; quick payment collection; positive credit terms |
| Low DTR | Poor credit management; rising bad debts; too-liberal credit policies |
| DTR vs Industry | Compare with industry standards for broader context |
Detailed Example — Debtors Turnover
Sales for FY 2012-13: ₹50 lakh. Beginning debtors: ₹4 lakh, Ending debtors: ₹6 lakh.
- Average Trade Debtors = (4+6)/2 = ₹5 lakh
- DTR = 50/5 = 10 times
- Collection Period = 12/10 = 1.2 months = 36 days
16. Creditor's Velocity Ratio (Creditor's Turnover)
Definition
Creditor's Velocity Ratio indicates the speed at which creditors are paid. It measures the average time a company takes to pay its suppliers. Think of it as the mirror image of Debtors' Turnover — while DTR measures how fast you collect money from customers, Creditor's Turnover measures how fast you pay money to suppliers.
Key Points
- Purpose: Measures overall asset efficiency — especially useful for capital-intensive industries where large investments in assets are made
- Higher is better — indicates efficient use of assets to generate revenue
- Useful when comparing two companies in the same industry
- Low ratio may indicate over-investment in assets or poor sales performance
- Interpretation:
- High ratio: Company is generating strong revenue relative to its asset base — lean and efficient
- Low ratio: Company may have idle assets, excess capacity, or under-performing investments
- Industry context matters: Asset-light businesses (IT, consulting) naturally have higher ratios than asset-heavy businesses (manufacturing, infrastructure)
Practice Example
Example: Firm A has Net Sales = 5000 and Total Assets = 2500. Firm B has Net Sales = 4000 and Total Assets = 4000. Compare their asset efficiency.
**Answer**
Firm A: Asset Turnover = 5000 / 2500 = 2 times Firm B: Asset Turnover = 4000 / 4000 = 1 time
Firm A is more efficient — it generates ₹2 of sales for every ₹1 of assets, while Firm B generates only ₹1. Firm B may have idle assets or excess capacity.
Turnover Ratio Practice Questions
Question 1: Net sales = 2700. Opening and closing debtors = 300 and 400. What is debtors' velocity?
**Answer**
Step 1: Calculate Average Debtors Average Debtors = (Opening + Closing) / 2 = (300 + 400) / 2 = 350
Step 2: Calculate DVR DVR = Average Debtors / Net Sales × 12 DVR = 350 / 2700 × 12 = 1.56 M (months)
Question 2: Net sales = 3650. Debtors' velocity = 35 days. What is amount of average debtors?
**Answer**
Step 1: Calculate Daily Sales Daily sales = 3650 / 365 = 10
Step 2: Calculate Average Debtors Average Debtors = daily sale × debtors' velocity Average Debtors = 35 × 10 = 350
Question 3: Net sales = 2884. Stock turnover = 7. What is amount of average stock?
**Answer**
Stock Turnover = Net Sales / Average Stock 7 = 2884 / Average Stock Average stocks = Net sales / stock turnover Average Stock = 2884 / 7 = 412
Quick Reference: Turnover Ratios Summary
| Ratio | Formula | Indicates |
|---|---|---|
| Stock Turnover Ratio | Net Sales / Average Inventory | How many times stock is sold |
| Debtors' Turnover Ratio | Net Sales / Average Debtors | How many times debtors are collected |
| Debtors' Collection Period | Debtors / Sales × 12 (or × 365) | Time to collect debts |
| Creditor's Turnover | Net Credit Purchases / Avg Trade Creditors | How many times creditors are paid |
| Creditor's Payment Period | Avg Creditors / Net Credit Purchases × 365 | Time to pay suppliers (days) |
| Working Capital Turnover | Net Sales / Net Working Capital | Efficiency of working capital use |
| Asset Turnover | Net Sales / Total Assets | Efficiency of asset utilization |
12B. Dividend Per Share (DPS)
Definition
Dividend Per Share measures the dividend distributed per equity share. It tells an investor exactly how much cash they will receive per share they hold — making it the most direct measure of cash return to shareholders.
Key Points
- Purpose: Key metric for income-oriented investors who invest primarily for regular dividend income (e.g., retirees)
- Higher the ratio, higher is the dividend per share — indicates better returns to shareholders
- DPS can be lower than EPS — the difference goes into retained earnings (reinvested in the business)
- A company may have high EPS but low DPS if it retains most profits for growth
- Interpretation:
- Consistent or growing DPS: Sign of a stable, mature company
- Declining DPS: May signal financial trouble or a shift to reinvestment strategy
- DPS > EPS: Unsustainable — the company is paying dividends from reserves, not current earnings
Practice Example
Example: A company declares total dividends of ₹5,00,000. It has 50,000 equity shares. What is DPS?
**Answer**
DPS = 5,00,000 / 50,000 = ₹10 per share
Each shareholder receives ₹10 for every share they hold.
12C. Earnings Per Share (EPS)
Definition
EPS measures the net earnings available to each ordinary (equity) share after paying preference dividends. It is the most widely tracked metric by stock market investors and analysts — the "bottom line per share."
Key Points
- Purpose: Serves as the foundation for stock valuation — used directly in calculating the P/E Ratio
- Higher the ratio, higher is the return to the equity share holders
- EPS is one of the most closely watched metrics by investors and analysts
- Used in the calculation of P/E Ratio (Market Price / EPS)
- Interpretation:
- Growing EPS year-over-year: Indicates improving profitability — positive signal for investors
- Declining EPS: May indicate shrinking profits or dilution from issuing new shares
- EPS alone doesn't tell the full story — compare with DPS (how much is distributed) and P/E (how market values the earnings)
Practice Example
Example: Net Profit = ₹10,00,000. Preference Dividend = ₹1,00,000. Number of Equity Shares = 1,00,000. Calculate EPS.
**Answer**
EPS = (10,00,000 − 1,00,000) / 1,00,000 = 9,00,000 / 1,00,000 = ₹9 per share
Each equity share has earned ₹9 in the current year.
18. Capital Gearing Ratio
Definition
Capital Gearing Ratio measures the ratio of equity to fixed cost capital (debt). It shows the proportion of a company's capital that carries a fixed charge (interest). Think of "gearing" like a bicycle gear — high gearing amplifies both returns and risk.
Key Points
- Purpose: Helps investors assess the financial risk structure of a company — how much of the capital base carries a fixed obligation (interest/dividends)
- High gearing = More fixed-cost capital (debt) relative to equity = Higher risk — but also potentially higher returns for equity holders (leverage effect)
- Low gearing = More equity relative to debt = Lower risk — more conservative capital structure
- Important for assessing the financial risk taken by equity shareholders
- Interpretation:
- Ratio > 1: Equity exceeds fixed-cost capital — low geared (conservative, safer)
- Ratio < 1: Fixed-cost capital exceeds equity — high geared (aggressive, riskier)
- In good times, high gearing amplifies equity returns; in bad times, it amplifies losses
Practice Example
Example: Equity Share Capital = 500, Reserves = 300, Preference Shares = 100, Debentures = 400, Long-term Loans = 300. What is Capital Gearing Ratio?
**Answer**
Step 1: Equity = 500 + 300 = 800 Step 2: Fixed Cost Capital = 100 + 400 + 300 = 800 Capital Gearing Ratio = 800 / 800 = 1:1
This is a balanced gearing — equity and fixed-cost capital are equal. Neither overly conservative nor overly risky.
19. Price-to-Earnings (P/E) Ratio
Definition
The P/E Ratio measures a firm's market value per share relative to its earnings per share. It indicates how much investors are willing to pay for each rupee of earnings — essentially, it reflects market expectations of future growth.
Key Points
- Purpose: The most widely used capital market ratio by investors for comparing stock valuations across companies
- High P/E indicates expectations of high future growth in earnings — investors are paying a premium for expected future profits
- Low P/E may indicate the stock is undervalued or the company has lower growth prospects
- Interpretation:
- P/E of 20: Investors are willing to pay ₹20 for every ₹1 of current earnings — they expect earnings to grow significantly
- P/E of 5: Market values the stock cheaply — either the company has low growth prospects, or the stock is undervalued (a potential bargain)
- Industry comparison is essential: A P/E of 30 is normal for IT companies but very high for a bank
Practice Example
Example: A company's share trades at ₹150 in the market. Its EPS is ₹10. What is the P/E Ratio?
**Answer**
P/E Ratio = Market Price / EPS = 150 / 10 = 15
This means investors are paying ₹15 for every ₹1 of the company's earnings. The market expects moderate to good future growth.
20. Times Interest Earned Ratio
Definition
Times Interest Earned Ratio (also called Interest Coverage Ratio) is used to analyze long-term solvency. It measures how many times a company can cover its interest obligations from operating profit. Unlike ICR (which uses PAT + Depreciation + Interest), this variant uses EBIT — a cleaner measure of operating performance.
Key Points
- EBIT = Operating Profit (Profit before deducting interest and taxes)
- Purpose: Widely used by banks when assessing term loan viability — measures whether the business generates enough operating profit to comfortably service its interest obligations
- Higher is better — indicates comfortable ability to pay interest
- A ratio below 1.5 is a warning sign for lenders
- Interpretation:
- > 3: Comfortable — the company has a strong buffer to absorb profit fluctuations
- 1.5 to 3: Acceptable but tight — little room for error
- < 1.5: Warning zone — the company may struggle to meet interest obligations if profits dip
- < 1: The company cannot cover its interest from operating profits — default risk
Practice Example
Example: EBIT (Operating Profit) = 500, Interest Expense = 100. What is Times Interest Earned?
**Answer**
Times Interest Earned = EBIT / Interest Expense = 500 / 100 = 5 times
The company can cover its interest obligation 5 times from operating profits — a comfortable position.
Quick Reference: Capital Market Ratios Summary
| Ratio | Formula | Indicates |
|---|---|---|
| DPS | Total Dividends / No. of Shares | Dividend income per share |
| EPS | (NP − Pref Div) / No. of Equity Shares | Earnings per share |
| P/E Ratio | Market Price / EPS | Market growth expectations |
| Capital Gearing | Equity / Fixed Cost Capital | Financial risk level |
| Times Interest Earned | EBIT / Interest Expense | Interest payment ability |
Break-Even Analysis (BEP)
Break-Even Analysis indicates the point at which the enterprise has no profit or loss — the point where income equals expenditure. It is a fundamental tool for assessing business viability and risk. The lower the BEP, the safer the business — it needs fewer sales to cover its costs.
IMPORTANT
BEP analysis is frequently tested in banking exams, especially for project appraisal and term loan sanction questions. Know all three formulas: BEP in units, BEP in value, and Margin of Safety.
Key Terms
| Term | Definition |
|---|---|
| Fixed Cost | Costs that do not change with output (rent, salaries, depreciation) |
| Variable Cost | Costs that change with output (raw materials, direct labour) |
| Contribution | Selling Price per unit − Variable Cost per unit |
| Profit Volume Ratio (P/V Ratio) | Contribution / Sales |
i. Break-Even Point in Units (BEP Quantity)
Where: Contribution = Selling Price per unit − Variable Cost per unit
- Measures how many units the enterprise has to sell to reach the point where there is no loss or profit
- Higher the BEP, higher the risk — the enterprise needs to sell more just to break even
ii. Break-Even Point in Value (BEP Sales)
=- Measures how much sales revenue the enterprise should generate to reach break-even
- Higher the BEP sales, higher will be the risk for the enterprise
- Also expressed as: BEP Sales = (F × S) / C
iii. Margin of Safety
× 100- Measures the buffer that the entity has between its current/estimated sales levels and the Break-Even Point
- Higher the margin of safety, better for the enterprise — it can absorb a drop in sales without incurring losses
- A narrow margin of safety indicates vulnerability to any decline in sales
Practice Examples
Example 1: A firm has fixed costs of ₹2,00,000. Selling price per unit is ₹50 and variable cost per unit is ₹30. Calculate BEP in units and value.
**Answer**
Step 1: Calculate Contribution Contribution = Selling Price − Variable Cost = 50 − 30 = ₹20 per unit
Step 2: BEP in Units BEP = Fixed Cost / Contribution = 2,00,000 / 20 = 10,000 units
Step 3: BEP in Value BEP Sales = 10,000 × 50 = ₹5,00,000
Example 2: If actual sales are ₹8,00,000 and BEP sales are ₹5,00,000, what is the Margin of Safety?
**Answer**
Margin of Safety = (Sales − BEP Sales) / Sales × 100 = (8,00,000 − 5,00,000) / 8,00,000 × 100 = 3,00,000 / 8,00,000 × 100 = 37.5%
Comprehensive Case Study — XYZ Limited
IMPORTANT
This case study tests multiple ratios from a single set of data — a common exam pattern. Practice extracting each ratio systematically from the P&L and Balance Sheet.
Given Data
XYZ Limited — Profit and Loss Account for the year ended 31.12.2022:
| Item | Amount (₹) |
|---|---|
| Turnover | 8,100 |
| Cost of Sales | 5,400 |
| Distribution Costs | 1,200 |
| Admin Expenses | 750 |
| Interest | 300 |
| Tax | 500 |
| Dividend | 800 |
Balance Sheet as on 31.12.2022:
| Assets | Amount (₹) | Liabilities & Equity | Amount (₹) |
|---|---|---|---|
| Fixed Assets (Plant & Machinery) | 4,500 | Ordinary Shares | 3,000 |
| Current Assets: | Retained Profit | 3,100 | |
| — Stocks | 1,800 | Total Equity | 6,100 |
| — Debtors | 1,300 | 12% Debentures | 3,000 |
| — Bank | 500 | ||
| Total Current Assets | 3,600 | Current Liabilities: | |
| — Trade Creditors | 700 | ||
| — Proposed Dividend | 800 | ||
| — Taxation | 500 | ||
| — Accruals | 300 | ||
| Net Current Assets | 1,600 | Total CL | 2,000 (approx) |
Step-by-Step Solutions
1. Gross Profit
Gross Profit = Turnover − Cost of Sales = 8,100 − 5,400 = ₹2,700
2. Operating Profit
Operating Profit = Gross Profit − (Distribution Costs + Admin Expenses) = 2,700 − (1,200 + 750) = 2,700 − 1,950 = ₹750
3. Profit Before Tax
PBT = Operating Profit − Interest = 750 − 300 = ₹450
4. Profit Attributable to Shareholders
Profit Attributable = PBT − Tax = 450 − 500 = ₹(−50) (Loss — tax exceeds profit before tax!)
5. Retained Profit
Retained Profit = Profit Attributable to Shareholders − Dividend = (−50) − 800 = ₹(−850) (Negative — the company is distributing dividends even at a loss, which erodes retained earnings)
6. Gross Profit Margin
GP Margin = (Gross Profit / Turnover) × 100 = (2,700 / 8,100) × 100 = 33.33%
7. Operating Margin
Operating Margin = (Operating Profit / Turnover) × 100 = (750 / 8,100) × 100 = 9.26% (approx 9%)
8. Return on Capital Employed (ROCE)
Capital Employed = Fixed Assets + Net Current Assets = 4,500 + 1,600 = 6,100 ROCE = (Operating Profit / Capital Employed) × 100 = (750 / 6,100) × 100 = 12.30% (approx)
TIP
Some variants use EBIT or include debentures in capital employed. Always check the formula specified in the question — different textbooks define "Capital Employed" differently.
9. Current Ratio
Current Ratio = Current Assets / Current Liabilities = 3,600 / 2,000 = 1.80:1
10. Quick Ratio (Acid Test)
Quick Assets = Current Assets − Stocks = 3,600 − 1,800 = 1,800 Quick Ratio = Quick Assets / Current Liabilities = 1,800 / 2,000 = 0.9:1
WARNING
While the Current Ratio (1.80) looks healthy, the Quick Ratio (0.9) is below 1:1, indicating that 50% of current assets are tied up in stock. If inventory is slow-moving, the company may face short-term liquidity issues. This is a classic exam trap — always check both ratios together.
Key Takeaways
- Current Ratio: Ideal = 2:1 (global), 1.33:1 (India/RBI), 1.25:1 (MSME). Too high may indicate accumulated stock/unrealisable debtors
- Quick Ratio excludes stock and prepaid expenses for strict liquidity test. Ideal = 1:1
- Cash Ratio is the strictest liquidity test — only cash & equivalents vs CL
- NWC should be 25% of CA as per Tandon Committee (NWC/CA = 25% when CR = 1.33)
- Negative NWC indicates CR < 1, a potential liquidity crisis
- Current Ratio has limitations — it's static, doesn't differentiate asset types, and varies by industry
- Two formulas for NWC: CA − CL or LTS − LTU (both give same answer)
- Debt Equity Ratio = 2:1 is ideal. Banks/FIs prefer declining DER
- TOL/TNW = 3:1 is considered satisfactory. Low ratio = more security for creditors
- Funded DER shows owner's stake in project financing; ideal < 60% of cost
- DSCR = 1.5 to 2 is the benchmark for Term Loan sanction; DSCR < 1 signals default risk
- To improve DSCR: increase sales, reduce costs, extend loan tenure, negotiate lower interest
- FAR ≤ 1 is healthy; FAR > 1 indicates diversion of funds. FAR is opposite of Loan to Value Ratio
- Profit Waterfall: Turnover → Gross Profit → Operating Profit → PBT → PAT → Retained Profit
- EPS = (Net Profit − Pref Dividend) / No. of Equity Shares — key metric for investors
- DPS = Total Dividends / No. of Shares
- Inventory Holding Period = 365 / STR (days); lower is better
- Higher turnover ratios indicate better management efficiency
- Working Capital Turnover = Net Sales / NWC — higher is better
- Lower collection period indicates faster debtor recovery
- Creditor's Payment Period — higher may indicate good reputation or cash stress
- Asset Turnover measures efficiency of generating sales from assets
- Capital Gearing: High gearing = more debt = higher risk for equity shareholders
- P/E Ratio: High P/E = market expects high future growth
- Times Interest Earned (EBIT / Interest) measures long-term solvency
- BEP in Units = Fixed Cost / Contribution; BEP in Value = (Fixed Cost × Sales) / Contribution
- Margin of Safety = (Sales − BEP Sales) / Sales — higher is better
- A single ratio isn't good or bad — always compare against past data, industry norms, and context
Interactive Ratio Calculator
Practice calculating liquidity, solvency, and profitability ratios:
Summary Cheat Sheet
| Concept / Topic | Key Details / Explanation |
|---|---|
| Financial Ratio | Relationship between two or more financial variables; expressed as percentage, proportion, or number of times |
| 5 Ratio Categories | Liquidity, Solvency, Turnover, Profitability, Capital Market |
| Ratio Interpretation | Never in isolation; compare against past data, industry norms, and context |
| Tangible Net Worth (TNW) | Net Worth - Intangible Assets (intangibles stripped as no liquidation value) |
| Total Outside Liabilities (TOL) | Long-Term Liabilities + Current Liabilities |
| Long-Term Sources (LTS) | Net Worth + Long-Term Liabilities |
| Long-Term Uses (LTU) | Fixed Assets + Non-current Assets + Intangible Assets |
| Net Working Capital (NWC) | CA - CL or LTS - LTU (both give same result) |
| Quick Assets | CA - Stock - Prepaid Expenses |
| Current Ratio | CA / CL; Ideal: 2:1 (global), 1.33:1 (RBI/India), 1.25:1 (MSME) |
| Current Ratio Significance | First ratio banker checks; used for WC limit sanction; too high may indicate accumulated stock |
| NWC/CA Relationship | At CR 1.33:1, NWC/CA = 25% (Tandon Committee); NWC should be 25% of CA |
| CR > 1 | Positive NWC; CR = 1 → NWC = 0; CR < 1 → Negative NWC (liquidity crisis) |
| Quick Ratio (Acid Test) | Quick Assets / CL; Ideal: 1:1; used for LC issuance and 1-2 month liquidity |
| Cash Ratio | Cash & Cash Equivalents / CL; strictest liquidity test |
| Liquidity Strictness Order | Current Ratio (lenient) > Quick Ratio > Cash Ratio (strictest) |
| Debt Equity Ratio (DER) | LTL / TNW; Ideal: 2:1; banks prefer declining DER |
| TOL/TNW Ratio | TOL / TNW; Ideal: 3:1; low ratio = more creditor security |
| Funded Debt-Equity Ratio | For project financing; ideal: funded debt < 60% of project cost |
| DSCR | (Net Profit + Depreciation + Interest) / (Principal + Interest); Benchmark: 1.5 to 2; DSCR < 1 = default risk |
| Improve DSCR | Increase sales, reduce costs, extend loan tenure, negotiate lower interest |
| Fixed Asset Ratio (FAR) | Term Loan / Fixed Assets; FAR ≤ 1 is healthy; FAR > 1 indicates fund diversion; opposite of Loan-to-Value |
| Gross Profit Margin | (Gross Profit / Sales) x 100 |
| Net Profit Margin | (Net Profit / Sales) x 100 |
| Operating Margin | (Operating Profit / Turnover) x 100 |
| ROCE | (Operating Profit / Capital Employed) x 100 |
| EPS | (Net Profit - Preference Dividend) / No. of Equity Shares — key investor metric |
| DPS | Total Dividends / No. of Shares |
| Stock Turnover Ratio (STR) | Cost of Goods Sold / Average Inventory; higher = better efficiency |
| Inventory Holding Period | 365 / STR days; lower is better |
| Debtors Turnover | Net Credit Sales / Average Debtors; higher = faster collection |
| Collection Period | 365 / Debtors Turnover; lower is better |
| Creditors Payment Period | 365 / Creditors Turnover; higher may indicate good reputation or cash stress |
| Working Capital Turnover | Net Sales / NWC; higher is better |
| Asset Turnover | Sales / Total Assets; measures efficiency of generating sales from assets |
| Capital Gearing | High gearing = more debt = higher risk for equity shareholders |
| P/E Ratio | Market Price / EPS; high P/E = market expects high future growth |
| Times Interest Earned | EBIT / Interest; measures long-term solvency |
| Profit Waterfall | Turnover → Gross Profit → Operating Profit → PBT → PAT → Retained Profit |
| Higher Turnover Ratios | Indicate better management efficiency |
| BEP in Ratios | BEP Units = Fixed Cost / Contribution; BEP Value = (FC x Sales) / Contribution |
| Margin of Safety | (Sales - BEP Sales) / Sales; higher is better |
Lesson Doubts
Ask questions, get expert answers