📉 Break-Even Analysis
Understanding Break-Even Point (BEP), contribution, fixed costs, variable costs, and margin of safety calculations for banking exams.
Break-Even Analysis
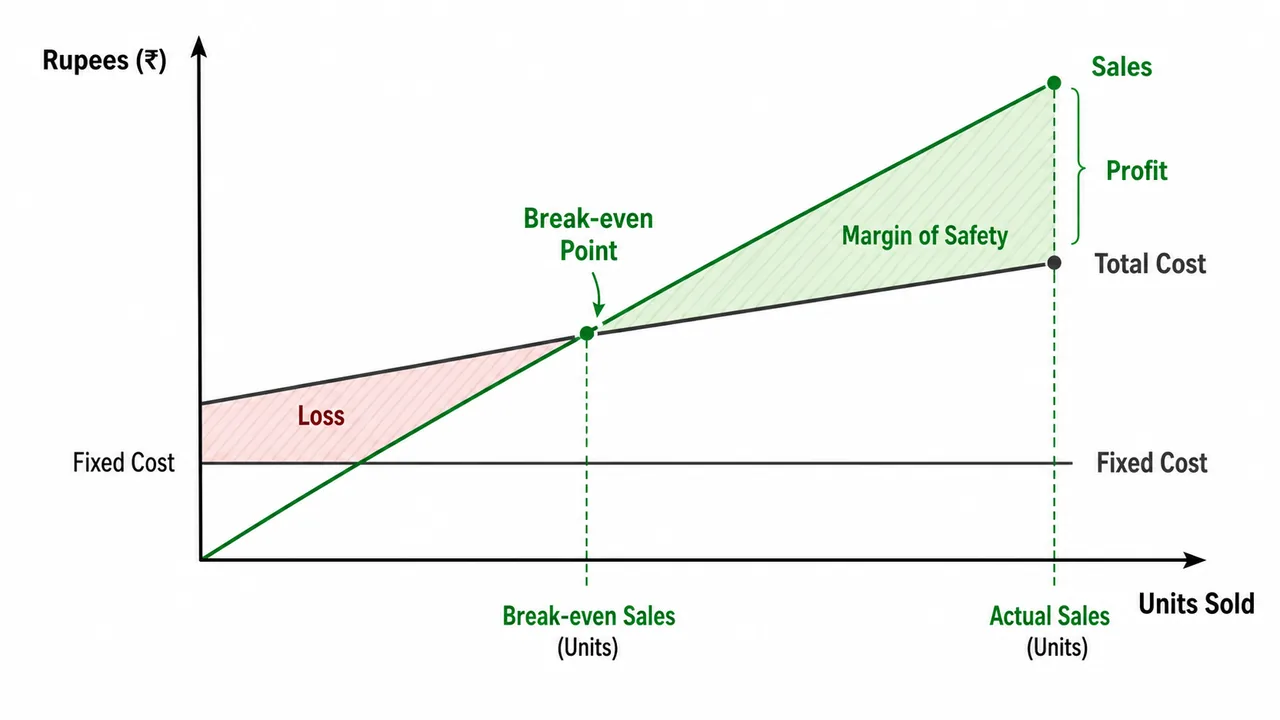
Break-Even Analysis is a critical financial tool used to determine the stage at which a company (or a new product) becomes profitable. The Break-Even Point (BEP) is that specific level of sales volume where Total Revenue equals Total Costs.
At this point, the company is in a no-profit, no-loss situation. It has earned enough to pay for all fixed and variable expenses, but has not yet generated a surplus.
Significance of BEP:
- Lower BEP is Better: It means the company starts earning profits at a lower sales volume. This implies lower risk.
- Higher BEP is Risky: The company needs to achieve high sales volume just to cover its costs. If sales drop slightly, it may incur losses.
Concepts in BEP
- Contribution
- Fixed cost
- Variable cost
- Margin of safety
Concept in BEP Analysis
1. Contribution
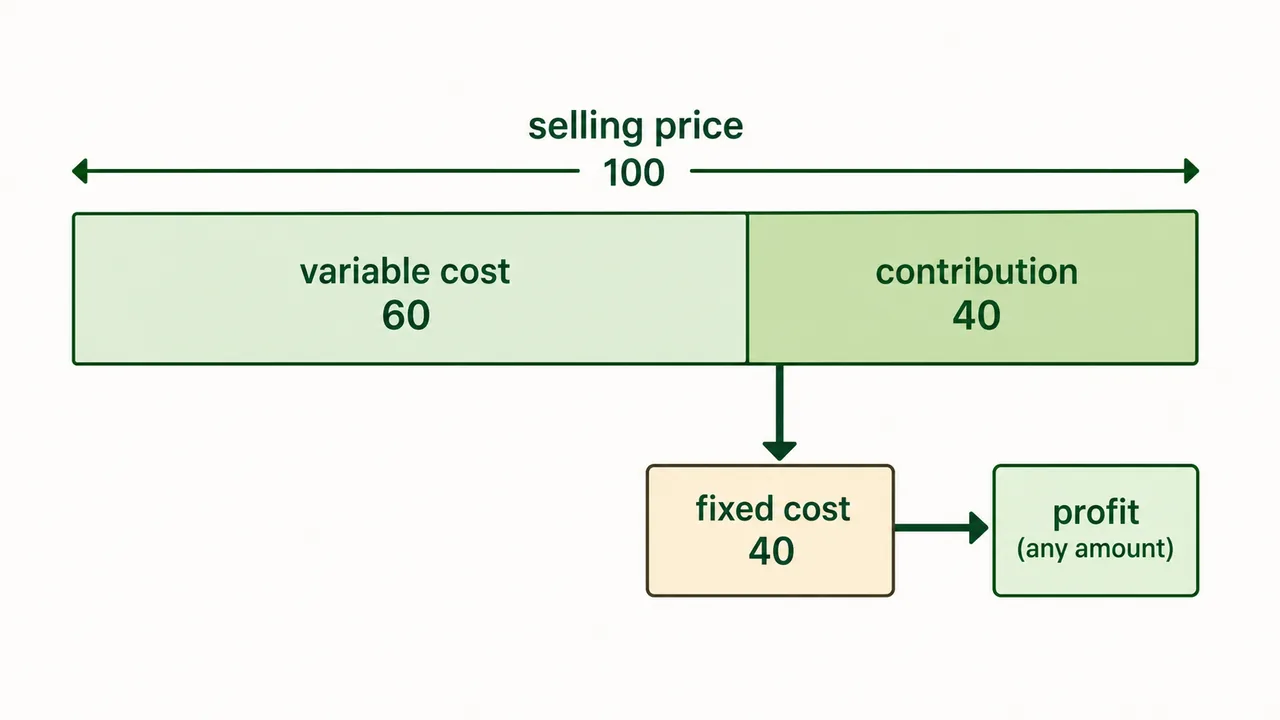
Contribution is the profitability potential of a product. It represents the amount of money left over from sales after covering all variable costs. This remaining amount helps in paying off fixed costs and generating profit.
Interactive Preview
Try the embedded exercise below. Full lesson access still requires Pro.
Pro Content Locked
Upgrade to Pro to access this lesson and all other premium content.
₹99 charged monthly · Cancel anytime
- All Agriculture & Banking Courses
- AI Lesson Questions (100/day)
- AI Doubt Solver (50/day)
- Glows & Grows Feedback (30/day)
- AI Section Quiz (20/day)
- 22-Language Translation (100/day)
- Recall Questions (20/day)
- AI Quiz (15/day)
- AI Quiz Paper Analysis (100/day)
- AI Step-by-Step Explanations (100/day)
- Spaced Repetition Recall (FSRS)
- AI Tutor
- Immersive Text Questions
- Audio Lessons — Hindi & English
- Mock Tests & Previous Year Papers
- Summary & Mind Maps
- XP, Levels, Leaderboard & Badges
- Generate New Classrooms
- Voice AI Teacher (AgriDots Live)
- AI Revision Assistant
- Knowledge Gap Analysis
- Interactive Revision (LangGraph)
🔒 Secure via Razorpay · Cancel anytime · No hidden fees
Break-Even Analysis
Break-Even Analysis is a critical financial tool used to determine the stage at which a company (or a new product) becomes profitable. The Break-Even Point (BEP) is that specific level of sales volume where Total Revenue equals Total Costs.
At this point, the company is in a no-profit, no-loss situation. It has earned enough to pay for all fixed and variable expenses, but has not yet generated a surplus.
Significance of BEP:
- Lower BEP is Better: It means the company starts earning profits at a lower sales volume. This implies lower risk.
- Higher BEP is Risky: The company needs to achieve high sales volume just to cover its costs. If sales drop slightly, it may incur losses.
Concepts in BEP
- Contribution
- Fixed cost
- Variable cost
- Margin of safety
Concept in BEP Analysis
1. Contribution
Contribution is the profitability potential of a product. It represents the amount of money left over from sales after covering all variable costs. This remaining amount helps in paying off fixed costs and generating profit.
- Formula:
- Per Unit: Selling Price (SP) − Variable Cost (VC)
- Total: Total Sales − Total Variable Cost
- Alternative: Fixed Cost + Profit
Example: If Selling Price (SP) = 100, Variable Cost (VC) = 60, and Fixed Cost (FC) = 40:
- Contribution per unit = 100 − 60 = 40
- This Rs.40 first goes to cover the Fixed Costs. Once Fixed Costs are covered, any further Contribution is purely Profit.
2. Variable Cost
These are costs that change directly with the level of production or sales. If production increases, variable costs increase proportionally.
- Examples:
- Raw Material cost
- Power and Fuel expenses
- Wages of temporary/daily laborers
- Packaging cost
- Key Characteristic: Variable Cost per unit remains constant, but Total Variable Cost changes with volume.
3. Fixed Cost
These are costs that remain constant regardless of the level of production or sales (up to a certain capacity). They must be paid even if production is zero.
- Examples:
- Rent of factory/office
- Salaries of permanent staff
- Insurance premiums
- Depreciation of machinery
- Interest on Term Loans
- Key Characteristic: Total Fixed Cost remains constant, but Fixed Cost per unit decreases as production increases (Economies of Scale).
4. Margin of Safety (MoS)
Margin of Safety represents the buffer zone for the business. It is the difference between actual sales and break-even sales.
- Formula: Total Sales − Break-Even Sales
- Interpretation:
- High MoS: The business is safe and making good profit. A small drop in sales won't cause losses.
- Low MoS: The business is near the danger zone. A small drop in sales could push it into loss.
- Profit Relationship: Profit = Margin of Safety × Contribution per unit
Calculation of Break-Even Point
The Logic: How many units must we sell to cover our Fixed Costs? Since the Variable Cost is already covered by the Selling Price, every unit sold contributes a small "surplus" (Contribution) towards the Fixed Cost bucket. We calculate how many such units are needed to fill that bucket completely.
Formula
Example 1:
If fixed cost is Rs.1 lac and contribution per unit Rs.40, the break even =
**Answer**
BEP = 100000 / 40 = 2500 units
Understanding BEP Output:
In this case, if the firm produces:
- less than 2500 units, it will incur loss
- at 2500 units, no profit no loss and
- above 2500 units, profit
Example 2: Calculate BEP Sales
Given:
- Fixed cost = Rs.2000
- VC = Rs.2
- SP = Rs.4
Calculate BEP sales?
**Answer**
Step 1: Calculate Contribution per unit
Contribution = SP − VC = 4 − 2 = 2
Step 2: Calculate BEP in units
BEP = Total Fixed cost / Contribution per unit
BEP = 2000 / 2
BEP = 1000 units
Step 3: Calculate BE Sales
BE Sales = BEP units × SP
BE Sales = 1000 × 4
BE Sales = Rs.4000
Calculating Margin of Safety
While the concept essentially represents the "safety zone", for exam purposes, we calculate it using units or revenue. It validates how much sales can fall before the company starts making a loss.
- MoS = Total Sales − Break-Even Sales
- Profit Calculation Assumption: Since Fixed Costs are fully covered at the Break-Even point, any sale above BEP contributes directly to profit (Profit = MoS Units × Contribution per unit).
Case Study:
SP Rs.90, variable cost Rs.60 per unit, FC Rs.1 lac and total units produced 5000. What will be no. of BE units, MoS and Profit?
**Answer**
Step 1: Calculate Contribution
Contribution = SP − VC = 90 − 60 = 30
Step 2: Calculate BE Units
BE Units = 100000 / 30 = 3333
Step 3: Calculate MoS
MoS = 5000 − 3333 = 1667
Step 4: Calculate Profit
Profit = 1667 × 30 = 50000
Installed Capacity Break-Even
This ratio expresses the Break-Even Point as a percentage of the firm's total installed capacity (maximum possible production).
- Purpose: It helps banks understand if the project is viable given the maximum production limits.
- Interpretation: A project with a BEP of 90% of installed capacity is very risky because there is little room for error or machine downtime. A BEP of 40-50% is generally preferred.
Formula
× 100Example:
Firm-Z has total capacity to manufacture 6000 units. It is manufacturing 4000 units. Its break-even is at 2500 units.
What is the installed capacity break-even?
**Answer**
Installed Capacity BE = BE Units / total capacity %
= 2500 / 6000 × 100 = 41.7%
Capacity Utilization Break-Even
This ratio expresses the Break-Even Point as a percentage of the current actual production level. It indicates how close the current operations are to the danger line.
- Purpose: Used to monitor ongoing performance.
- Interpretation: If this percentage is high (e.g., 95%), it means the firm is barely scraping by. If it is low (e.g., 60%), the firm has a healthy cushion in its current operations.
Formula
× 100Example:
If the firm has total capacity to manufacture 6000 units. It is manufacturing 4000 units. The break-even is at 2500 units.
What is the capacity utilisation break-even?
**Answer**
= BE Units / Total units produced %
= 2500 / 4000 × 100 = 62.5%
Decision Making Based on Break-Even
Banks use Break-Even Analysis to assess the risk of a term loan. Comparing the BEP of two firms helps in choosing the one with a higher safety margin.
General Rule: Between two firms with similar profiles, the one with the Lower Break-Even Point (as a % of capacity) is always preferred because it has a higher margin of safety and can withstand market downturns better.
Case-1:
Firm A has break-even at 52% installed capacity utilization and Firm B at 50%. Actual production in both cases is 51% of installed capacity?
Which firm would the bank prefer to finance if all other financials are similar.
| Firm-A | Firm-B | |
|---|---|---|
| Installed capacity Break-Even | 52% | 50% |
| Actual production | 51% | 51% |
| Profit / loss | Loss | Profits |
Answer: Bank will prefer Firm B (producing above BEP, hence profitable)
Case-2:
Firm A projects 52% installed capacity break-even and Firm B 55%.
Bank is approached for financing. Other things remaining same, the bank will give preference to which of these two?
| Firm-A | Firm-B | |
|---|---|---|
| Installed capacity Break-Even | 52% | 55% |
| Comparison of profit / loss | Higher | Lower |
Answer: Bank will prefer Firm A (lower BEP = higher profit potential)
Break-Even Calculation Based on Total Sale
Case-1:
Fixed cost is Rs.80000. Profit Rs.20000. Variable cost Rs.1 lac and sales Rs.2 lac. Calculate Break-even sales?
**Answer**
Formula: BE sale = (Sales × FC) / contribution
Step 1: Calculate Contribution
Contribution = Sales − Variable Cost = Rs.2 lac − 1 lac = Rs.1 lac
Step 2: Calculate BE Sale
BE Sale = 200000 × 80000 / 100000 = 160000
Case-2:
Selling price is Rs.100, variable cost Rs.60 per unit, fixed cost Rs.1 lac and total units produced 5000. What will be BE, BE sales, MoS and Profit?
**Answer**
Step 1: Calculate Contribution
Contribution = SP − VC = 100 − 60 = 40
Step 2: Calculate BE Units
BE Units = 100000 / 40 = 2500
Step 3: Calculate BE Sales
BE Sales = 2500 × 100 = 250000
Step 4: Calculate MoS
MoS = 5000 − 2500 = 2500
Step 5: Calculate Profit
Profit = 2500 × 40 = 100000
Key Formulas Summary
| Concept | Formula |
|---|---|
| Contribution (Total) | Sales − Variable Cost |
| Contribution (Per Unit) | Selling Price − Variable Cost |
| BEP (in units) | Total Fixed Cost / Contribution per unit |
| BEP (in sales value) | BEP units × Selling Price |
| BE Sale (from totals) | (Sales × FC) / Contribution |
| Margin of Safety | Total Sales units − BEP units |
| Profit | MoS × Contribution |
| Installed Capacity BE | BE Units / Total Capacity × 100 |
| Capacity Utilization BE | BE Units / Units Produced × 100 |
Key Takeaways
- BEP is the sales level where Sales = Cost (no profit, no loss)
- Higher BEP = Lower profit potential
- Lower BEP = Higher profit potential
- Contribution = Sales − Variable Cost = Fixed Cost + Profit
- Fixed costs don't change with sales level (rent, salaries)
- Variable costs change with sales level (raw materials, wages)
- Margin of Safety = Actual Sales − BEP Sales (buffer zone for profit)
- Profit = MoS × Contribution per unit
- Installed Capacity BE = BEP as % of total capacity
- Capacity Utilization BE = BEP as % of actual production
- Lower BEP % is preferred by banks for financing
Interactive Break-Even Calculator
Practice calculating BEP, contribution, margin of safety, and compare firms:
Summary Cheat Sheet
| Concept / Topic | Key Details / Explanation |
|---|---|
| Break-Even Point (BEP) | Sales level where Total Revenue = Total Costs (no profit, no loss) |
| Lower BEP | Better — profits start at lower sales volume; lower risk |
| Higher BEP | Risky — needs high sales just to cover costs |
| Contribution (Per Unit) | Selling Price (SP) - Variable Cost (VC); amount left after covering VC to pay FC and generate profit |
| Contribution (Total) | Total Sales - Total Variable Cost; also equals Fixed Cost + Profit |
| Variable Cost | Changes directly with production/sales (raw materials, power, fuel, temporary wages, packaging) |
| Variable Cost Per Unit | Remains constant; Total VC changes with volume |
| Fixed Cost | Remains constant regardless of production (rent, permanent salaries, insurance, depreciation, interest on TL) |
| Fixed Cost Per Unit | Decreases as production increases (economies of scale) |
| Margin of Safety (MoS) | Total Sales - Break-Even Sales; the buffer zone before losses begin |
| High MoS | Business is safe; small sales drop won't cause losses |
| Low MoS | Near danger zone; small sales drop could push into loss |
| BEP Formula (Units) | Total Fixed Cost / Contribution per unit |
| BEP Formula (Sales Value) | BEP units x Selling Price |
| BE Sale (from Totals) | (Sales x Fixed Cost) / Total Contribution |
| Profit Formula | MoS x Contribution per unit (since FC fully covered at BEP) |
| Installed Capacity BE | (BE Units / Total Capacity) x 100; shows BEP as % of max production; 40-50% preferred |
| Capacity Utilization BE | (BE Units / Actual Units Produced) x 100; shows how close current operations are to danger line |
| High Installed Capacity BE (e.g., 90%) | Very risky — little room for error or downtime |
| Bank Preference | Between similar firms, prefer the one with lower BEP (as % of capacity) — higher safety margin |
| Decision Rule | Firm producing above BEP = profitable; firm producing below BEP = loss |
| Example: SP=100, VC=60, FC=1 lac, 5000 units | Contribution=40; BEP=2500 units; BE Sales=Rs.2.5 lac; MoS=2500 units; Profit=Rs.1 lac |
| Example: FC=2000, VC=2, SP=4 | Contribution=2; BEP=1000 units; BE Sales=Rs.4000 |
| Example: SP=90, VC=60, FC=1 lac, 5000 units | Contribution=30; BEP=3333 units; MoS=1667 units; Profit=Rs.50,000 |
| Installed Cap BE Example | Capacity 6000, BEP 2500 → 41.7% installed capacity BE |
| Capacity Util BE Example | Actual production 4000, BEP 2500 → 62.5% capacity utilization BE |
Lesson Doubts
Ask questions, get expert answers