🛠 Farm Business Analysis: Financial Statements, Ratios & Performance Measures
Master farm accounting, balance sheets, income statements, and key financial ratios (current, debt-equity, operating, gross) used to evaluate farm business performance.
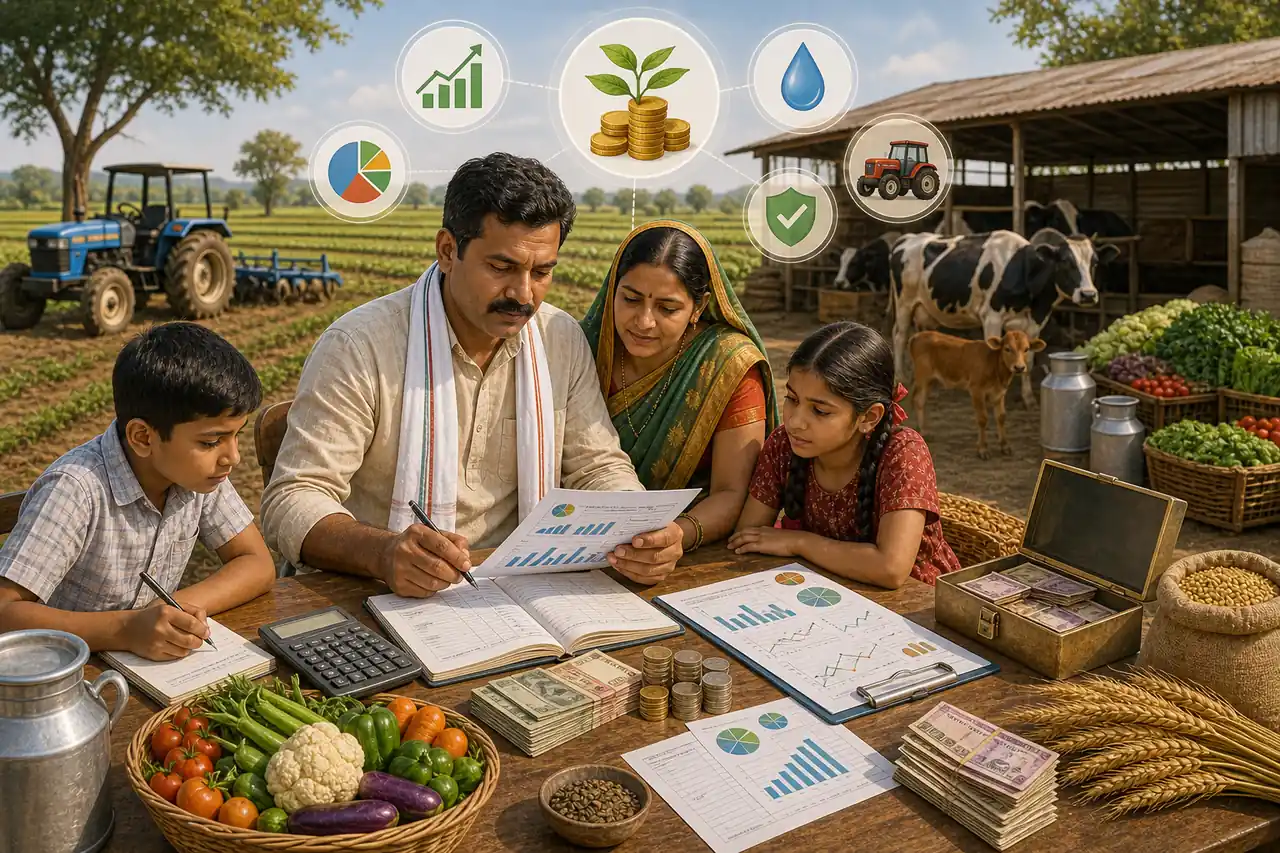
Starting Point: Why Does a Farmer Need Accounts?
A paddy farmer in Andhra Pradesh grows 50 quintals per hectare and feels satisfied. But is his farm actually profitable? Without systematic records, he cannot tell whether rising input costs are eating into his margins, whether his tractor is earning its keep, or whether his debt is growing dangerously. Farm business analysis provides the tools to answer these questions with numbers, not guesses.
This is why farm business analysis matters: production alone does not reveal whether the farm is liquid, solvent, efficient, or truly profitable. Records and ratios turn physical farming results into financial judgment.
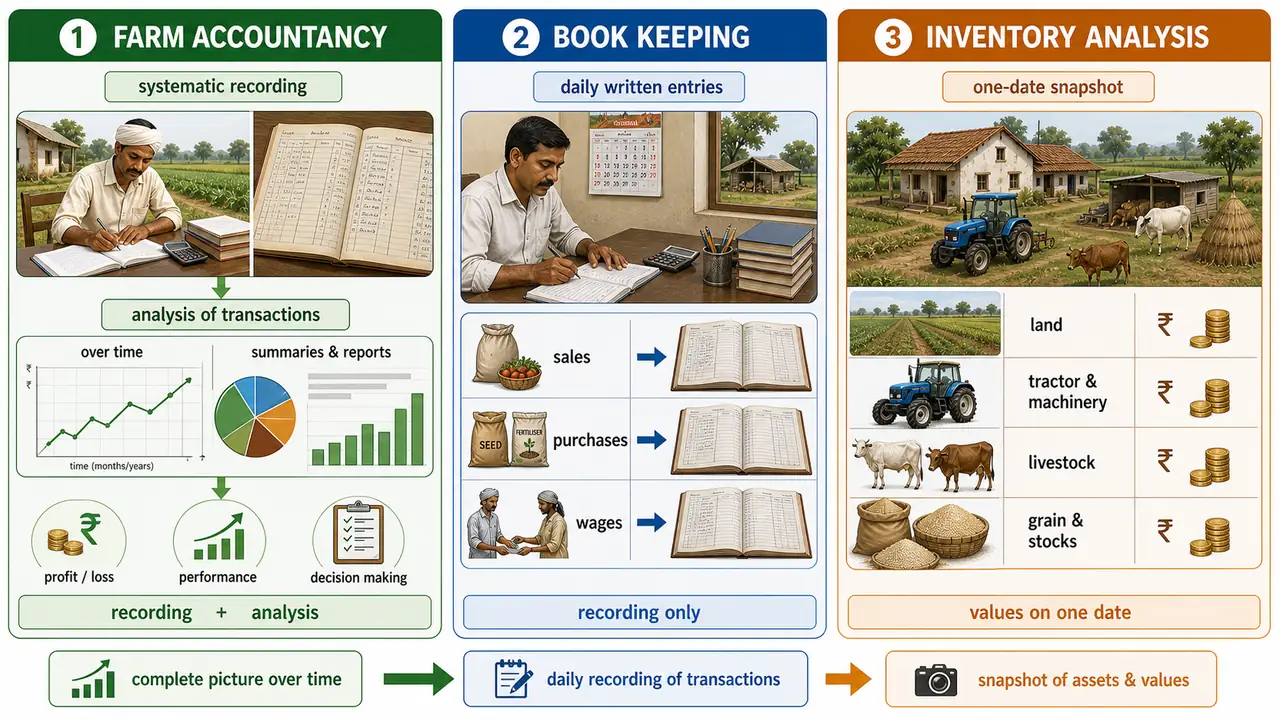
Farm Business Analysis: The Three Pillars
Farm business analysis goes by several names, each emphasizing a different aspect:
| Tool | What It Does | Agricultural Example |
|---|---|---|
| Farm Accountancy | Records transactions systematically so financial effects can be ascertained at any time | Recording every purchase of fertilizer, seed, and diesel throughout the kharif season |
| Farm Book Keeping | The recording aspect -- maintaining a written history of all financial transactions | Writing daily entries of milk sold, feed purchased, and wages paid |
| Farm Inventory Analysis | A snapshot of all physical properties and their values at a specific date | Listing all assets (land, cattle, machinery, stored grain) on 1st April |
Farm accountancy includes both recording and analysis, while book keeping focuses only on recording.
Pro Content Locked
Upgrade to Pro to access this lesson and all other premium content.
₹99 charged monthly · Cancel anytime
- All Agriculture & Banking Courses
- AI Lesson Questions (100/day)
- AI Doubt Solver (50/day)
- Glows & Grows Feedback (30/day)
- AI Section Quiz (20/day)
- 22-Language Translation (100/day)
- Recall Questions (20/day)
- AI Quiz (15/day)
- AI Quiz Paper Analysis (100/day)
- AI Step-by-Step Explanations (100/day)
- Spaced Repetition Recall (FSRS)
- AI Tutor
- Immersive Text Questions
- Audio Lessons — Hindi & English
- Mock Tests & Previous Year Papers
- Summary & Mind Maps
- XP, Levels, Leaderboard & Badges
- Generate New Classrooms
- Voice AI Teacher (AgriDots Live)
- AI Revision Assistant
- Knowledge Gap Analysis
- Interactive Revision (LangGraph)
🔒 Secure via Razorpay · Cancel anytime · No hidden fees
Starting Point: Why Does a Farmer Need Accounts?
A paddy farmer in Andhra Pradesh grows 50 quintals per hectare and feels satisfied. But is his farm actually profitable? Without systematic records, he cannot tell whether rising input costs are eating into his margins, whether his tractor is earning its keep, or whether his debt is growing dangerously. Farm business analysis provides the tools to answer these questions with numbers, not guesses.
This is why farm business analysis matters: production alone does not reveal whether the farm is liquid, solvent, efficient, or truly profitable. Records and ratios turn physical farming results into financial judgment.
Farm Business Analysis: The Three Pillars
Farm business analysis goes by several names, each emphasizing a different aspect:
| Tool | What It Does | Agricultural Example |
|---|---|---|
| Farm Accountancy | Records transactions systematically so financial effects can be ascertained at any time | Recording every purchase of fertilizer, seed, and diesel throughout the kharif season |
| Farm Book Keeping | The recording aspect -- maintaining a written history of all financial transactions | Writing daily entries of milk sold, feed purchased, and wages paid |
| Farm Inventory Analysis | A snapshot of all physical properties and their values at a specific date | Listing all assets (land, cattle, machinery, stored grain) on 1st April |
Farm accountancy includes both recording and analysis, while book keeping focuses only on recording.
Farm Inventory
A farm inventory is a complete list of all physical properties of the farm along with their values at a specified date. By comparing inventories at the beginning and end of the year, the farmer can determine whether the farm business is growing or declining.
Agricultural example: On 1st April 2025, a farmer lists: 5 ha land (Rs. 50 lakh), 3 buffaloes (Rs. 2.4 lakh), one tractor (Rs. 4 lakh), stored wheat 20 quintals (Rs. 45,000), cash Rs. 30,000. On 31st March 2026, the same list shows whether the farm's total worth has increased or decreased.
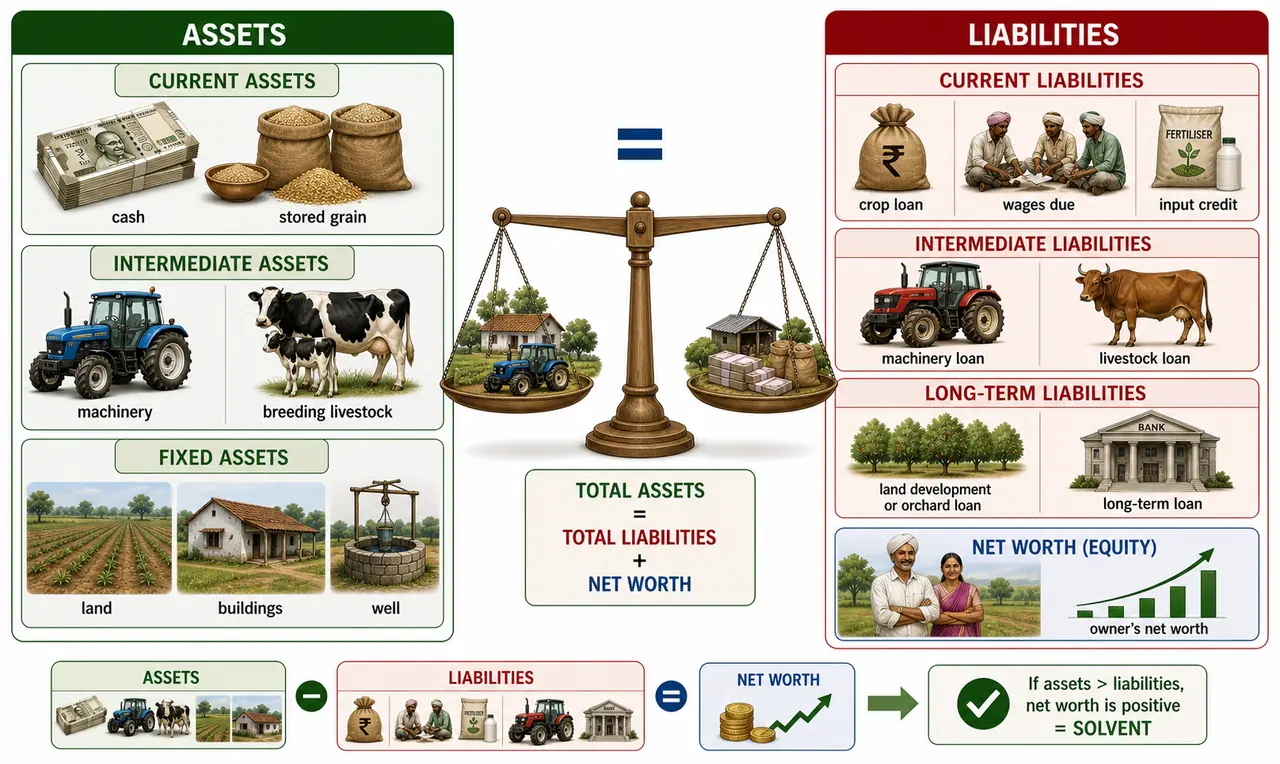
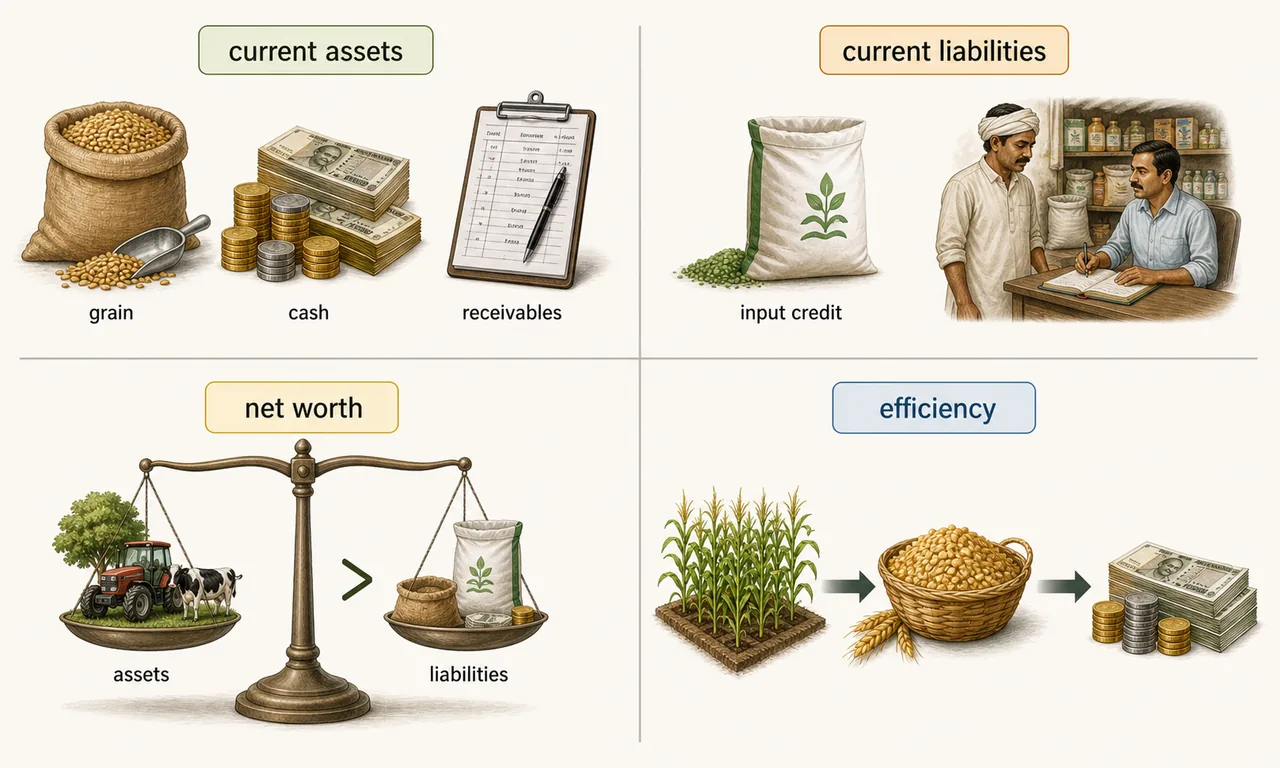
Assets: What the Farm Owns
Assets are classified by liquidity -- how easily they can be converted to cash:
| Asset Type | Duration | Agricultural Examples | Liquidity |
|---|---|---|---|
| Current Assets | Converted within 1 year | Cash in hand, harvested crops, feed stock, market-ready livestock | Highest |
| Intermediate (Working) Assets | Last 2 to 5 years | Farm machinery, equipment, breeding livestock, draft animals | Medium |
| Fixed (Long-term) Assets | Permanent or many years | Land, farm buildings, wells, orchard trees | Lowest |
Agricultural example: A dairy farmer's current assets include milk receivables and stored fodder; intermediate assets include milking machines and young heifers; fixed assets include the cattle shed and land.
Liabilities: What the Farm Owes
Liabilities are classified to match the asset categories:
| Liability Type | Repayment Period | Agricultural Examples |
|---|---|---|
| Current Liabilities | Within 1 year | Crop loans (KCC), fertilizer bought on credit, hired labour wages due |
| Intermediate Liabilities | 2 to 5 years | Livestock loans, machinery loans, pump set loans |
| Long-term Liabilities | 5+ years | Tractor loan, land development loan, orchard establishment loan |
NOTE
The classification of assets mirrors liabilities: current assets match current liabilities, intermediate assets match intermediate liabilities, and fixed assets match long-term liabilities. This matching is crucial for assessing financial health.
Balance Sheet (Net Worth Statement)
The balance sheet shows the farm's financial position at a specific point in time.
Structure:
- Left side: Assets (Current + Intermediate + Fixed)
- Right side: Liabilities + Net Worth (Equity)
Key equation:
Total Assets = Total Liabilities + Net Worth
- If Assets > Liabilities: the farm has a positive net worth (solvent)
- If Liabilities > Assets: the farm has a net deficit (financial distress)
Net worth is placed on the right side so that both sides balance -- hence the name "balance sheet."
IMPORTANT
Net Worth = Total Assets - Total Liabilities. This equation must always hold true. If it does not balance, there is an error in the accounts.
Balance Sheet Ratios
These ratios evaluate the farm's financial health and stability from different angles.
Current Ratio
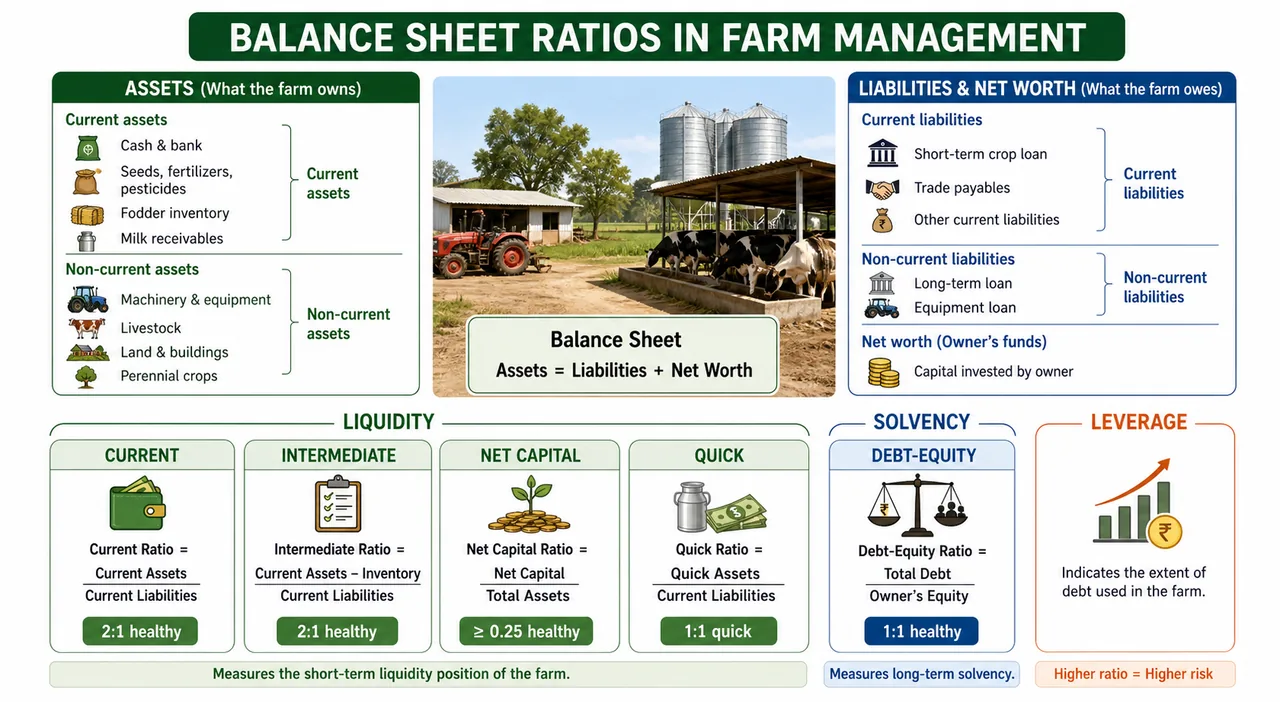
Shows short-term liquidity (within 1 year). A ratio of 2:1 or higher is generally healthy.
Agricultural example: A farmer has Rs. 3 lakh in current assets (stored grain + cash) and Rs. 1.5 lakh in current liabilities (crop loan). Current ratio = 2:1 -- the farm can comfortably meet short-term obligations.
Intermediate (Working) Ratio
Shows liquidity over 2 to 5 years. Assesses whether the farm can meet medium-term debt by liquidating current and intermediate assets.
Net Capital Ratio
Shows long-term solvency. A ratio greater than 1 means the farm can meet all obligations if all assets were sold. This is the broadest measure of financial safety.
Acid Test (Quick) Ratio
The most stringent liquidity test. Considers only the most liquid assets (cash + receivables), excluding inventory. A ratio of 1:1 or higher is desirable.
Agricultural example: Can the farmer pay immediate debts without selling stored grain? The quick ratio answers this.
Debt-Equity Ratio (Leverage Ratio)
A ratio of less than 1 means the farmer's own capital exceeds borrowed capital -- a safer position. Higher leverage increases risk, especially in bad crop years.
Comparison of Balance Sheet Ratios
| Ratio | Formula | Measures | Healthy Value |
|---|---|---|---|
| Current Ratio | Current Assets / Current Liabilities | Short-term liquidity (1 year) | 2:1 or higher |
| Intermediate Ratio | (Current + Intermediate Assets) / (Current + Intermediate Liabilities) | Medium-term liquidity (2-5 years) | > 1 |
| Net Capital Ratio | Total Assets / Total Liabilities | Long-term solvency | > 1 |
| Quick Ratio | (Cash + Receivables) / Current Liabilities | Immediate liquidity (no inventory) | 1:1 or higher |
| Debt-Equity Ratio | Total Liabilities / Net Worth | Financial leverage | < 1 |
TIP
Exam mnemonic -- "CINQD" (think "sinked" -- a farm sinks if ratios are bad): Current, Intermediate, Net capital, Quick, Debt-equity. Remember: Current and Quick ratios should be high; Debt-equity ratio should be low.
Income Statement (Profit and Loss Statement)
While the balance sheet shows position at a point in time, the income statement shows performance over a period (typically one agricultural year).
Receipts (Income Side)
Includes:
- Sale of crop produce (paddy, wheat, vegetables)
- Supplementary products (milk, eggs, honey)
- Appreciation in asset values (e.g., land value increase)
Not included: Sale of capital assets (selling a tractor converts one asset form to another -- it is not operational income).
Expenses (Cost Side)
Includes:
- Operating costs (seed, fertilizer, labour, pesticides)
- Fixed costs (depreciation on machinery, buildings, equipment)
Not included: Purchase of capital assets (buying a tractor is an investment, not an operating expense).
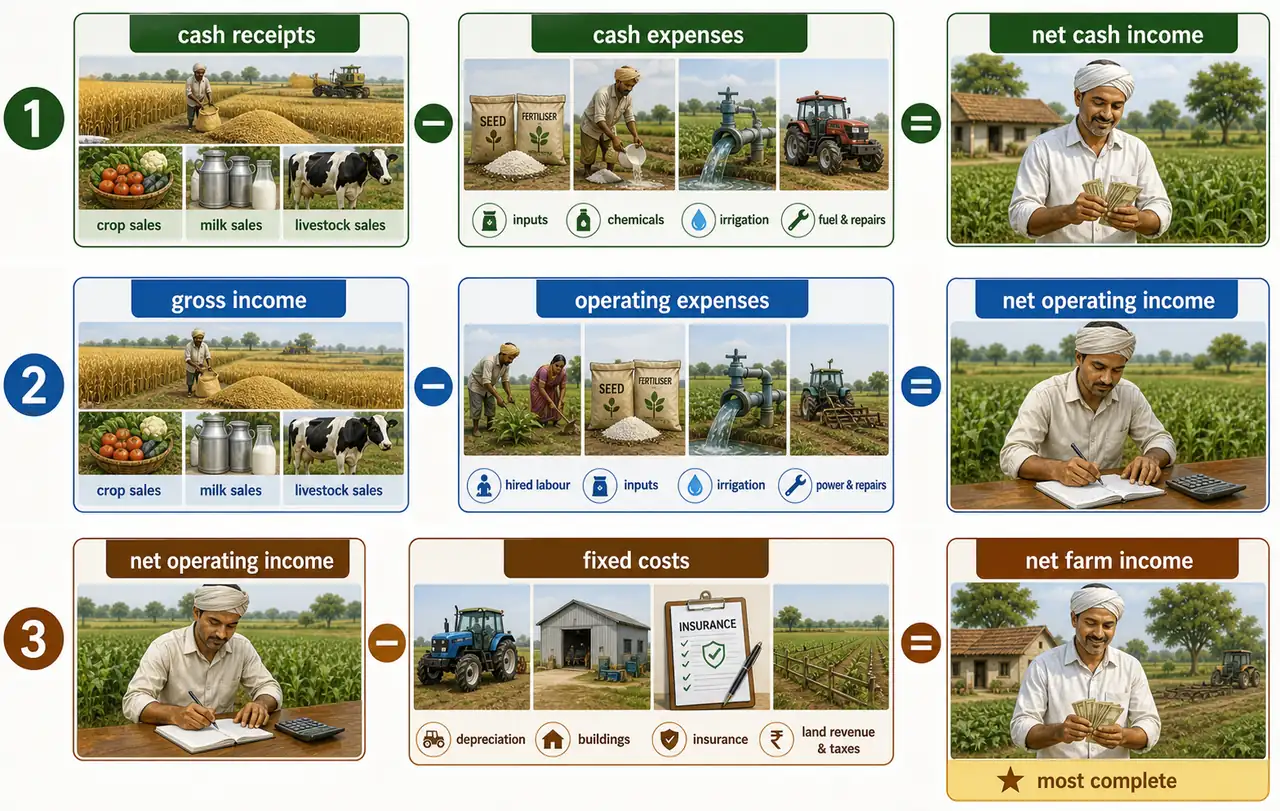
Three Measures of Net Income
Each measure provides a different perspective on profitability:
| Measure | Formula | What It Shows | Agricultural Example |
|---|---|---|---|
| Net Cash Income | Cash Receipts - Cash Expenses | Actual cash left over (simplest) | Farmer received Rs. 5 lakh cash, paid Rs. 3 lakh cash = Rs. 2 lakh NCI |
| Net Operating Income | Gross Income - Operating Expenses | Day-to-day operational profitability (excludes fixed costs) | Shows if crop production itself is profitable |
| Net Farm Income | Net Operating Income - Fixed Costs | Most complete measure; return to owned capital + family labour | The true bottom line of farm performance |
TIP
Exam hierarchy: Net Cash Income (simplest) → Net Operating Income (deducts operating costs) → Net Farm Income (deducts all costs = most comprehensive measure).
Income Statement Ratios
These ratios assess operational efficiency.
Operating Ratio
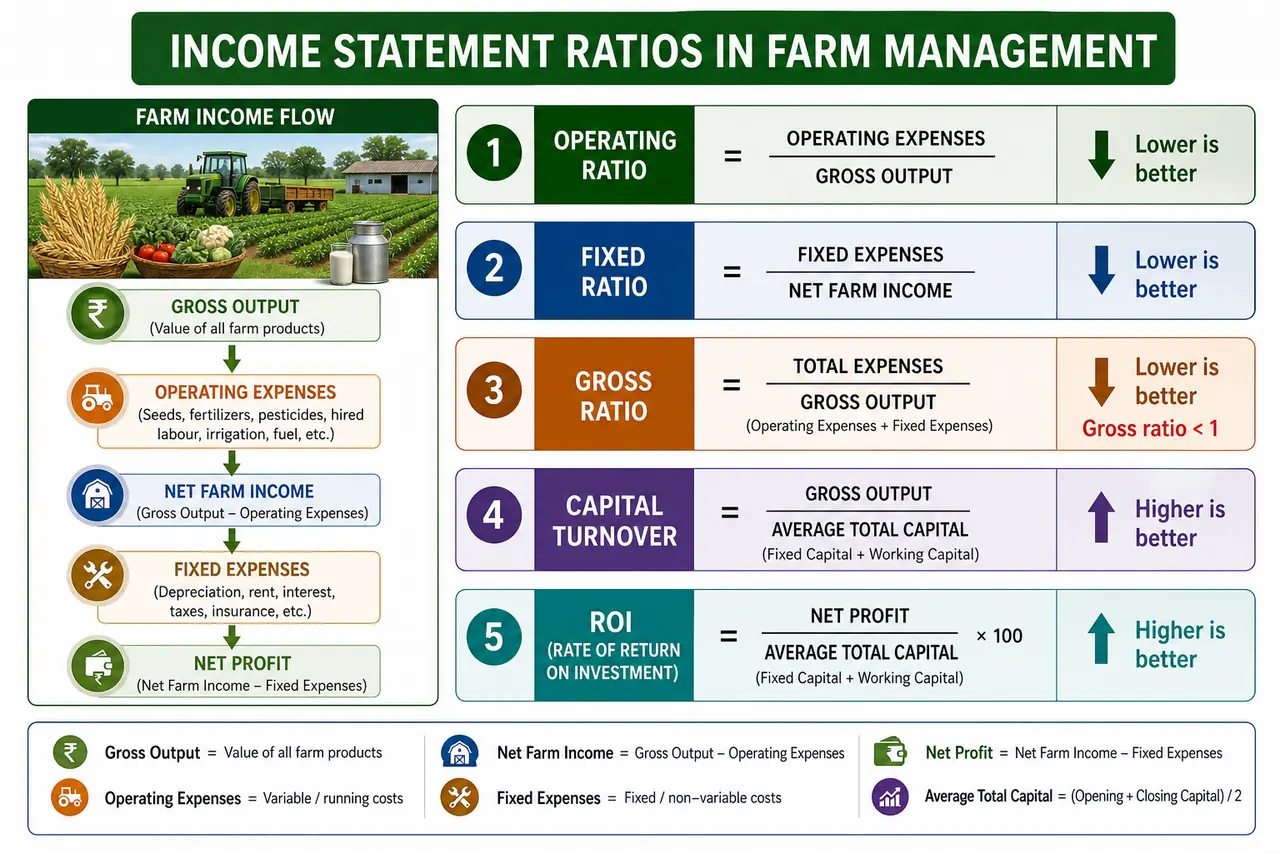
Proportion of gross income consumed by operating expenses. Lower is better. A value of less than 0.65 (65%) is considered good.
Fixed Ratio
Proportion of gross income going toward fixed costs. Lower fixed ratio = more flexibility during low-income years.
Gross Ratio
The most comprehensive efficiency measure. Gross Ratio = Operating Ratio + Fixed Ratio. A value less than 1 means the farm is profitable. The lower, the better.
Capital Turnover Ratio
Shows how effectively capital generates income. Higher is better -- more income per rupee invested.
Rate of Return on Investment
The percentage return earned on total capital invested. Compare with bank fixed deposit rates to judge whether farming is a worthwhile use of capital.
Income Statement Ratios at a Glance
| Ratio | Measures | Good Value | Interpretation |
|---|---|---|---|
| Operating Ratio | Operating efficiency | < 0.65 | Lower = more efficient |
| Fixed Ratio | Fixed cost burden | Lower the better | High = vulnerable in bad years |
| Gross Ratio | Overall profitability | < 1 | < 1 = profitable |
| Capital Turnover | Capital efficiency | Higher the better | More income per rupee invested |
| Rate of Return | % return on investment | > bank FD rate | Justifies farming over alternative investments |
Management Ratios
These isolate the contribution of the farmer's management skill:
| Ratio | What It Measures | Agricultural Example |
|---|---|---|
| Management Return | Net farm income minus unpaid family labour wages minus interest on owned capital | If positive, the farmer earns a reward for management skill |
| Crop Yield & Value | Productivity of crop enterprises | Higher yield per hectare = better management |
| Livestock Income | Productivity of livestock enterprises | Higher milk yield per buffalo = better feeding and health management |
| Gross Income per Man | Labour productivity | Rs. 2 lakh gross income with 2 workers = Rs. 1 lakh per man |
| Gross Income per Rupee Investment | Capital efficiency | Rs. 5 lakh income on Rs. 10 lakh investment = Rs. 0.50 per rupee |
NOTE
If management return is negative, the farmer would have been better off working as hired labour and lending out capital at interest. This is a critical indicator for exam questions.
Summary Cheat Sheet
| Concept / Topic | Key Details / Explanation |
|---|---|
| Farm Accountancy | Systematic recording + analysis of all financial transactions |
| Farm Book Keeping | Only the recording aspect — maintaining written history of transactions |
| Farm Inventory | Snapshot of all physical properties and values at a specific date; compare start and end of year |
| Current Assets | Converted within 1 year — cash, harvested crops, feed stock, market-ready livestock |
| Intermediate Assets | Last 2-5 years — machinery, equipment, breeding livestock, draft animals |
| Fixed (Long-term) Assets | Permanent or many years — land, buildings, wells, orchard trees |
| Current Liabilities | Due within 1 year — crop loans (KCC), fertilizer credit, hired labour wages |
| Intermediate Liabilities | Due in 2-5 years — livestock loans, machinery loans |
| Long-term Liabilities | Due in 5+ years — tractor loan, land development loan |
| Balance Sheet Equation | Total Assets = Total Liabilities + Net Worth; Net Worth = Assets - Liabilities |
| Current Ratio | Current Assets / Current Liabilities; measures short-term liquidity; healthy: 2:1 or higher |
| Intermediate Ratio | (Current + Intermediate Assets) / (Current + Intermediate Liabilities); medium-term liquidity; > 1 |
| Net Capital Ratio | Total Assets / Total Liabilities; measures long-term solvency; > 1 |
| Quick (Acid Test) Ratio | (Cash + Receivables) / Current Liabilities; most stringent test; healthy: 1:1 |
| Debt-Equity Ratio | Total Liabilities / Net Worth; measures leverage; healthy: < 1 |
| Net Cash Income | Cash Receipts - Cash Expenses; simplest measure |
| Net Operating Income | Gross Income - Operating Expenses; day-to-day operational profitability |
| Net Farm Income | Net Operating Income - Fixed Costs; most complete measure; return to owned capital + family labour |
| Operating Ratio | Operating Expenses / Gross Income; good: < 0.65; lower = more efficient |
| Fixed Ratio | Fixed Costs / Gross Income; lower = more flexibility in bad years |
| Gross Ratio | (Operating + Fixed Costs) / Gross Income; profitable if < 1; = Operating Ratio + Fixed Ratio |
| Capital Turnover Ratio | Gross Income / Total Capital; higher is better — more income per rupee invested |
| Rate of Return on Investment | (Net Farm Income / Total Investment) x 100; compare with bank FD rate |
| Management Return | Net Farm Income - unpaid family labour wages - interest on owned capital; if negative, farming not worthwhile |
| CINQD Mnemonic | Current, Intermediate, Net capital, Quick, Debt-equity (balance sheet ratios) |