🚴 Agricultural Project Planning & Appraisal
Project definition, characteristics, types, project cycle, and appraisal techniques (NPW, BCR, IRR, NBIR, Sensitivity Analysis) for agricultural investments
What is a Project?
Imagine a farmer in Rajasthan wants to build a drip irrigation system for 50 hectares. This is not a routine daily activity like watering crops — it has a clear start date, an end date, a fixed budget, and a measurable goal (irrigating 50 ha). This is a project.
A project is a specific, one-time activity with:
- A defined starting point and ending point
- A specific objective to accomplish
- Measurable costs and returns (what distinguishes it from vague development efforts)
- A geographic location or area of concentration
- A target group it intends to benefit
- A time sequence of investment and production activities
Example: A watershed development project in Andhra Pradesh targets farmers in a specific micro-watershed. It follows phased activities — survey, soil treatment, check dam construction, plantation, and finally maintenance.
Pro Content Locked
Upgrade to Pro to access this lesson and all other premium content.
₹99 charged monthly · Cancel anytime
- All Agriculture & Banking Courses
- AI Lesson Questions (100/day)
- AI Doubt Solver (50/day)
- Glows & Grows Feedback (30/day)
- AI Section Quiz (20/day)
- 22-Language Translation (100/day)
- Recall Questions (20/day)
- AI Quiz (15/day)
- AI Quiz Paper Analysis (100/day)
- AI Step-by-Step Explanations (100/day)
- Spaced Repetition Recall (FSRS)
- AI Tutor
- Immersive Text Questions
- Audio Lessons — Hindi & English
- Mock Tests & Previous Year Papers
- Summary & Mind Maps
- XP, Levels, Leaderboard & Badges
- Generate New Classrooms
- Voice AI Teacher (AgriDots Live)
- AI Revision Assistant
- Knowledge Gap Analysis
- Interactive Revision (LangGraph)
🔒 Secure via Razorpay · Cancel anytime · No hidden fees
What is a Project?
Imagine a farmer in Rajasthan wants to build a drip irrigation system for 50 hectares. This is not a routine daily activity like watering crops — it has a clear start date, an end date, a fixed budget, and a measurable goal (irrigating 50 ha). This is a project.
A project is a specific, one-time activity with:
- A defined starting point and ending point
- A specific objective to accomplish
- Measurable costs and returns (what distinguishes it from vague development efforts)
- A geographic location or area of concentration
- A target group it intends to benefit
- A time sequence of investment and production activities
Example: A watershed development project in Andhra Pradesh targets farmers in a specific micro-watershed. It follows phased activities — survey, soil treatment, check dam construction, plantation, and finally maintenance.
Characteristics of Agricultural Projects
| Characteristic | Explanation | Example |
|---|---|---|
| Composite nature | Made up of many sub-projects/investments | Sericulture project includes mulberry plantation, silkworm rearing sheds, and reeling units |
| Capital intensive | Raises capital-to-labour ratio significantly | Cold storage facility, micro-irrigation system, food processing plant |
| Variable investment costs | Costs differ by terrain, soil, market proximity, labour rates | A tube well in alluvial plains of Punjab costs far less than one in rocky terrain of Jharkhand |
| Incremental benefits | Additional income generated over and above the "without project" scenario | A drip irrigation project increases yield by 40% — the extra income is the incremental benefit |
| Fluctuating returns | Benefits vary year to year due to weather | A good monsoon year gives higher returns; drought year reduces them sharply |
TIP
Exam Tip: "Incremental benefit" means the difference between income WITH the project and income WITHOUT the project — not the total income.
Types of Agricultural Projects
| Type | What It Covers | Examples |
|---|---|---|
| Water Resource Development | Irrigation, groundwater, land reclamation, drainage, flood control | Canal irrigation project, check dam construction, salinity prevention in coastal areas |
| Agricultural Credit | On-lending projects — funds flow from development agency to bank to farmer | NABARD refinance for farm mechanisation, KCC-linked investment credit |
| Agricultural Development | Holistic improvement of farm economy — extension, inputs, infrastructure | Integrated Watershed Management Programme (IWMP), ATMA projects |
| Agro-industry & Commercial | Processing, storage, marketing, fisheries, input supply | Mega Food Park, cold chain project, FPO-run grain storage facility |
NOTE
On-lending projects work like this: World Bank lends to NABARD, NABARD lends to commercial banks, banks lend to farmers. Each level "on-lends" to the next.
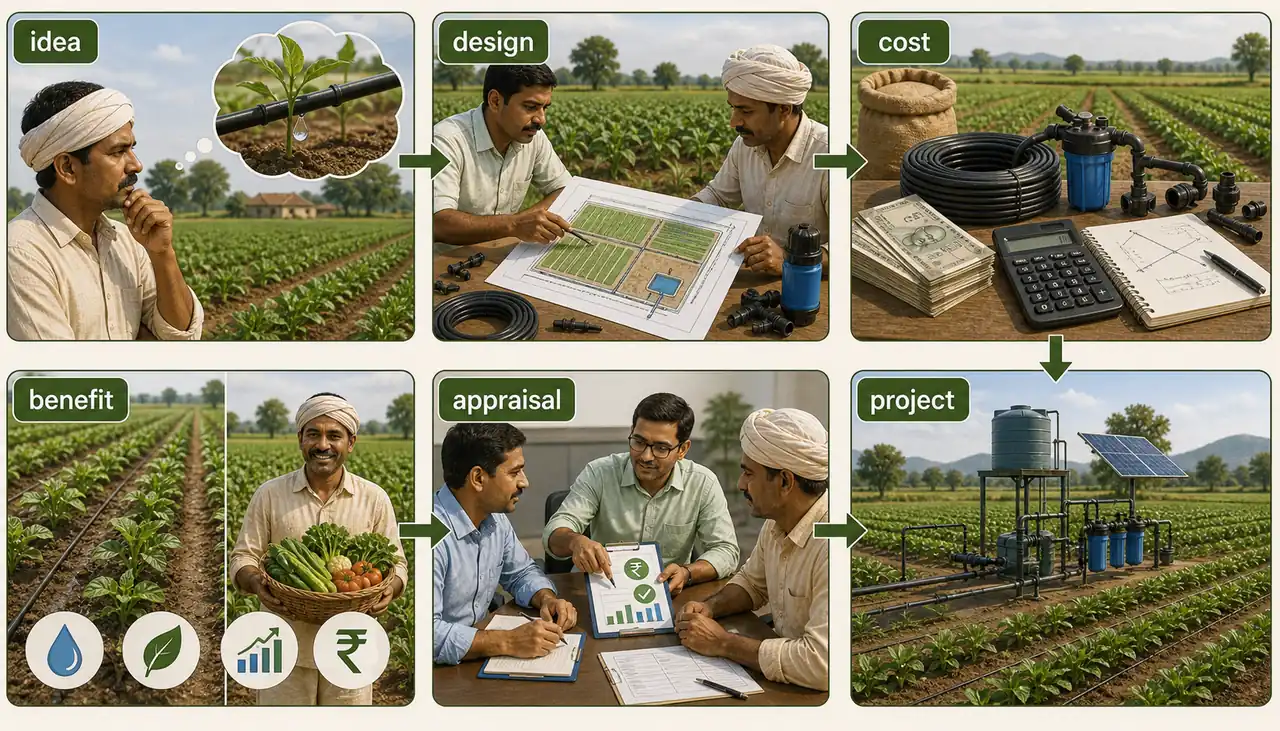
Project Cycle
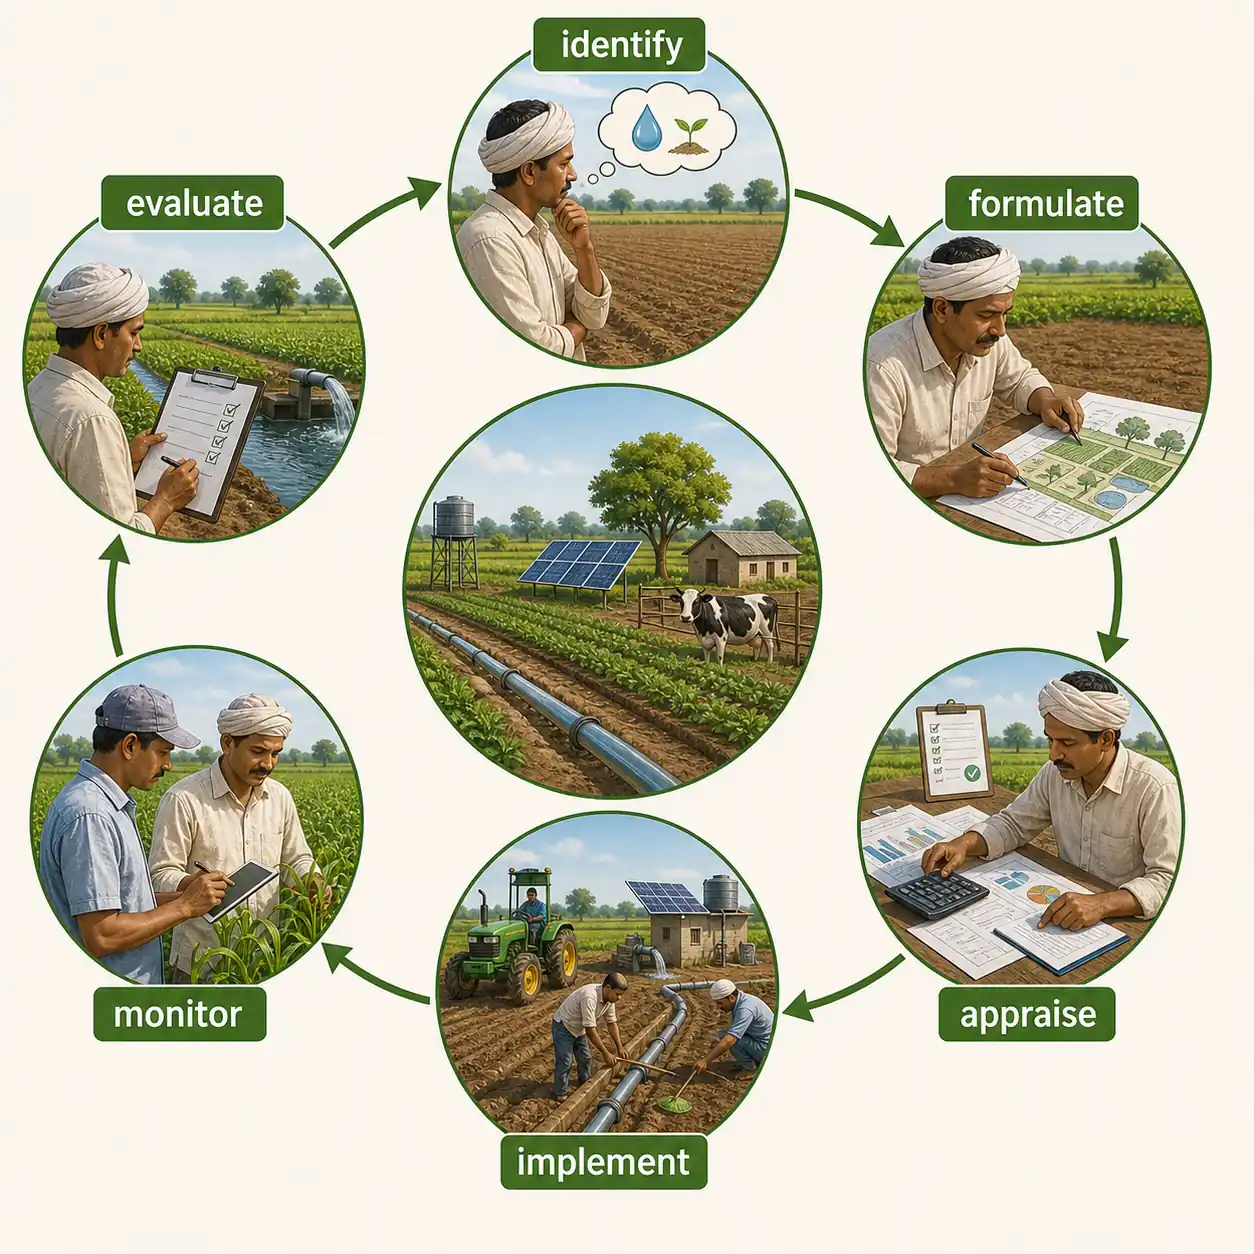
The project cycle is the natural sequence of phases every project follows. Each phase builds on the previous one — skipping any phase risks project failure.
| Phase | What Happens | Agricultural Example |
|---|---|---|
| 1. Identification | Potential ideas generated based on needs and resources | District agriculture officer identifies need for cold storage in mango belt |
| 2. Formulation | Idea developed into detailed proposal with specs, costs, benefits | Detailed Project Report (DPR) prepared — capacity, location, cost estimates |
| 3. Appraisal | Critical examination for technical feasibility, financial viability | NABARD appraises the DPR using NPW, BCR, IRR analysis |
| 4. Implementation | Actual execution — construction, procurement, deployment | Cold storage facility constructed and commissioned |
| 5. Monitoring | Continuous tracking against targets; corrective action if needed | Monthly progress reports, checking if utilisation matches projections |
| 6. Evaluation | Post-completion assessment — did it achieve objectives? Lessons learned | After 3 years, evaluate impact on mango wastage reduction and farmer income |
TIP
Mnemonic — "I Found A Impressive Mango Estate": Identification, Formulation, Appraisal, Implementation, Monitoring, Evaluation.
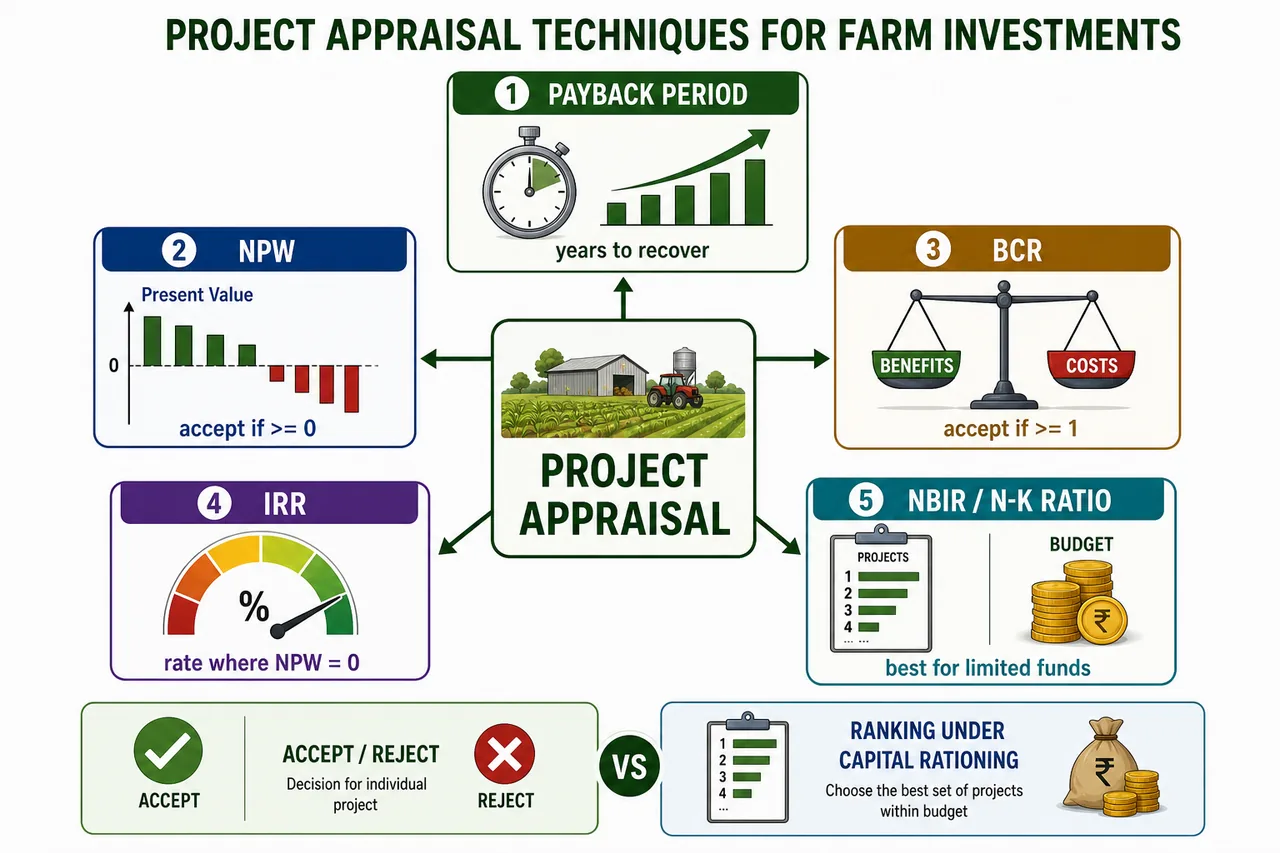
Project Appraisal Techniques
Project appraisal determines which projects to accept and which to reject. No single technique is perfect — using multiple techniques together gives the best picture.
| Category | Techniques | Key Feature |
|---|---|---|
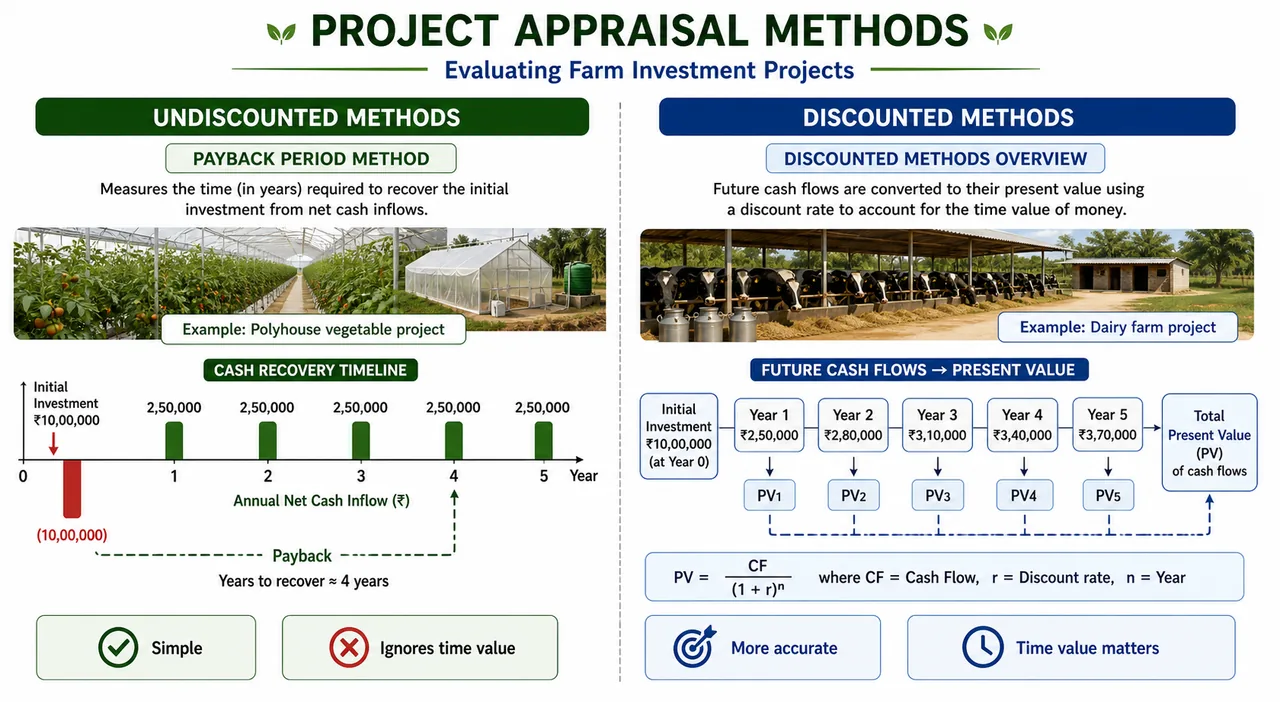
| Undiscounted (do NOT account for time value of money) | Payback Period, Value-Added, Capital Output Ratio, Proceeds per unit of outlay, Average annual proceeds | Simpler but less accurate |
| Discounted (account for time value of money) | NPW, BCR, IRR, N/K Ratio, Sensitivity Analysis | More accurate; preferred for major projects |
IMPORTANT
The key difference: Discounted techniques recognise that Rs 1 today is worth more than Rs 1 received five years later (because today's rupee can be invested and earn interest). Undiscounted techniques ignore this.
Undiscounted Measure: Payback Period
The payback period answers one simple question: "How many years to recover my investment?"
- P = Payback period (years)
- I = Total investment (Rs)
- E = Annual net cash revenue (Rs)
Rule: Shorter payback period = more attractive project.
Example: A farmer invests Rs 5,00,000 in a polyhouse. Annual net income = Rs 1,25,000. Payback period = 5,00,000 / 1,25,000 = 4 years.
Limitations of Payback Period
| Limitation | Why It Matters |
|---|---|
| Ignores earnings after payback | A mango orchard has a 7-year payback but earns for 40+ years — payback misses this long-term value |
| Ignores timing of proceeds | Rs 1 lakh received in Year 1 is treated the same as Rs 1 lakh in Year 5 |
Despite these weaknesses, payback period remains popular because it is simple and indicates risk — shorter payback = lower risk.
Discounted Techniques
Discounting converts future costs and benefits into their present worth using a discount rate (typically the opportunity cost of capital).
Think of it this way: If a bank offers 8% interest, then Rs 1,00,000 received one year from now is worth only Rs 92,593 today (because Rs 92,593 invested at 8% would grow to Rs 1,00,000 in one year).
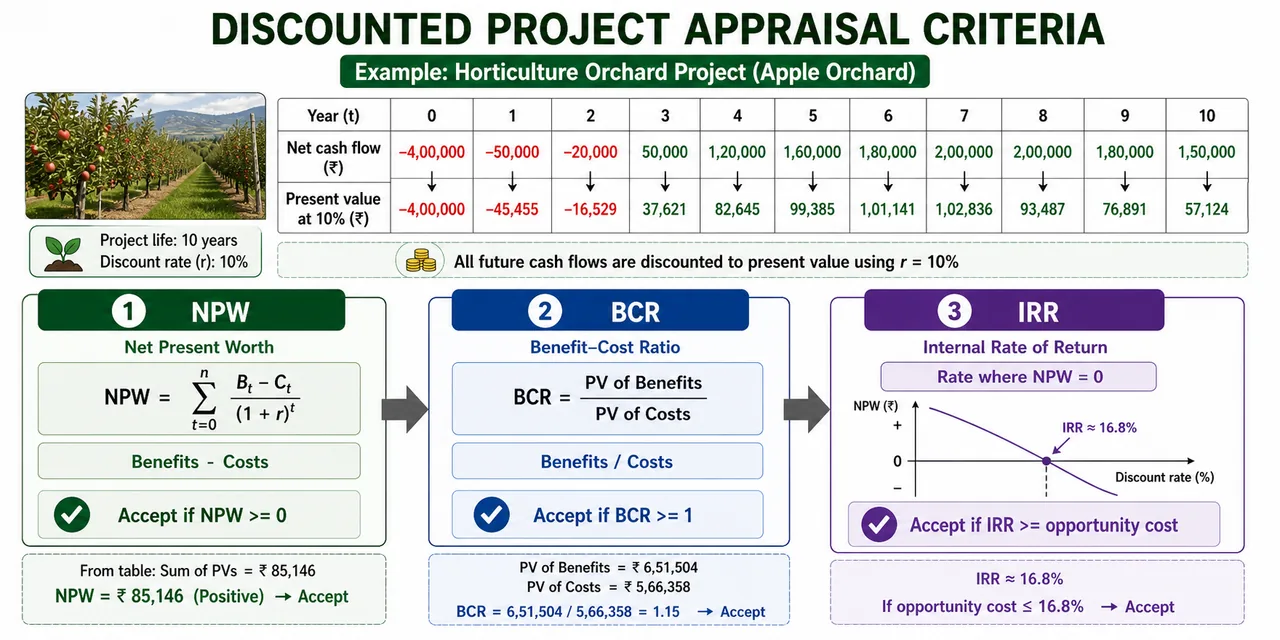
Net Present Worth (NPW)
NPW is the difference between the present worth of all benefits and the present worth of all costs over the project's lifetime.
- bt = Benefits received in year t
- ct = Costs incurred in year t
- 1/(1+r)t = Discount factor at interest rate r
- T = Project lifetime; K = Initial capital outlay
Decision Rule: Accept all independent projects with NPW >= 0 (at opportunity cost of capital).
| Strength | Limitation |
|---|---|
| Accounts for time value of money | Absolute measure — cannot rank projects of different sizes |
| Clear accept/reject criterion | A large mediocre project may have higher NPW than a small excellent project |
Example: Estimation of NPW for Two Projects (Hypothetical)
Sericulture (one ha)
| Year | Costs (in Rs) | Returns (in Rs) | Net income (in Rs) | Discount factor at 12% | NPW (in Rs) |
|---|---|---|---|---|---|
| 1 | 38900 | - | -38900 | 0.8929 | -34733.81 |
| 2 | 9239 | 28475 | 19236 | 0.7972 | 15334.94 |
| 3 | 10575 | 32550 | 21975 | 0.7118 | 15641.81 |
| 4 | 11952 | 35610 | 23658 | 0.6355 | 15034.66 |
| 5 | 12858 | 39802 | 26944 | 0.5674 | 15288.03 |
| NPW | 26565.63 |
Mango orchard (one ha)
| At the end of Year | Costs (in Rs) | Returns (in Rs) | Net income (in Rs) | Discount factor at 12% | NPW (in Rs) |
|---|---|---|---|---|---|
| 6th year | 25000 | - | -25000 | 0.507 | -12675 |
| 7th year | 4250 | 10260 | 6010 | 0.452 | 2716.52 |
| 8th year | 4792 | 12550 | 7758 | 0.404 | 3134.23 |
| 9th year | 5368 | 14530 | 9162 | 0.361 | 3307.48 |
| 10th year | 5975 | 16275 | 10300 | 0.322 | 3316.60 |
| 11th year | 6456 | 19396 | 12940 | 0.287 | 3713.78 |
| 12th year | 7187 | 21470 | 14283 | 0.257 | 3670.73 |
| NPW | 7184.34 |
IMPORTANT
Do NOT compare NPW of two projects to rank them. NPW is an absolute measure — it tells you whether to accept or reject, not which project is better. If both have positive NPW, accept both (if funds allow).
Benefit-Cost Ratio (BCR)
BCR is the present worth of benefits divided by the present worth of costs. Unlike NPW, it provides a relative measure — useful for comparing projects.
Decision Rule: Accept all independent projects with BCR >= 1.
| BCR Value | Meaning |
|---|---|
| BCR > 1 | Benefits exceed costs — project is worthwhile |
| BCR = 1 | Benefits exactly equal costs — breakeven |
| BCR < 1 | Costs exceed benefits — reject the project |
Limitation: BCR discriminates against projects with high gross returns AND high operating costs. A dairy project with Rs 50 lakh benefits and Rs 40 lakh costs (BCR = 1.25) may create more wealth than a beekeeping project with Rs 5 lakh benefits and Rs 3 lakh costs (BCR = 1.67), but BCR ranks beekeeping higher.
Example: Estimation of BCR for Two Projects (Hypothetical)
Sericulture (one ha)
| Year | Costs (in Rs) | Gross Returns (in Rs) | Discount factor at 12% | Present worth of costs (in Rs) | Present worth of gross returns (in Rs) |
|---|---|---|---|---|---|
| 1 | 38900 | - | 0.8929 | 34733.81 | - |
| 2 | 9239 | 28475 | 0.7972 | 7365.33 | 22700.27 |
| 3 | 10575 | 32550 | 0.7118 | 7527.29 | 23169.09 |
| 4 | 11952 | 35610 | 0.6355 | 7595.50 | 22630.16 |
| 5 | 12858 | 39802 | 0.5674 | 7295.63 | 22583.65 |
| 64517.56 | 91083.17 |
Benefit-cost ratio = 91083.18 / 64517.56 = 1.41
Mango orchard (one ha)
| Year | Costs (in Rs) | Returns (in Rs) | Discount factor at 12% | Present worth of costs (in Rs) | Present worth of gross returns (in Rs) |
|---|---|---|---|---|---|
| 6th year | 25000 | - | 0.507 | 12675.00 | - |
| 7th year | 4250 | 10260 | 0.452 | 1921.00 | 4637.52 |
| 8th year | 4792 | 12550 | 0.404 | 1935.97 | 5070.20 |
| 9th year | 5368 | 14530 | 0.361 | 1937.85 | 5245.33 |
| 10th year | 5975 | 16275 | 0.322 | 1923.95 | 5240.55 |
| 11th year | 6456 | 19396 | 0.287 | 1852.87 | 5566.55 |
| 12th year | 7187 | 21470 | 0.257 | 1847.06 | 5517.79 |
| 24093.70 | 31278.04 |
Benefit-cost ratio = 31278.04 / 24093.70 = 1.30
Internal Rate of Return (IRR)
IRR is the discount rate at which NPW becomes exactly zero. It represents the maximum interest rate a project can afford to pay and still break even.
- LDR = Lower Discount Rate (where NPW is positive)
- UDR = Upper Discount Rate (where NPW is negative)
- Interpolation interval should not exceed 5% for accuracy
Decision Rule: Accept all independent projects with IRR >= opportunity cost of capital.
Example: A sericulture project has IRR = 22%. If the bank lending rate is 12%, the project is viable because 22% > 12%.
TIP
IRR is considered the single best measure of project worth because it gives a rate of return that can be directly compared with the cost of borrowing. Remember: IRR = the discount rate that makes NPW = 0.
Example: Estimation of IRR for Sericulture (1 ha) (Hypothetical)
| Year | Costs (in Rs) | Gross income (in Rs) | Net income (in Rs) | Discount factor (40%) | Net present worth (in Rs) | Discount factor (43%) | Net present worth (in Rs) |
|---|---|---|---|---|---|---|---|
| 1 | 38900 | - | -38900 | 0.7143 | -27786.27 | 0.6993 | -27202.77 |
| 2 | 9239 | 28475 | 19236 | 0.5102 | 9814.21 | 0.4890 | 9406.4 |
| 3 | 10575 | 32550 | 21975 | 0.3644 | 8007.69 | 0.3419 | 7513.25 |
| 4 | 11952 | 35610 | 23658 | 0.2603 | 6158.17 | 0.2391 | 5656.62 |
| 5 | 12858 | 39802 | 26944 | 0.1859 | 5008.89 | 0.1672 | 4505.04 |
| 52913 | 1202.69 | -121.46 |
IRR = 40 + 3 × [1202.69 / (1202.69 + 121.46)] = 40 + 3(0.9083) = 40 + 2.7249 = 42.7249% = 42.7%
Net Benefit-Investment Ratio (NBIR / N/K Ratio)
NBIR = Present worth of net benefits (after they turn positive) divided by Present worth of investment (negative net benefits in early years).
Decision Rule: Accept projects with NBIR >= 1. When funds are limited, rank projects by NBIR from highest to lowest and fund them in that order until budget is exhausted.
| Feature | Why NBIR Is Special |
|---|---|
| Can rank projects | Unlike NPW, BCR, and IRR which are primarily accept/reject tools |
| Useful under capital rationing | When budget is limited and not all good projects can be funded |
| Works with incomplete information | Does not require knowledge of all available projects |
TIP
Exam Tip: NBIR is the only measure among NPW, BCR, IRR, and NBIR that can be used with confidence to rank projects directly. This is a frequently tested point.
Sensitivity Analysis
Sensitivity analysis tests "what if things go wrong?" — it checks how robust a project is under adverse conditions.
Common assumptions tested:
| Adverse Scenario | What Is Changed |
|---|---|
| Cost overrun | Costs increased by 10-25% |
| Revenue shortfall | Benefits reduced by 10-20% |
| Delayed benefits | Benefits start 2-3 years later than planned |
| Combined scenario | Cost overrun + revenue shortfall together |
Process: Redraw cost-benefit streams with adverse assumptions, recalculate NPW, BCR, and IRR.
Example: A dairy project shows IRR = 18% under normal assumptions. With 20% cost overrun and 10% revenue reduction, IRR drops to 11%. Since bank lending rate is 10%, the project is still viable — it is robust. But if IRR dropped to 8%, the project would be risky.
IMPORTANT
Sensitivity analysis is essential for projects with high financial stakes. A project that remains viable even after adverse assumptions is called a robust project.
Summary Cheat Sheet
| Concept / Topic | Key Details / Explanation |
|---|---|
| Project | One-time activity with defined start/end, specific objective, measurable costs/returns, target group |
| Incremental Benefit | Additional income with project minus income without project (not total income) |
| Project Types | Water resource, Agricultural credit (on-lending), Agricultural development, Agro-industry/commercial |
| On-lending | Funds flow: World Bank to NABARD to commercial banks to farmers |
| Project Cycle (6 phases) | Identification, Formulation, Appraisal, Implementation, Monitoring, Evaluation |
| Cycle Mnemonic | "I Found A Impressive Mango Estate" — IFAIME |
| Undiscounted Techniques | Payback Period, Value-Added, Capital Output Ratio — simpler but ignore time value of money |
| Discounted Techniques | NPW, BCR, IRR, NBIR — account for time value of money; preferred for major projects |
| Payback Period | P = I / E (Investment / Annual net revenue); shorter = better; ignores post-payback earnings |
| NPW (Net Present Worth) | PV of benefits minus PV of costs; accept if NPW >= 0; absolute measure (cannot rank projects) |
| BCR (Benefit-Cost Ratio) | PV of benefits / PV of costs; accept if BCR >= 1; relative measure; discriminates against high-turnover projects |
| IRR (Internal Rate of Return) | Discount rate where NPW = 0; accept if IRR >= opportunity cost of capital; single best measure of project worth |
| IRR Interpolation | Use lower and upper discount rates (interval <= 5%); interpolate to find rate where NPW = 0 |
| NBIR (N/K Ratio) | PV of net benefits / PV of investment; accept if NBIR >= 1; only measure that can directly rank projects |
| Capital Rationing | When budget is limited, rank by NBIR from highest to lowest and fund in order |
| Sensitivity Analysis | Tests robustness under adverse conditions: cost overrun (10-25%), revenue shortfall (10-20%), delayed benefits |
| Robust Project | Remains viable even after adverse assumptions in sensitivity analysis |
| Mnemonic for Discounted | "Never Buy Inferior Nuts" — NPW, BCR, IRR, N/K Ratio |