🧑🏼🔬 Z-Test (Large Sample Tests)
One-sample and two-sample Z-tests — when σ is known and unknown, with paddy field examples and critical values
A researcher measures panicle length in 60 paddy plants from one field and 70 from another. With large samples and a known common standard deviation, she needs the Z-test to determine whether the two fields differ significantly. The Z-test is the workhorse of large sample inference.
Standard Normal Deviate Tests or Large Sample Tests
- If the sample size n > 30 then it is considered as large sample and if the sample size n < 30 then it is considered as small sample. This distinction is crucial because different statistical tests apply depending on the sample size.
SND Test or One Sample (Z-test)
- Given by R.A. Fisher.
The Z-test is used when the sample size is large and we want to test whether a sample mean significantly differs from a known or hypothesized population mean. It relies on the standard normal distribution.
Case-I: Population standard deviation (σ) is known Assumptions:
Assumptions:
Pro Content Locked
Upgrade to Pro to access this lesson and all other premium content.
₹99 charged monthly · Cancel anytime
- All Agriculture & Banking Courses
- AI Lesson Questions (100/day)
- AI Doubt Solver (50/day)
- Glows & Grows Feedback (30/day)
- AI Section Quiz (20/day)
- 22-Language Translation (100/day)
- Recall Questions (20/day)
- AI Quiz (15/day)
- AI Quiz Paper Analysis (100/day)
- AI Step-by-Step Explanations (100/day)
- Spaced Repetition Recall (FSRS)
- AI Tutor
- Immersive Text Questions
- Audio Lessons — Hindi & English
- Mock Tests & Previous Year Papers
- Summary & Mind Maps
- XP, Levels, Leaderboard & Badges
- Generate New Classrooms
- Voice AI Teacher (AgriDots Live)
- AI Revision Assistant
- Knowledge Gap Analysis
- Interactive Revision (LangGraph)
🔒 Secure via Razorpay · Cancel anytime · No hidden fees
A researcher measures panicle length in 60 paddy plants from one field and 70 from another. With large samples and a known common standard deviation, she needs the Z-test to determine whether the two fields differ significantly. The Z-test is the workhorse of large sample inference.
Standard Normal Deviate Tests or Large Sample Tests
- If the sample size n > 30 then it is considered as large sample and if the sample size n < 30 then it is considered as small sample. This distinction is crucial because different statistical tests apply depending on the sample size.
SND Test or One Sample (Z-test)
- Given by R.A. Fisher.
The Z-test is used when the sample size is large and we want to test whether a sample mean significantly differs from a known or hypothesized population mean. It relies on the standard normal distribution.
Case-I: Population standard deviation (σ) is known Assumptions:
Assumptions:
- Population is normally distributed
- The sample is drawn at random
Conditions:
- Population standard deviation σ is known
- Size of the sample is large (say n > 30)
Procedure:
- Let x1, x2, ……… xn be a random sample size of n from a normal population with mean μ and variance σ2.
- Let x be the sample mean of sample of size "n"
- Null hypothesis (H0): population mean (µ) is equal to a specified value μ0
- i.e. H0 : µ = µ0
- Under H0, the test statistic is
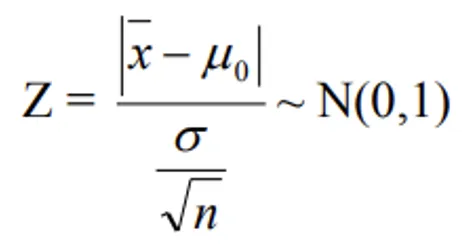
- i.e. the above statistic follows Normal Distribution with mean "0" and variance "1". If the calculated value of Z < table value of Z at 5% level of significance, H0 is accepted and hence we conclude that there is no significant difference between the population mean and the one specified in H0 as µ0.
| Level of Significance | Two-tailed test | One-tailed test |
|---|---|---|
| 10% (0.10) | 1.645 | 1.28 |
| 5% (0.05) | 1.96 | 1.645 |
| 1% (0.01) | 2.576 | 2.326 |
Case-II: If σ is not known
When the population standard deviation is unknown but the sample size is large, we substitute the sample standard deviation (s) in place of σ. For large samples, this substitution is valid because s is a reliable estimate of σ.
Assumptions:
- Population is normally distributed
- Sample is drawn from the population should be random
- We should know the population mean
Conditions:
- Population standard deviation σ is not known
- Size of the sample is large (say n > 30)
- Null hypothesis (H0): µ = µ0 under H0, the test statistic
- If the calculated value of Z < table value of Z at 5% level of significance, H0 is accepted and hence we conclude that there is no significant difference between the population mean and the one specified in H0 otherwise we do not accept H0.
- The table value of Z at 5% level of significance = 1.96 and table value of Z at 1% level of significance = 2.58.
IMPORTANT
Memorize these critical Z-values: 5% LOS = 1.96 and 1% LOS = 2.58. These are used in all large-sample Z-tests.
Two sample Z-Test or Test of significant for difference of means
This test is used when we want to compare the means of two independent populations using large samples. It answers the question: "Do the two population means differ significantly?"
Case-I: When σ is known
Assumptions:
- Populations are distributed normally
- Samples are drawn independently and at random
Conditions:
- Populations standard deviation σ is known
- Size of samples are large
Procedure:
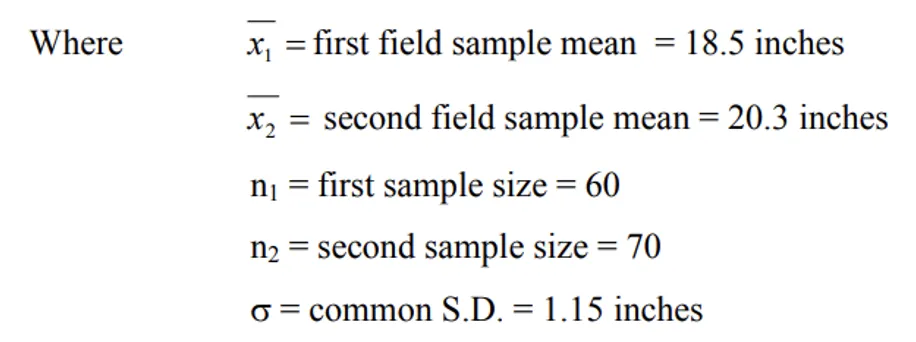
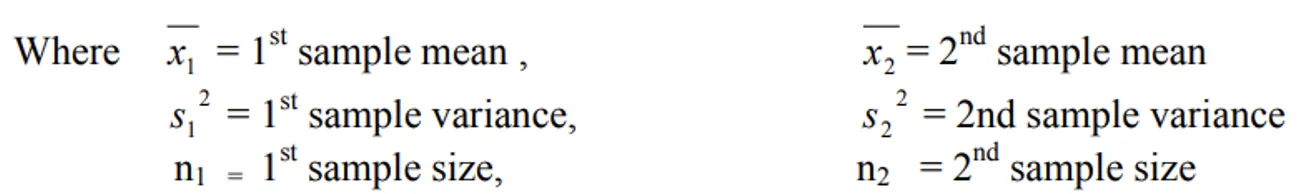
- Let x1 be the mean of a random sample of size n1 from a population with mean µ1 and variance σ22
- Let x2 be the mean of a random sample of size n2 from another population with mean µ2 and variance σ22
- Null hypothesis H0: σ1 = σ2
- Alternative Hypothesis H1: σ1 ≠ σ2
- i.e. The null hypothesis states that the population means of the two samples are identical. Under the null hypothesis the test statistic becomes
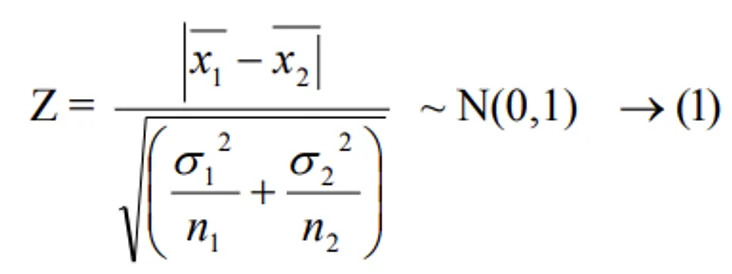
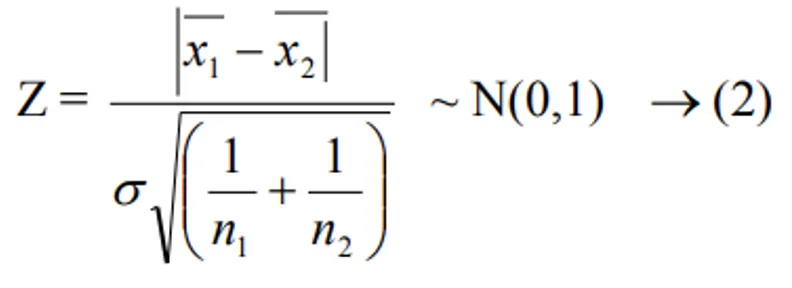
- i.e. the above statistic follows Normal Distribution with mean "0" and variance "1". If σ12 = σ22 = σ2 (say) i.e. both samples have the same standard deviation then the test statistic becomes
- If the calculated value of |Z| < table value of Z at 5% level of significance, H0 is accepted.
- Otherwise rejected. If H0 is accepted means, there is no significant difference between two population means of the two samples are identical.
Example: The Average panicle length of 60 paddy plants in field No. 1 is 18.5 cms and that of 70 paddy plants in field No. 2 is 20.3 cms. With common S.D. 1.15 cms. Test whether there is significant difference between two paddy fields w.r.t panicle length.
Solution:
- Null hypothesis: H0: There is no significant difference between the means of two paddy fields w.r.t. panicle length.
- H0: μ1 = μ2
- Under H0, the test statistic becomes
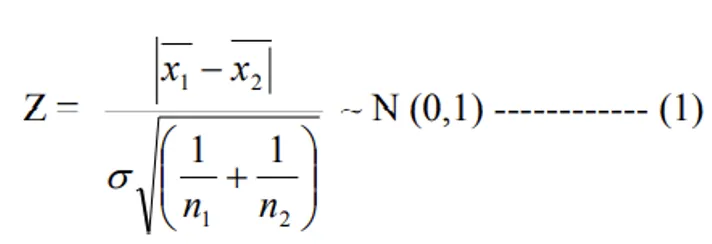
- Substitute the given values in equation (1), we get
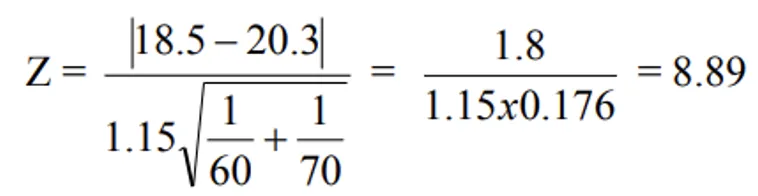
- Calculated value of Z = 8.89
- Calculated Value of Z > table value of Z at 5% LOS (1.96), H0 is rejected. This means, there is highly significant difference between two paddy fields w.r.t. panicle length.
Since the calculated Z value (8.89) is far greater than the critical value (1.96), we can conclude with high confidence that the difference in panicle length between the two fields is real and not due to chance.
Case-II: When σ is not known
Assumptions:
- Populations are normally distributed
- Samples are drawn independently and at random
Conditions:
- Population standard deviation σ is not known
- Size of samples are large
When σ is not known, we use the sample variances (s12 and s22) to estimate the population variances. This is acceptable for large samples.
Null hypothesis H0: μ1 = μ2
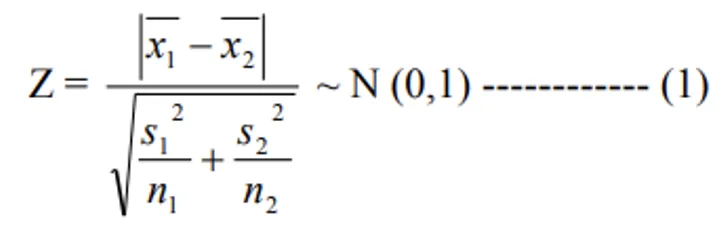
- Under the null hypothesis the test statistic becomes
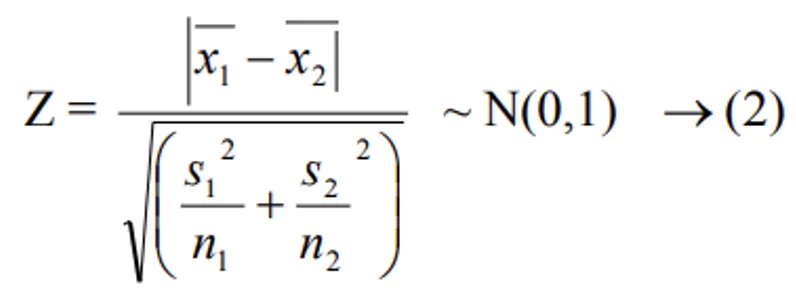
- If the calculated value of |Z| < table value of Z at 5% level of significance, H0 is accepted otherwise rejected.
Example
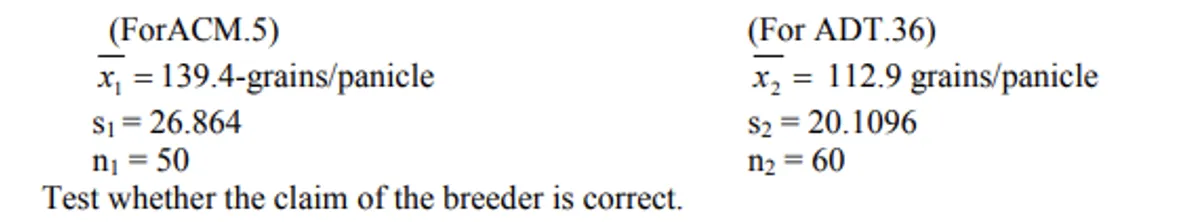
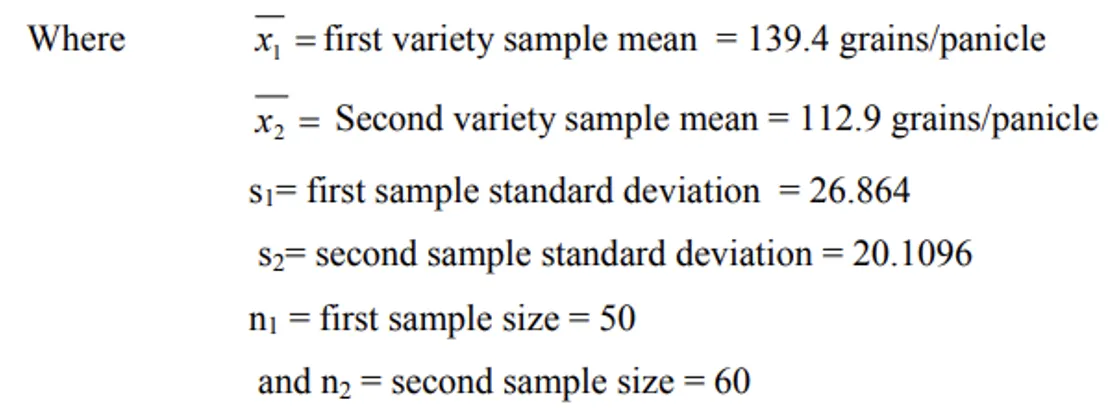
- A breeder claims that the number of filled grains per panicle is more in a new variety of paddy ACM.5 compared to that of an old variety ADT.36. To verify his claim a random sample of 50 plants of ACM.5 and 60 plants of ADT.36 were selected from the experimental fields.
- The following results were obtained:
Sol:
- Null hypothesis H0: μ1 = μ2 (i.e. the average number of filled grains per panicle is the same for both ACM.5 and ADT.36)
- Under H0, the test statistic becomes
- Substitute the given values in equation (1), we get
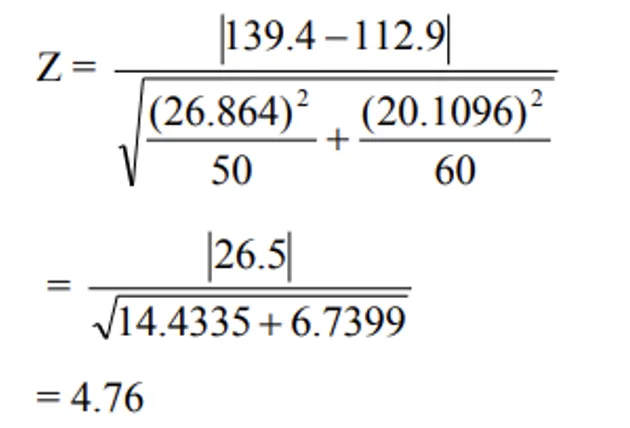
- Calculated value of Z > Table value of Z at 5% LOS (1.96), H0 is rejected. We conclude that the number of filled grains per panicle is significantly greater in ACM.5 than in ADT.36
This result supports the breeder's claim — the new variety ACM.5 does produce significantly more filled grains per panicle compared to the old variety ADT.36.
Summary Table
| Concept | Key Point | Exam Tip |
|---|---|---|
| Given by | R.A. Fisher | Standard Normal Deviate test |
| Large sample | n > 30 | Small sample (n < 30) → use t-test |
| Z at 5% LOS | 1.96 | Memorise this |
| Z at 1% LOS | 2.58 | Memorise this |
| σ known | Use σ directly in formula | More precise |
| σ unknown | Substitute sample S.D. (s) | Valid for large n |
| One-sample | Compare sample mean to population mean | H0: μ = μ0 |
| Two-sample | Compare means of two populations | H0: μ1 = μ2 |
TIP
Critical Z-values to memorise: 5% LOS = 1.96 (approximately 2), 1% LOS = 2.58 (approximately 2.6). These never change regardless of sample size.
Summary Cheat Sheet
| Concept / Topic | Key Details |
|---|---|
| Z-test given by | R.A. Fisher — Standard Normal Deviate test |
| Large sample | n > 30; small sample = n < 30 |
| Z at 5% LOS | 1.96 |
| Z at 1% LOS | 2.58 |
| One-sample Z-test | Compare sample mean with population mean; H₀: μ = μ₀ |
| Two-sample Z-test | Compare means of two populations; H₀: μ₁ = μ₂ |
| σ known | Use σ directly in formula |
| σ unknown (large n) | Substitute sample S.D. (s) — valid for large samples |
| Z-statistic | Z = (x̄ - μ₀) / (σ/√n) for one-sample |
| Two-sample formula | Z = (x̄₁ - x̄₂) / √(σ₁²/n₁ + σ₂²/n₂) |
| Equal variances | Z = (x̄₁ - x̄₂) / (σ × √(1/n₁ + 1/n₂)) |
| Decision rule | |
| Normal distribution | Z follows N(0, 1) — mean 0, variance 1 |
| Assumptions | Population normally distributed, sample drawn randomly |
| When to use Z-test | n > 30, σ known or estimated from large sample |
| When NOT to use | n < 30 and σ unknown → use t-test instead |
| Significance | Reject H₀ → difference is real, not due to chance |
| Accept H₀ | Difference is due to sampling fluctuation |