🙅🏼♂️F-Test (Variance Ratio Test)
Testing equality of two population variances — assumptions, procedure, and worked example with irrigation data
Two irrigation systems are tested on red gram — but before comparing their mean yields, we must first check whether the variability in plant heights is similar under both systems. The F-test answers this question by comparing the variances of two populations, making it a critical prerequisite for many other statistical analyses.
- In agricultural experiments the performance of a treatment is assessed not only by its mean but also by its
variability. Hence, it is of interest to us to compare the variability of two populations. While the t-test compares means, the F-test compares variances — making it a complementary tool in agricultural research. - In testing of hypothesis, the equality of variances, the greater variance is always placed in the numerator and smaller variance is placed in the denominator. This convention ensures that the F-statistic is always greater than or equal to 1, simplifying the comparison with table values.
- F-test is used to test the equality of two population variances, equality of several regression coefficients, ANOVA. It is one of the most versatile statistical tests used across many areas of research.
- ‘F’ test can be used for testing the significance of several differences.
- F-test was discovered by G.W. Snedecor. The test is named “F” in honour of R.A. Fisher.
- The range of F is 0 to ∞. Since F is a ratio of two variances (both positive), it can never be negative.
TIP
Remember: F = larger variance / smaller variance (always ≥ 1). The F-test is used for comparing variances and is the basis of ANOVA.
Process
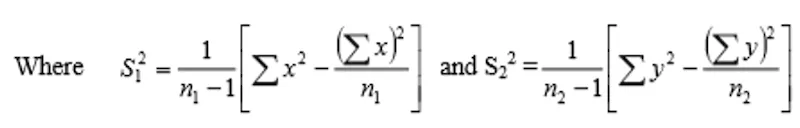
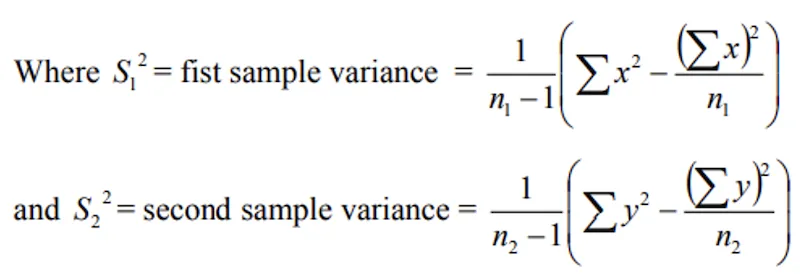
- Let x1, x2, …, xn1 and y1, y2,… , yn2 be the two independent random samples of sizes n1 and n1 drawn from two normal populations N(μ1, σ12) and N(μ2, σ22) respectively. S12 and S22 are the sample variances of the two samples.
- Null hypothesis H0: σ12 = σ22
The null hypothesis states that the two population variances are equal, i.e., the populations have the same degree of variability.
- Under H0, the test statistic becomes
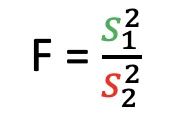
- Where, S12 > S22 (remember V shape) — the larger variance is always placed on top.
- Which follows F-distribution with (n1 - 1, n2- 1) d.f.
- If calculated value of F < table value of F with (n2-1, n1-1) d.f. at specified level of significance, then the null hypothesis is accepted and hence we conclude that the variances of the populations are homogeneous otherwise heterogeneous.
Homogeneous variances means the two populations have similar spread, while heterogeneous variances means they differ significantly in their variability.
Example
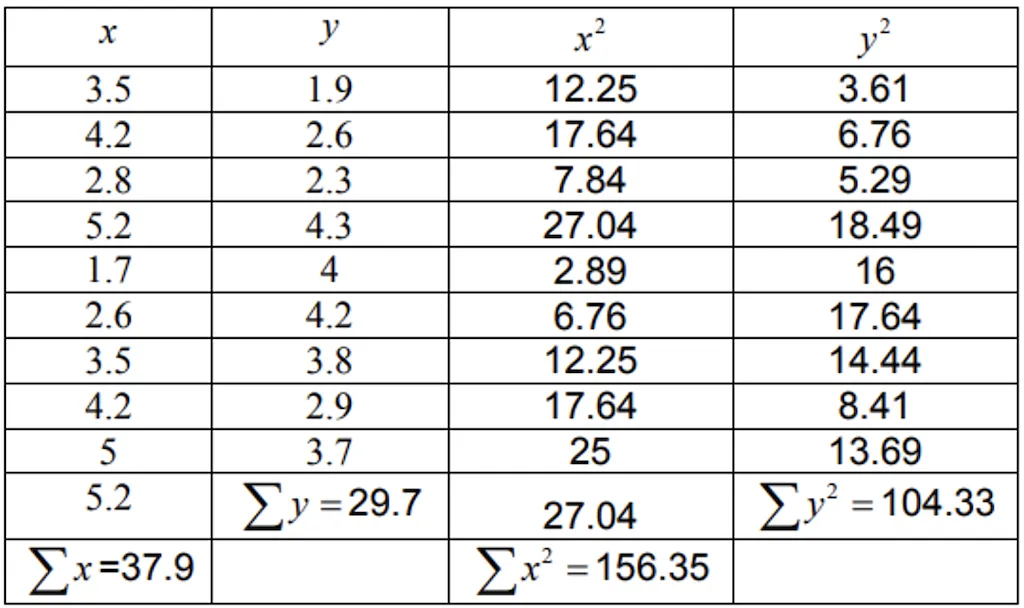
- The heights in meters of red gram plants with two types of irrigation in two fields are as follows:
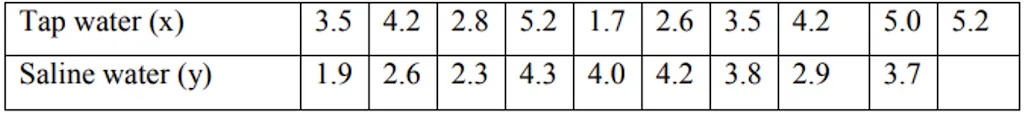
- Test whether the variances of the two system of irrigation are homogeneous.
Solution:
- H0: The variances of the two systems of irrigation are homogeneous.
- i.e. σ12 = σ22
- Under H0, the test statistic becomes
- Where, S12 > S22
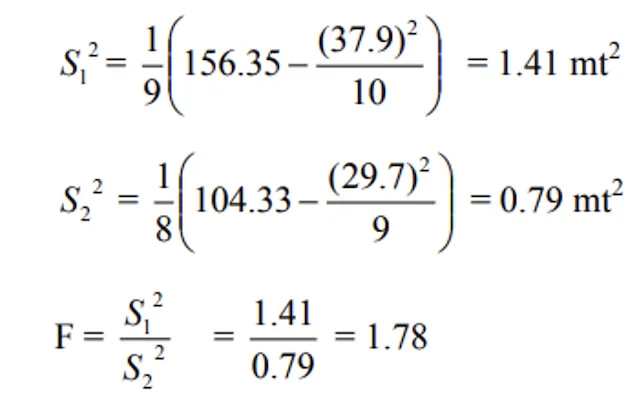
- F calculated value = 1.78
- Table value of F0.05 for (n1 - 1, n2 - 1) d.f. = 3.23
- Calculated value of F < Table value of at 5% level of significance, H0 is accepted and hence we conclude that the variances of the two systems of irrigation are homogeneous.
Since Fcalculated (1.78) is much less than Ftable (3.23), we have no evidence to suggest that the two irrigation systems produce different levels of variability in plant height. The two systems are equally consistent.
Summary Table
| Concept | Key Point | Exam Tip |
|---|---|---|
| Discoverer | G.W. Snedecor; named “F” for R.A. Fisher | |
| Purpose | Compare two variances | Also used in ANOVA |
| Formula | F = Larger variance / Smaller variance | Always ≥ 1 |
| Range | 0 to ∞ | Never negative |
| d.f. | (n1-1, n2-1) | Numerator d.f. first |
| Convention | Greater variance in numerator | Remember “V shape” |
| Homogeneous | Fcalc < Ftable → equal variances | Accept H0 |
| Heterogeneous | Fcalc > Ftable → unequal variances | Reject H0 |
| Uses | Equality of variances, regression coefficients, ANOVA | Most versatile test |
TIP
Test selection guide: Comparing means → t-test or Z-test. Comparing variances → F-test. Comparing more than two means → ANOVA (which uses F-test internally).
Summary Cheat Sheet
| Concept / Topic | Key Details |
|---|---|
| F-test discovered by | G.W. Snedecor; named “F” in honour of R.A. Fisher |
| Purpose | Compare two population variances |
| Formula | F = Larger variance / Smaller variance (always ≥ 1) |
| Range of F | 0 to ∞ (never negative — ratio of two positive values) |
| d.f. | (n₁ - 1, n₂ - 1) — numerator d.f. listed first |
| Convention | Greater variance always in numerator (“V shape”) |
| H₀ | σ₁² = σ₂² (two population variances are equal) |
| Homogeneous | F_calc < F_table → accept H₀ (equal variances) |
| Heterogeneous | F_calc > F_table → reject H₀ (unequal variances) |
| Uses of F-test | Equality of variances, regression coefficients, ANOVA |
| Multiple differences | F-test can test significance of several differences |
| Assumptions | Independent random samples from normal populations |
| Prerequisite for t-test | Check variance equality with F-test before two-sample t-test |
| ANOVA connection | ANOVA uses F-test internally to compare treatment means |
| Compared to t-test | t-test compares means; F-test compares variances |
| Agricultural example | Testing variance homogeneity of irrigation systems on red gram |
Pro Content Locked
Upgrade to Pro to access this lesson and all other premium content.
₹2388 billed yearly
- All Agriculture & Banking Courses
- AI Lesson Questions (100/day)
- AI Doubt Solver (50/day)
- Glows & Grows Feedback (30/day)
- AI Section Quiz (20/day)
- 22-Language Translation (30/day)
- Recall Questions (20/day)
- AI Quiz (15/day)
- AI Quiz Paper Analysis
- AI Step-by-Step Explanations
- Spaced Repetition Recall (FSRS)
- AI Tutor
- Immersive Text Questions
- Audio Lessons — Hindi & English
- Mock Tests & Previous Year Papers
- Summary & Mind Maps
- XP, Levels, Leaderboard & Badges
- Generate New Classrooms
- Voice AI Teacher (AgriDots Live)
- AI Revision Assistant
- Knowledge Gap Analysis
- Interactive Revision (LangGraph)
🔒 Secure via Razorpay · Cancel anytime · No hidden fees
Two irrigation systems are tested on red gram — but before comparing their mean yields, we must first check whether the variability in plant heights is similar under both systems. The F-test answers this question by comparing the variances of two populations, making it a critical prerequisite for many other statistical analyses.
- In agricultural experiments the performance of a treatment is assessed not only by its mean but also by its
variability. Hence, it is of interest to us to compare the variability of two populations. While the t-test compares means, the F-test compares variances — making it a complementary tool in agricultural research. - In testing of hypothesis, the equality of variances, the greater variance is always placed in the numerator and smaller variance is placed in the denominator. This convention ensures that the F-statistic is always greater than or equal to 1, simplifying the comparison with table values.
- F-test is used to test the equality of two population variances, equality of several regression coefficients, ANOVA. It is one of the most versatile statistical tests used across many areas of research.
- ‘F’ test can be used for testing the significance of several differences.
- F-test was discovered by G.W. Snedecor. The test is named “F” in honour of R.A. Fisher.
- The range of F is 0 to ∞. Since F is a ratio of two variances (both positive), it can never be negative.
TIP
Remember: F = larger variance / smaller variance (always ≥ 1). The F-test is used for comparing variances and is the basis of ANOVA.
Process
- Let x1, x2, …, xn1 and y1, y2,… , yn2 be the two independent random samples of sizes n1 and n1 drawn from two normal populations N(μ1, σ12) and N(μ2, σ22) respectively. S12 and S22 are the sample variances of the two samples.
- Null hypothesis H0: σ12 = σ22
The null hypothesis states that the two population variances are equal, i.e., the populations have the same degree of variability.
- Under H0, the test statistic becomes
- Where, S12 > S22 (remember V shape) — the larger variance is always placed on top.
- Which follows F-distribution with (n1 - 1, n2- 1) d.f.
- If calculated value of F < table value of F with (n2-1, n1-1) d.f. at specified level of significance, then the null hypothesis is accepted and hence we conclude that the variances of the populations are homogeneous otherwise heterogeneous.
Homogeneous variances means the two populations have similar spread, while heterogeneous variances means they differ significantly in their variability.
Example
- The heights in meters of red gram plants with two types of irrigation in two fields are as follows:
- Test whether the variances of the two system of irrigation are homogeneous.
Solution:
- H0: The variances of the two systems of irrigation are homogeneous.
- i.e. σ12 = σ22
- Under H0, the test statistic becomes
- Where, S12 > S22
- F calculated value = 1.78
- Table value of F0.05 for (n1 - 1, n2 - 1) d.f. = 3.23
- Calculated value of F < Table value of at 5% level of significance, H0 is accepted and hence we conclude that the variances of the two systems of irrigation are homogeneous.
Since Fcalculated (1.78) is much less than Ftable (3.23), we have no evidence to suggest that the two irrigation systems produce different levels of variability in plant height. The two systems are equally consistent.
Summary Table
| Concept | Key Point | Exam Tip |
|---|---|---|
| Discoverer | G.W. Snedecor; named “F” for R.A. Fisher | |
| Purpose | Compare two variances | Also used in ANOVA |
| Formula | F = Larger variance / Smaller variance | Always ≥ 1 |
| Range | 0 to ∞ | Never negative |
| d.f. | (n1-1, n2-1) | Numerator d.f. first |
| Convention | Greater variance in numerator | Remember “V shape” |
| Homogeneous | Fcalc < Ftable → equal variances | Accept H0 |
| Heterogeneous | Fcalc > Ftable → unequal variances | Reject H0 |
| Uses | Equality of variances, regression coefficients, ANOVA | Most versatile test |
TIP
Test selection guide: Comparing means → t-test or Z-test. Comparing variances → F-test. Comparing more than two means → ANOVA (which uses F-test internally).
Summary Cheat Sheet
| Concept / Topic | Key Details |
|---|---|
| F-test discovered by | G.W. Snedecor; named “F” in honour of R.A. Fisher |
| Purpose | Compare two population variances |
| Formula | F = Larger variance / Smaller variance (always ≥ 1) |
| Range of F | 0 to ∞ (never negative — ratio of two positive values) |
| d.f. | (n₁ - 1, n₂ - 1) — numerator d.f. listed first |
| Convention | Greater variance always in numerator (“V shape”) |
| H₀ | σ₁² = σ₂² (two population variances are equal) |
| Homogeneous | F_calc < F_table → accept H₀ (equal variances) |
| Heterogeneous | F_calc > F_table → reject H₀ (unequal variances) |
| Uses of F-test | Equality of variances, regression coefficients, ANOVA |
| Multiple differences | F-test can test significance of several differences |
| Assumptions | Independent random samples from normal populations |
| Prerequisite for t-test | Check variance equality with F-test before two-sample t-test |
| ANOVA connection | ANOVA uses F-test internally to compare treatment means |
| Compared to t-test | t-test compares means; F-test compares variances |
| Agricultural example | Testing variance homogeneity of irrigation systems on red gram |
Knowledge Check
Take a dynamically generated quiz based on the material you just read to test your understanding and get personalized feedback.
Lesson Doubts
Ask questions, get expert answers