👁 Analysis of Variance (ANOVA)
Comparing more than two treatment means — one-way and two-way classification, assumptions, F-test, and agricultural applications
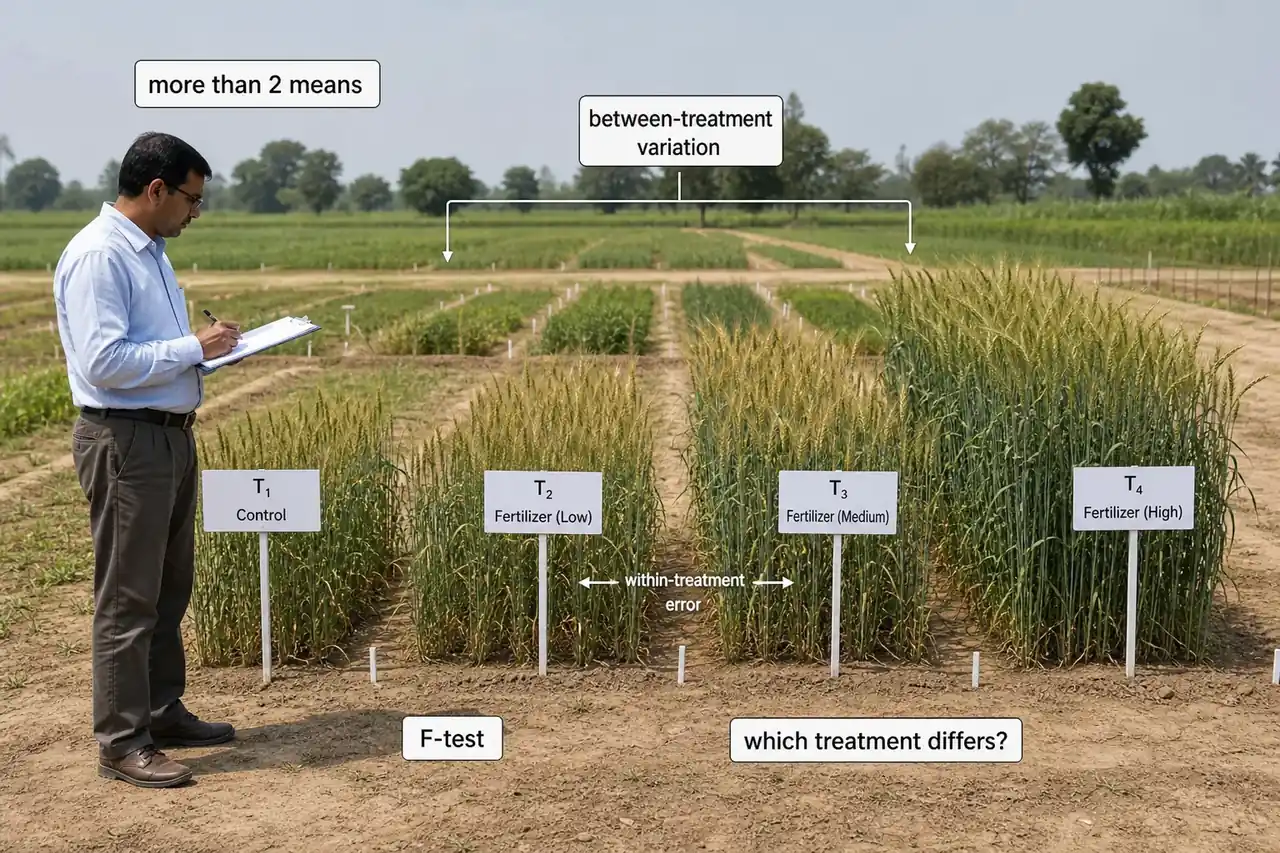
An agronomist wants to compare the efficacy of five different fertiliser formulations on wheat yield. Using a t-test for every pair would require 10 separate tests and inflate the risk of false conclusions. ANOVA solves this by testing all five groups simultaneously in a single, elegant procedure — it is the most widely used technique in agricultural field experimentation.
Quick Decision Rule
| Data Situation | Preferred Test |
|---|---|
| 2 means only | t-test |
| More than 2 means | ANOVA (F-test framework) |
| Compare variances only | F-test |
| Frequency fit/association | Chi-square |
- The ANOVA is a powerful statistical tool for tests of significance. ANOVA stands for Analysis of Variance and it is one of the most widely used techniques in agricultural and biological research for comparing treatment effects.
Simple idea:
ANOVA compares several means at the same time by comparing two kinds of variation:
Pro Content Locked
Upgrade to Pro to access this lesson and all other premium content.
Charged once for one year · ₹1188 total
Save ₹100/month vs ₹2388/year launch price
- All Agriculture & Banking Courses
- AI Lesson Questions (100/day)
- AI Doubt Solver (50/day)
- Glows & Grows Feedback (30/day)
- AI Section Quiz (20/day)
- 22-Language Translation (100/day)
- Recall Questions (20/day)
- AI Quiz (15/day)
- AI Quiz Paper Analysis (100/day)
- AI Step-by-Step Explanations (100/day)
- Spaced Repetition Recall (FSRS)
- AI Tutor
- Immersive Text Questions
- Audio Lessons — Hindi & English
- Mock Tests & Previous Year Papers
- Summary & Mind Maps
- XP, Levels, Leaderboard & Badges
- Generate New Classrooms
- Voice AI Teacher (AgriDots Live)
- AI Revision Assistant
- Knowledge Gap Analysis
- Interactive Revision (LangGraph)
🔒 Secure one-time yearly payment via Razorpay · No hidden fees
An agronomist wants to compare the efficacy of five different fertiliser formulations on wheat yield. Using a t-test for every pair would require 10 separate tests and inflate the risk of false conclusions. ANOVA solves this by testing all five groups simultaneously in a single, elegant procedure — it is the most widely used technique in agricultural field experimentation.
Quick Decision Rule
| Data Situation | Preferred Test |
|---|---|
| 2 means only | t-test |
| More than 2 means | ANOVA (F-test framework) |
| Compare variances only | F-test |
| Frequency fit/association | Chi-square |
- The ANOVA is a powerful statistical tool for tests of significance. ANOVA stands for Analysis of Variance and it is one of the most widely used techniques in agricultural and biological research for comparing treatment effects.
Simple idea:
ANOVA compares several means at the same time by comparing two kinds of variation:
- variation between treatments
- variation within treatments due to random error
If treatment variation is much larger than error variation, the treatments are considered significantly different.
-
The test of significance based on t-distribution is an adequate procedure only for testing the significance of the difference between two sample means. In a situation when we have more than two samples to consider at a time, an alternative procedure is needed for testing the hypothesis that all the samples have been drawn from the same population. The t-test is limited because if we tried to use it for comparing, say, five treatments by testing all possible pairs, we would need 10 separate t-tests, and the probability of making at least one false conclusion would increase sharply. ANOVA solves this problem by testing all groups simultaneously in a single test.
-
For example, if three fertilizers are to be compared to find their efficacy, this could be done by a field experiment, in which each fertilizer is applied to 10 plots and then the 30 plots are later harvested with the crop yield being calculated for each plot. Now we have 3 groups of ten figures and we wish to know if there are any differences between these groups. The answer to this problem is provided by the technique of ANOVA.
-
The term ANOVA was introduced by Prof. R.A. Fisher in the 1920s to deal with problems in the analysis of agronomical data. R.A. Fisher is widely regarded as the father of modern statistics, and his work at the Rothamsted Experimental Station in England laid the foundation for ANOVA and experimental design as used in agriculture today.

- It is statistical technique of partitioning the total variation into component variations and computing them by F-test. In simpler terms, ANOVA breaks down the total variability observed in the data into parts that can be attributed to specific causes (such as different treatments) and the remainder that is due to random error.
- Variation is inherent in nature. The total variation in any set of numerical data is due to a number of causes which is classified by ANOVA as
- Assignable causes -- these are the identifiable sources of variation, such as different fertilizer doses, varieties, or irrigation levels. These are the factors the researcher is deliberately studying.
- Chance causes (error) -- these represent the natural, uncontrollable random variation that always exists in experiments. This includes soil variability, weather fluctuations, measurement inaccuracies, and other unpredictable factors.
- The variation due to assignable causes can be detected and measured whereas the variation due to chance causes is beyond the control of humans and cannot be traced separately.
-
ANOVA: The ANOVA is a simple arithmetical process of sorting out the components of variation in a given data. Despite using variance (not means) as its primary tool, the ultimate goal of ANOVA is to determine whether the means of different groups are significantly different from one another.
-
Minimum degree of freedom for error in ANOVA is 12. This is a practical guideline -- having at least 12 error degrees of freedom ensures that the F-test has sufficient sensitivity to detect real treatment differences.
-
Types of ANOVA: There are two types:
- One-way classification -- used when the data is classified based on a single factor (e.g., comparing yields of different crop varieties).
- Two-way classification -- used when the data is classified based on two factors simultaneously (e.g., comparing yields across different varieties AND different fertilizer levels).
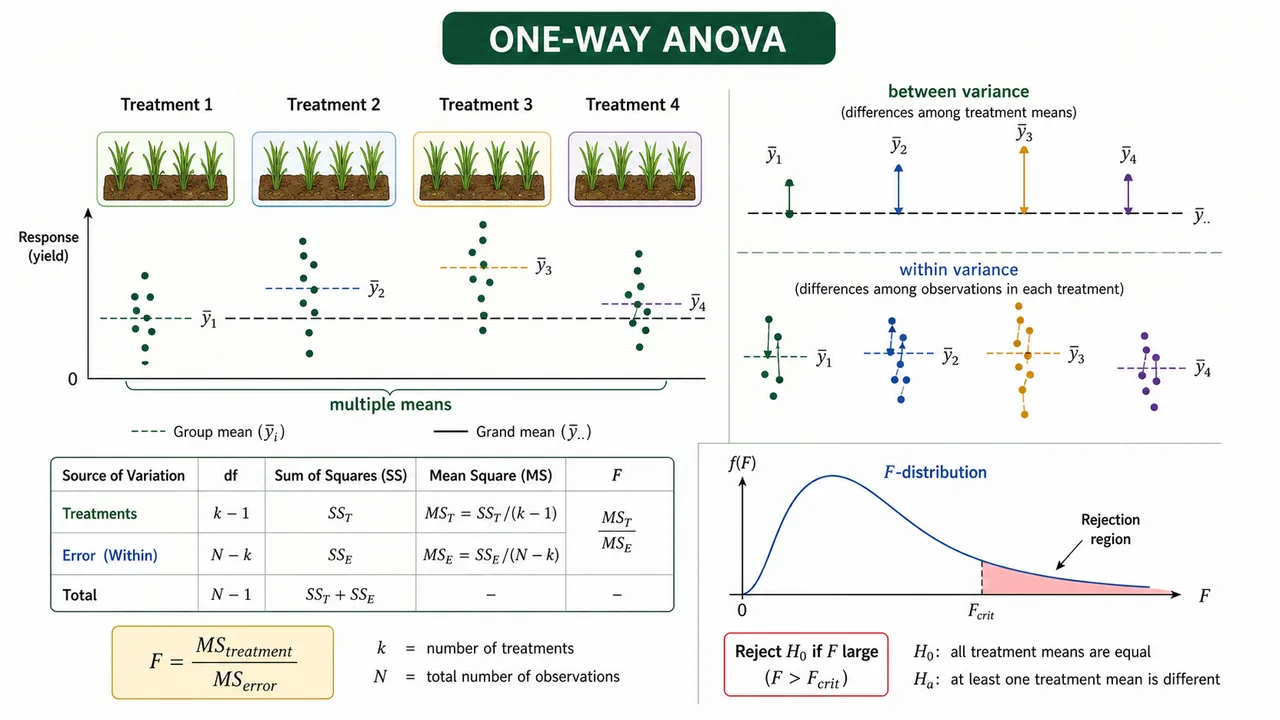
| Source of variation | D.F. | S.S. | M.S. | F-cal. value |
|---|---|---|---|---|
| Treatments | k - 1 | Tr.S.S. | TMS = Tr.S.S. / (k - 1) | F_t = TMS / EMS |
| Blocks / Replications | r - 1 | BSS | BMS = BSS / (r - 1) | F_b = BMS / EMS |
| Error | (r - 1)(k - 1) | ESS | EMS = ESS / ((r - 1)(k - 1)) | - |
| Total | rk - 1 | TSS | - | - |
This ANOVA table shows how total variation is partitioned into treatment, block, and error components before calculating the F-ratio.
Meaning of F-ratio:
The F-value is basically:
- Large F -> treatment differences are likely real
- Small F -> observed differences may just be due to chance
Application
👉🏻 The analysis of variance (ANOVA) technique is used for comparing the means of more than two populations. Whenever a researcher wants to test whether multiple treatments produce different results, ANOVA is the appropriate tool. It is extensively used in agricultural field experiments, laboratory studies, animal science trials, and many other research areas.
Assumptions of ANOVA
IMPORTANT
These four assumptions are frequently asked in exams. If any assumption is violated, the ANOVA results may not be reliable.
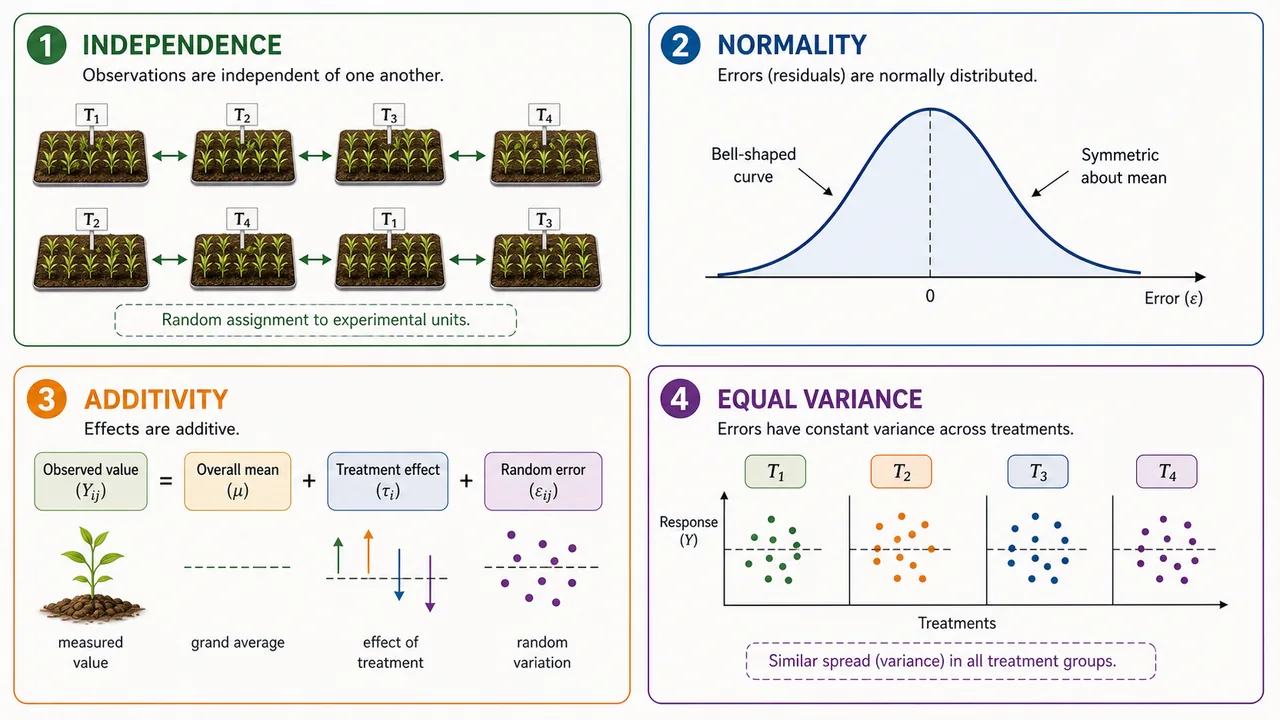
For the ANOVA results to be valid, the following assumptions must hold true:
- The observations are independent -- the value of one observation does not influence any other observation. This is ensured through proper randomization during the experiment.
- Parent population from which observations are taken is normal -- the data within each treatment group should follow a normal distribution (bell-shaped curve). Minor departures from normality are generally tolerable, especially with larger sample sizes.
- Various treatment and environmental effects are additive in nature -- this means the observed value is the sum of the overall mean, treatment effect, block effect (if applicable), and error. There are no interaction effects distorting the additive model.
- The experimental errors are distributed normally with mean zero and variance σ2. This assumption of homogeneity of error variance (also called homoscedasticity) is crucial -- it means the variability within each treatment group is roughly the same.
Field example:
Suppose we compare 4 rice varieties with 5 replications each. If ANOVA gives a significant F-value, we conclude that all 4 varieties do not have the same mean yield. The next step is then to use CD/LSD or another mean comparison to identify which varieties differ.
Summary Table
| Concept | Key Point | Exam Tip |
|---|---|---|
| Full form | Analysis of Variance | Tests means, uses variances |
| Pioneer | R.A. Fisher (1920s, Rothamsted) | Father of modern statistics |
| Purpose | Compare means of more than two populations | Uses F-test internally |
| Variation sources | Assignable (treatments) + Chance (error) | Assignable = measurable |
| Min error d.f. | 12 | Ensures F-test sensitivity |
| One-way | Single factor classification | E.g., comparing varieties |
| Two-way | Two factors simultaneously | E.g., varieties x fertilisers |
| Assumptions | Independence, normality, additivity, homoscedasticity | INAH mnemonic |
TIP
Mnemonic for ANOVA assumptions: "INAH" — Independence, Normality, Additivity, Homogeneity of error variance.
When to Use Which Test?
| Situation | Test |
|---|---|
| Compare mean with known value (large n) | Z-test |
| Compare mean with known value (small n) | t-test |
| Compare two means (small n) | Two-sample t-test |
| Compare more than two means | ANOVA (F-test) |
| Compare two variances | F-test |
| Compare observed vs expected frequencies | Chi-square test |
Summary Cheat Sheet

| Concept / Topic | Key Details |
|---|---|
| ANOVA | Analysis of Variance — tests equality of more than two means |
| Pioneer | R.A. Fisher (1920s, Rothamsted Experimental Station) |
| Purpose | Compare means of more than two populations using F-test |
| Total variation | Assignable causes (treatments) + Chance causes (error) |
| Assignable causes | Identifiable — fertiliser doses, varieties, irrigation levels |
| Chance causes | Uncontrollable random variation (soil, weather, measurement) |
| Min error d.f. | 12 — ensures adequate F-test sensitivity |
| One-way classification | Single factor (e.g., comparing varieties only) |
| Two-way classification | Two factors simultaneously (e.g., varieties x fertilisers) |
| Assumption 1 | Observations are independent (via randomisation) |
| Assumption 2 | Parent population is normally distributed |
| Assumption 3 | Treatment and environmental effects are additive |
| Assumption 4 | Errors distributed normally with homogeneous variance |
| INAH mnemonic | Independence, Normality, Additivity, Homogeneity |
| F-test in ANOVA | Compares treatment variance to error variance |
| If F_calc > F_table | Reject H₀ → at least one treatment mean is different |
| Follow-up | Use Critical Difference (CD) to identify which means differ |
| Z-test | Large n, compare mean with known value |
| t-test | Small n, compare two means |
| F-test | Compare two variances |
| ANOVA | Compare more than two means via F-test |
| Chi-square | Compare observed vs expected frequencies |