🏹 Regression Analysis
Simple linear regression, direct and deviation methods, regression coefficient properties, and comparison with correlation — with agricultural examples
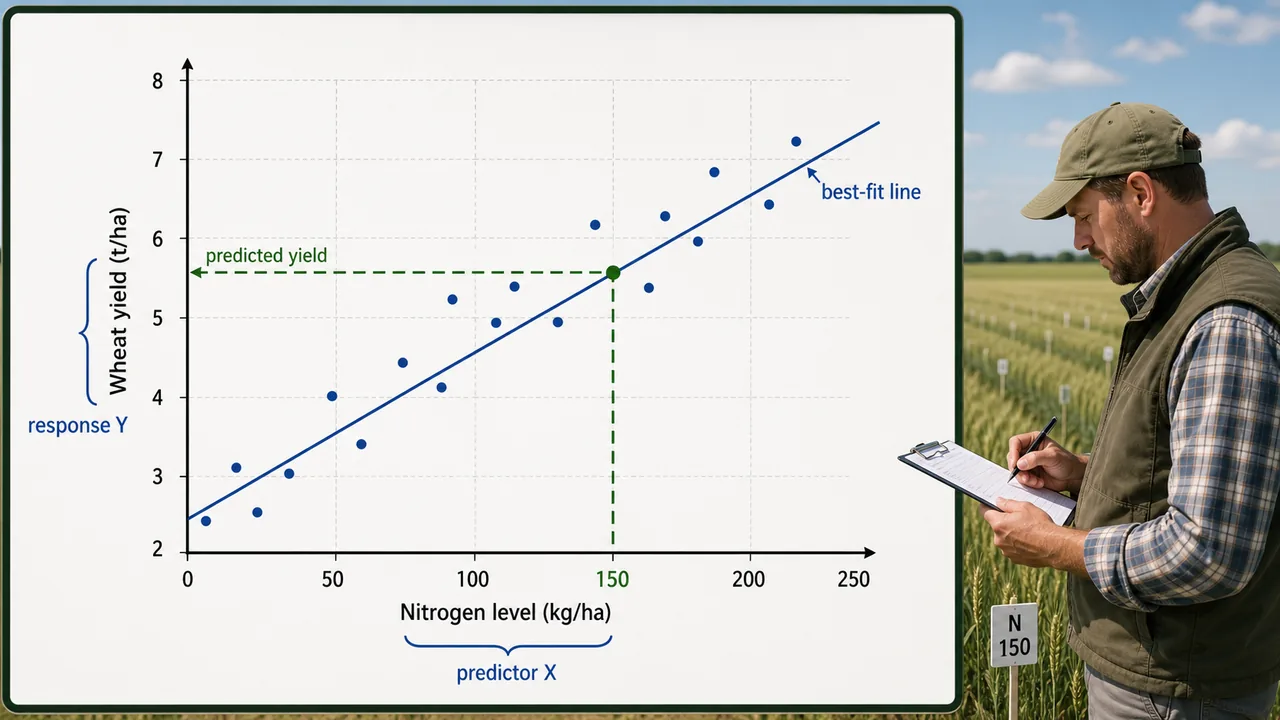
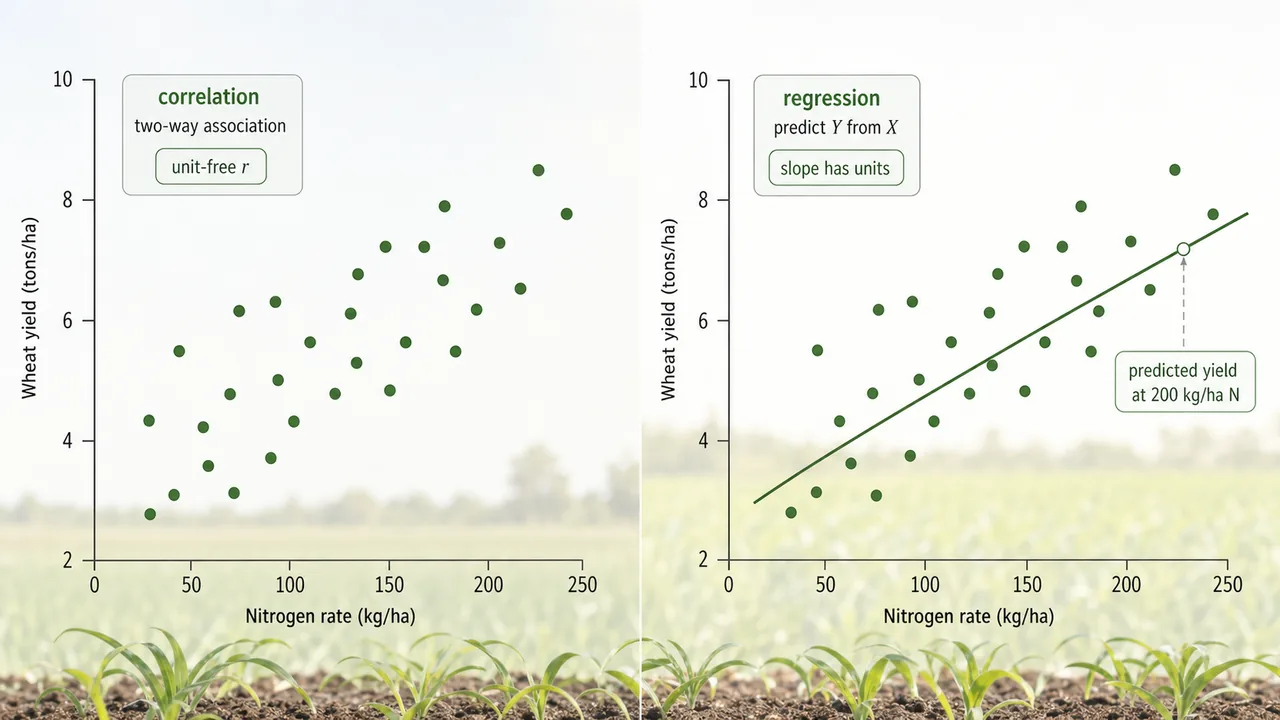
If a soil scientist knows the nitrogen content of a field, can she predict the expected wheat yield? Correlation tells us that nitrogen and yield are related, but regression goes further — it gives us an equation to make that prediction. This predictive power makes regression one of the most practical tools in agricultural research.
-
The term 'regression' literally means 'stepping back towards the average'. This concept originated from the observation that extreme values in one generation tend to move ("regress") back towards the population average in the next generation.
-
It was first used by a British Biometrician Sir Francis Galton. Galton noticed that very tall parents tended to have children who were tall but closer to the average height than their parents. He called this phenomenon "regression towards mediocrity."
Pro Content Locked
Upgrade to Pro to access this lesson and all other premium content.
Charged once for one year · ₹1188 total
Save ₹100/month vs ₹2388/year launch price
- All Agriculture & Banking Courses
- AI Lesson Questions (100/day)
- AI Doubt Solver (50/day)
- Glows & Grows Feedback (30/day)
- AI Section Quiz (20/day)
- 22-Language Translation (100/day)
- Recall Questions (20/day)
- AI Quiz (15/day)
- AI Quiz Paper Analysis (100/day)
- AI Step-by-Step Explanations (100/day)
- Spaced Repetition Recall (FSRS)
- AI Tutor
- Immersive Text Questions
- Audio Lessons — Hindi & English
- Mock Tests & Previous Year Papers
- Summary & Mind Maps
- XP, Levels, Leaderboard & Badges
- Generate New Classrooms
- Voice AI Teacher (AgriDots Live)
- AI Revision Assistant
- Knowledge Gap Analysis
- Interactive Revision (LangGraph)
🔒 Secure one-time yearly payment via Razorpay · No hidden fees
If a soil scientist knows the nitrogen content of a field, can she predict the expected wheat yield? Correlation tells us that nitrogen and yield are related, but regression goes further — it gives us an equation to make that prediction. This predictive power makes regression one of the most practical tools in agricultural research.
-
The term 'regression' literally means 'stepping back towards the average'. This concept originated from the observation that extreme values in one generation tend to move ("regress") back towards the population average in the next generation.
-
It was first used by a British Biometrician Sir Francis Galton. Galton noticed that very tall parents tended to have children who were tall but closer to the average height than their parents. He called this phenomenon "regression towards mediocrity."
-
The relationship between the independent and dependent variables may be expressed as a function. Such functional relationship between two variables is termed as regression. While correlation tells us the strength and direction of a relationship, regression goes further by providing an equation that allows us to predict the value of one variable based on the other.
-
In regression analysis independent variable is also known as regressor or predictor or explanatory variable while dependent variable is also known as regressed or explained variable.
Simple idea:
If correlation says two variables are related, regression asks: by how much will Y change when X changes? That is why regression is mainly a prediction tool.
- When only two variables are involved the functional relationship is known as simple regression.
- If the relationship between two variables is a straight line, it is known as simple linear regression, otherwise it is called as simple non-linear regression. In agricultural research, simple linear regression is widely used to study relationships such as the effect of fertilizer dose on crop yield or the effect of plant density on grain weight.
Direct Method
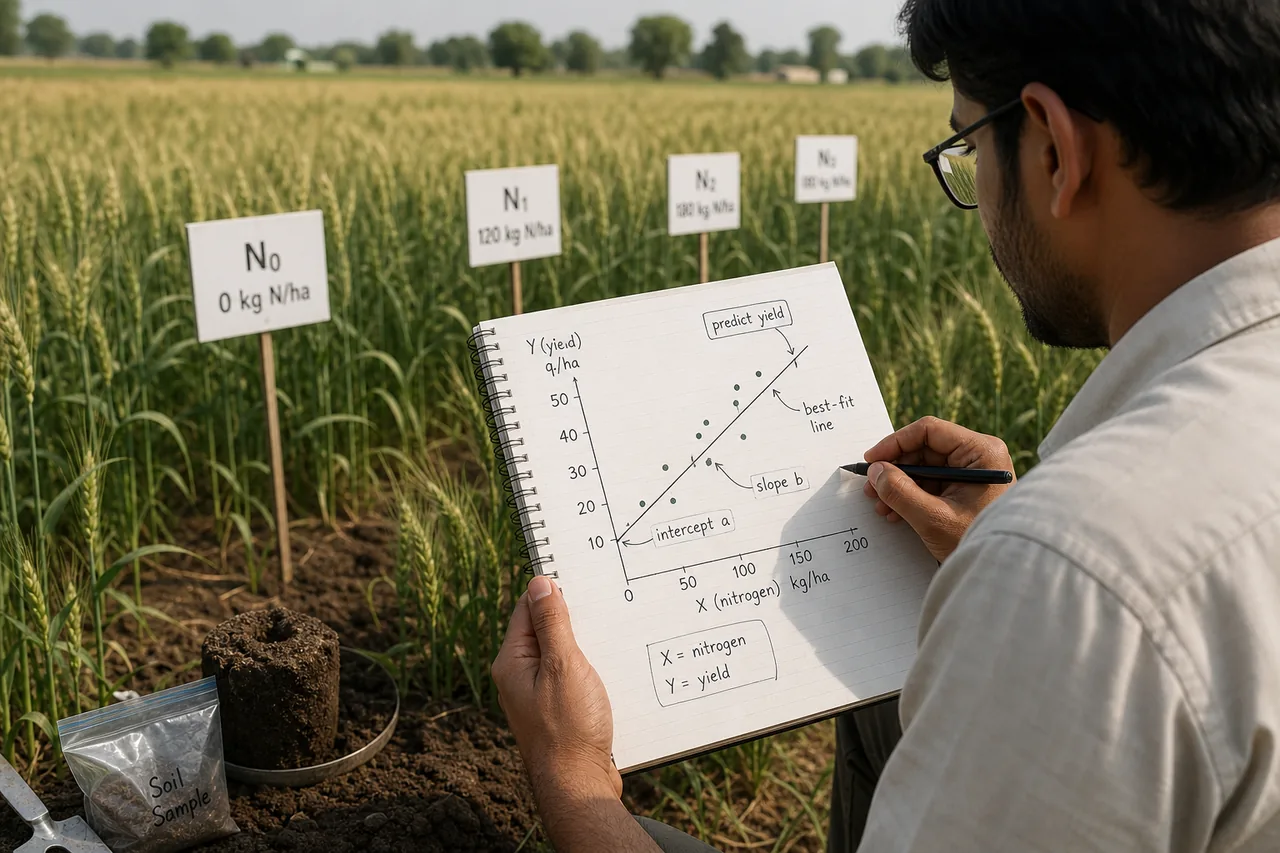
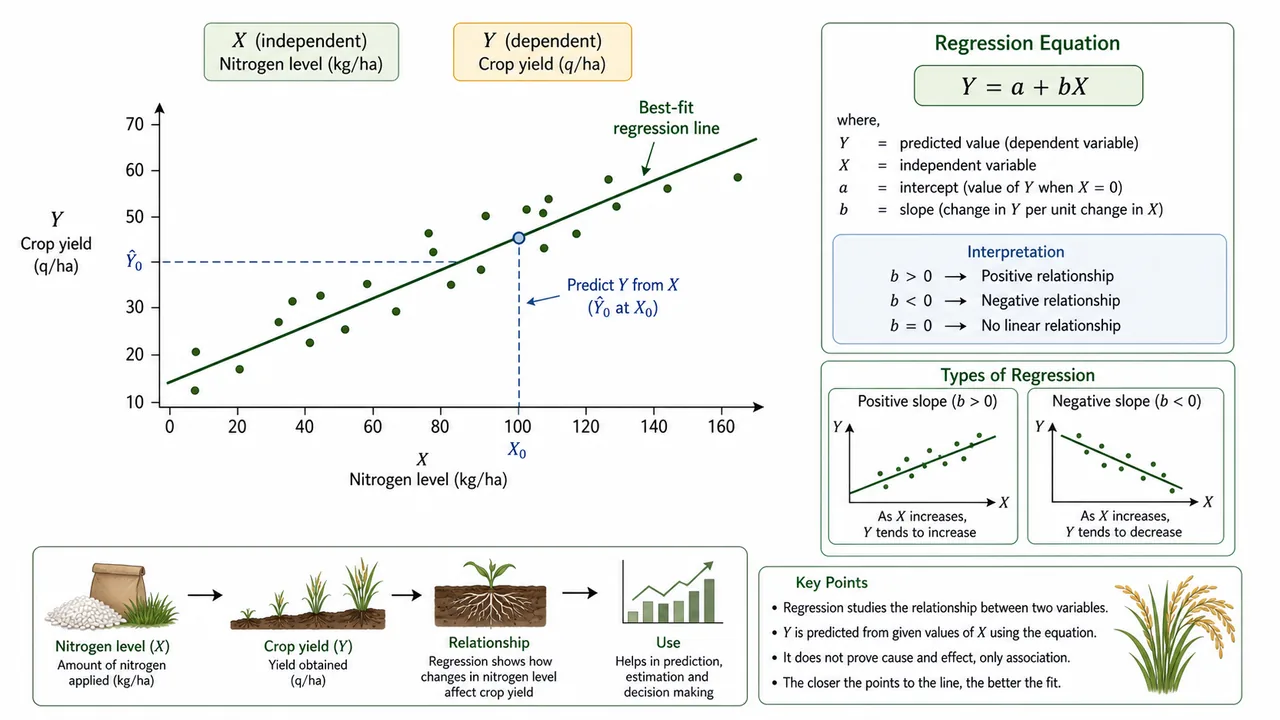
The regression equation of Y on X is given as
Y = a + bX
- Where,
- Y = dependent variable -- the variable we want to predict.
- X = independent variable -- the variable we use to make the prediction.
- a = intercept -- the value of Y when X is zero. It represents the baseline value of the dependent variable.
- b = the regression coefficient (or slope) of the line -- it tells us how much Y changes for every one-unit increase in X.
- a and b are also called as Constants, the constants a and b can be estimated with by applying the "least squares method". The method of least squares finds the values of a and b that minimize the sum of squared differences between the observed and predicted values of Y, giving us the "best fit" line.
- Range of regression is varying between -∞ to +∞. Unlike the correlation coefficient which is bounded between -1 and +1, the regression coefficient has no such bounds because it depends on the units and scale of the variables.
- This gives,
- And
- Where b is called the estimate of regression coefficient of Y on X and it measures the change in Y for a unit change in X.
Agricultural interpretation:
If (b = 2.5) for yield on nitrogen, it means that for every 1-unit increase in nitrogen, the predicted yield increases by 2.5 units on average, as long as the fitted linear model is reasonable.
- Similarly, the regression equation of X on Y is given as
X = a1 + b1Y
- Where X = dependent variable and Y = independent variable
Note that there are always two regression equations for a pair of variables -- the regression of Y on X, and the regression of X on Y. These two lines are generally different (unless the correlation is perfect, i.e., r = +1 or r = -1).
- And
- Where b1 is known as the estimate of regression coefficient of X on Y and 'a' is intercept
Deviation Method
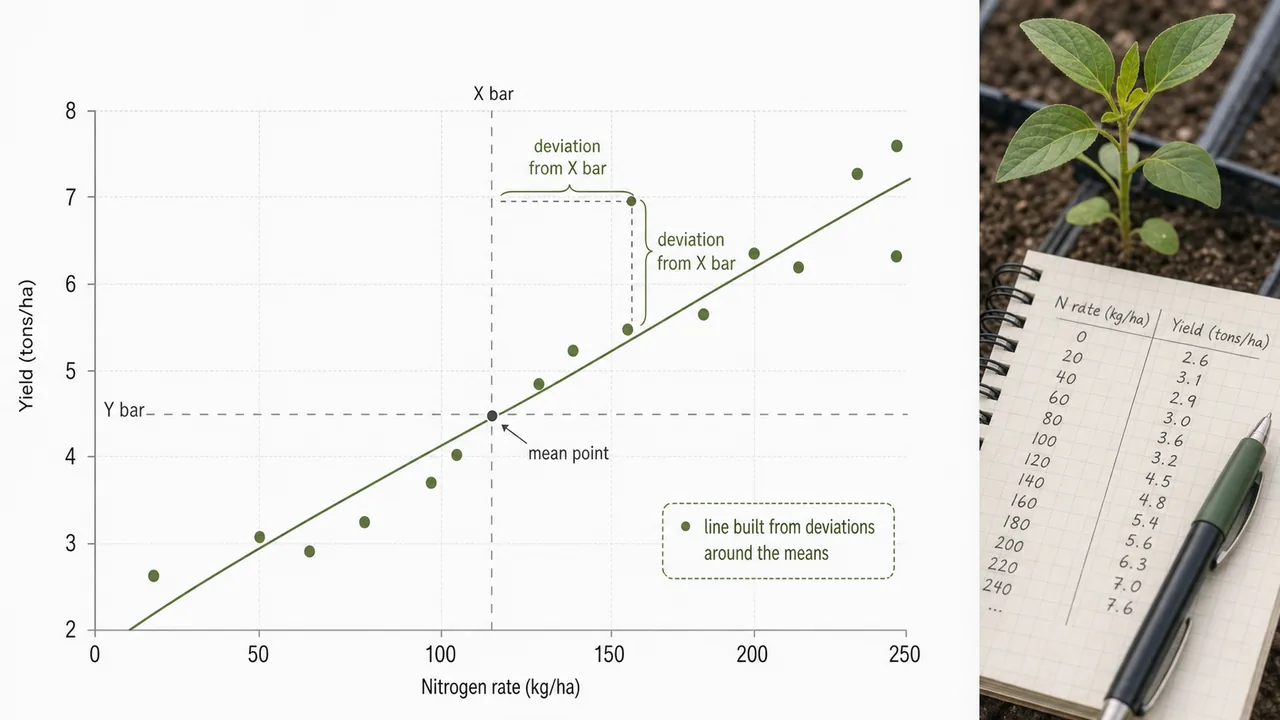
- The regression equation of Y on X is
The deviation method expresses the variables as deviations from their respective means, which simplifies the computation by eliminating the need to calculate the intercept separately.
- The regression equation of X on Y
Properties of Regression Coefficient
These properties are important for understanding how regression coefficients behave and how they relate to the correlation coefficient:
- Correlation coefficient is the geometric mean of the two regression coefficients i.e.
r = ± √ b.b1
This relationship connects regression and correlation. The sign of r is determined by the sign of the regression coefficients (both will have the same sign).
-
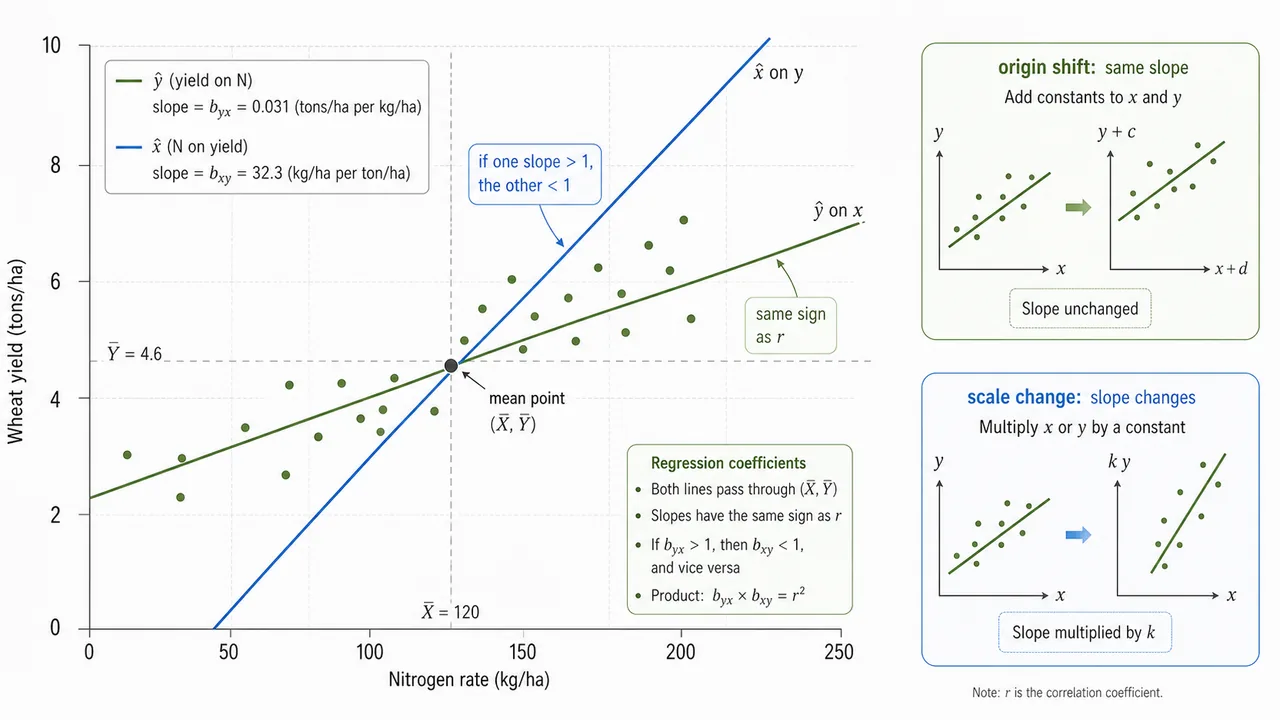
If one of the regression coefficients is greater than unity, the other must be less than unity. This is a direct consequence of the fact that r cannot exceed 1 in absolute value. Since r² = b x b₁, if b > 1, then b₁ must be < 1 (and vice versa) to keep their product ≤ 1.
-
Arithmetic mean of the regression coefficients is greater than the correlation coefficient "r".
-
Regression coefficients are independent of the change of origin but not of scale. This means shifting all X values by a constant does not change the regression coefficient, but multiplying all X values by a constant does change it.
-
Units of "b" are same as that of the dependent variable. More precisely, the unit of b is the unit of Y per unit of X. For example, if Y is yield in kg/ha and X is fertilizer in kg/ha, then b has units of kg yield per kg fertilizer.
-
Regression is only a one-way relationship between Y (dependent variable) and X (independent variable). Unlike correlation (which is symmetric), regression is directional -- the regression of Y on X is different from the regression of X on Y.
-
The range of b is from -∞ to ∞. -∞ for negative b and +∞ for positive b.
👀 Note:
-
Both regression lines pass through the point ((\bar{X}, \bar{Y})). In other words, the mean values of X and Y give the point of intersection of the two regression lines. This is a very useful property -- it means the two regression lines always cross at the point of averages.
-
If r = 0, the two variables are uncorrelated, the lines of regression become perpendicular to each other. This makes intuitive sense -- when there is no relationship, the regression of Y on X is a horizontal line (Y = mean of Y), and the regression of X on Y is a vertical line (X = mean of X), which are perpendicular.
-
If r = ±1, the two regression lines coincide. When correlation is perfect, both regression lines become identical -- they merge into a single straight line on which all data points lie.
-
If the regression coefficients are positive, r is positive and if the regression coefficients are negative, r is negative.
TIP
Quick difference to remember:
- Correlation = tells how strongly two variables move together
- Regression = gives the equation used to predict
Distinguish between Correlation and Regression
| Correlation | Regression |
|---|---|
| Correlation is the relationship between two or more variables. Where the change in one variable affects a change in another variable. | Regression mathematical measure of the average relationship between two or more variables. Where one variable is dependent and other variable is independent. |
| Correlation coefficient measures extent of relationship between two variables. | Regression coefficient estimates the change in one variable for a unit change in another related variable. |
| Correlation is a two-way relationship | Regression is a one-way relationship i.e. Y = a + bx |
| Change in X is independent of change in Y | Change in Y cannot change X |
| Correlation coefficient is independent of units of the variables. | Regression coefficient is expressed in the units of dependent variable. |
| Correlation coefficient always lies between -1 and +1 | Regression coefficient lies between -∞ and +∞ |
| In correlation both the variables are in dependent | A regression variable will be in dependent and other variable will be independent. |
| Correlation coefficient calculated by r = Cov(x,y) / σxσy | The regression coefficient of y on x: byx = Cov(x,y) / V(x) |
IMPORTANT
In summary: Correlation measures the strength and direction of a linear relationship (symmetric, unit-free, range -1 to +1). Regression establishes a predictive equation between a dependent and independent variable (directional, has units, range -∞ to +∞). Both tools are complementary and are often used together in agricultural research.
Summary Table

| Concept | Key Point | Exam Tip |
|---|---|---|
| Regression | Functional relationship; prediction equation | Y = a + bX |
| Pioneer | Sir Francis Galton | "Regression towards mediocrity" |
| Range of b | -∞ to +∞ | Unlike r which is -1 to +1 |
| Regression coefficient (b) | Change in Y per unit change in X | Has units (Y-units per X-unit) |
| Two regression lines | Y on X and X on Y (generally different) | Coincide only when r = ±1 |
| Intersection point | Both lines pass through (X̄, Ȳ) | Point of averages |
| r = 0 | Lines become perpendicular | No relationship |
| r = ±1 | Lines coincide | Perfect relationship |
| r from regression | r = ±√(b × b₁) | Sign matches regression coefficients |
| Least squares method | Minimises sum of squared errors | Best fit line |
| Feature | Correlation | Regression |
|---|---|---|
| Purpose | Measures strength of relationship | Predicts one variable from another |
| Direction | Symmetric (rxy = ryx) | Directional (Y on X ≠ X on Y) |
| Units | Unit-free | Same as dependent variable |
| Range | -1 to +1 | -∞ to +∞ |
| Number of equations | One coefficient | Two regression equations |
Summary Cheat Sheet
| Concept / Topic | Key Details |
|---|---|
| Regression | Functional relationship for prediction; Y = a + bX |
| Pioneer | Sir Francis Galton — "regression towards mediocrity" |
| Regression coefficient (b) | Change in Y per unit change in X; has units |
| Range of b | -∞ to +∞ (unlike r which is -1 to +1) |
| Least squares method | Finds a, b by minimising sum of squared errors |
| Two regression lines | Y on X and X on Y — generally different |
| Intersection point | Both lines pass through (X̄, Ȳ) — point of averages |
| When r = 0 | Two lines become perpendicular |
| When r = ±1 | Two lines coincide (merge into single line) |
| r from regression | r = ±√(b × b₁); sign matches regression coefficients |
| If b > 1 | Then b₁ must be < 1 (and vice versa) |
| AM of regression coefficients | Always greater than correlation coefficient r |
| Independent of | Change of origin but not of scale |
| Regression is | One-way relationship (directional); not symmetric like correlation |
| Correlation | Measures strength; symmetric, unit-free, range -1 to +1 |
| Regression | Establishes prediction equation; directional, has units |
| Simple regression | Only two variables involved |
| Simple linear | Straight-line relationship: Y = a + bX |
| Simple non-linear | Curved relationship between two variables |
| Intercept (a) | Value of Y when X = 0 (baseline) |
| Slope (b) | Rate of change — how much Y changes per unit X |
| Deviation method | Expresses variables as deviations from their means |
| Positive coefficients | r is positive; negative coefficients → r is negative |