🦌India State of Forest Report (ISFR) 2021
Forest cover statistics, canopy density classification, state-wise rankings, mangroves, bamboo cover, carbon stock, and key findings
Measuring India’s Green Cover from Space
The previous lesson covered Forest Legislation — the laws that protect India’s forests. But how do we know whether those laws are working? The answer lies in data. Every two years, satellites scan India’s 328 million hectares of land to measure exactly how much is covered by forests.
The resulting India State of Forest Report (ISFR) is one of the most important environmental documents produced by the government. For competitive exams, the ISFR is a goldmine of statistics — from state-wise rankings to carbon stock figures.
This lesson covers:
- What is ISFR? — published by FSI, biennial since 1987
- Forest cover vs tree cover — the critical distinction
- Classification by canopy density — VDF, MDF, Open Forest, Scrub
- State-wise rankings — area-wise and percentage-wise leaders
- Mangroves, bamboo, and carbon stock — special focus areas
What is ISFR?
| Feature | Detail |
|---|---|
| Full form | India State of Forest Report |
| Edition covered | 17th (ISFR 2021) |
| Published by | Forest Survey of India (FSI) under MoEFCC |
| Assessment frequency | Biennial (every 2 years) since 1987 |
| Technology used | Remote sensing (satellite imagery) + ground-truthing |
| Policy target | National Forest Policy 1988 — 33% forest and tree cover |
| Purpose | Monitor progress toward 33% target; guide policy and planning |
NOTE
FSI uses satellite data combined with field verification to produce these reports. The ISFR covers forest cover, tree cover, mangroves, bamboo, and carbon stock.
Forest Cover vs Tree Cover — The Distinction
| Parameter | Forest Cover | Tree Cover |
|---|---|---|
| Minimum area | >1 hectare | <1 hectare |
| Canopy density | 10% or above | Any |
| Location | Inside or outside recorded forest | Outside recorded forest only |
| Includes | Bamboos, orchards, coconut, palm | Scattered trees, roadside trees, bund trees |
| Ownership | Irrespective (government, private, community) | Irrespective |
Total tree resources = Forest Cover + Tree Cover
TIP
Exam distinction: Forest cover requires >1 ha AND >10% canopy density. Tree cover = patches <1 ha outside recorded forest. Together they give the complete picture.
Classification of Forest Cover by Canopy Density
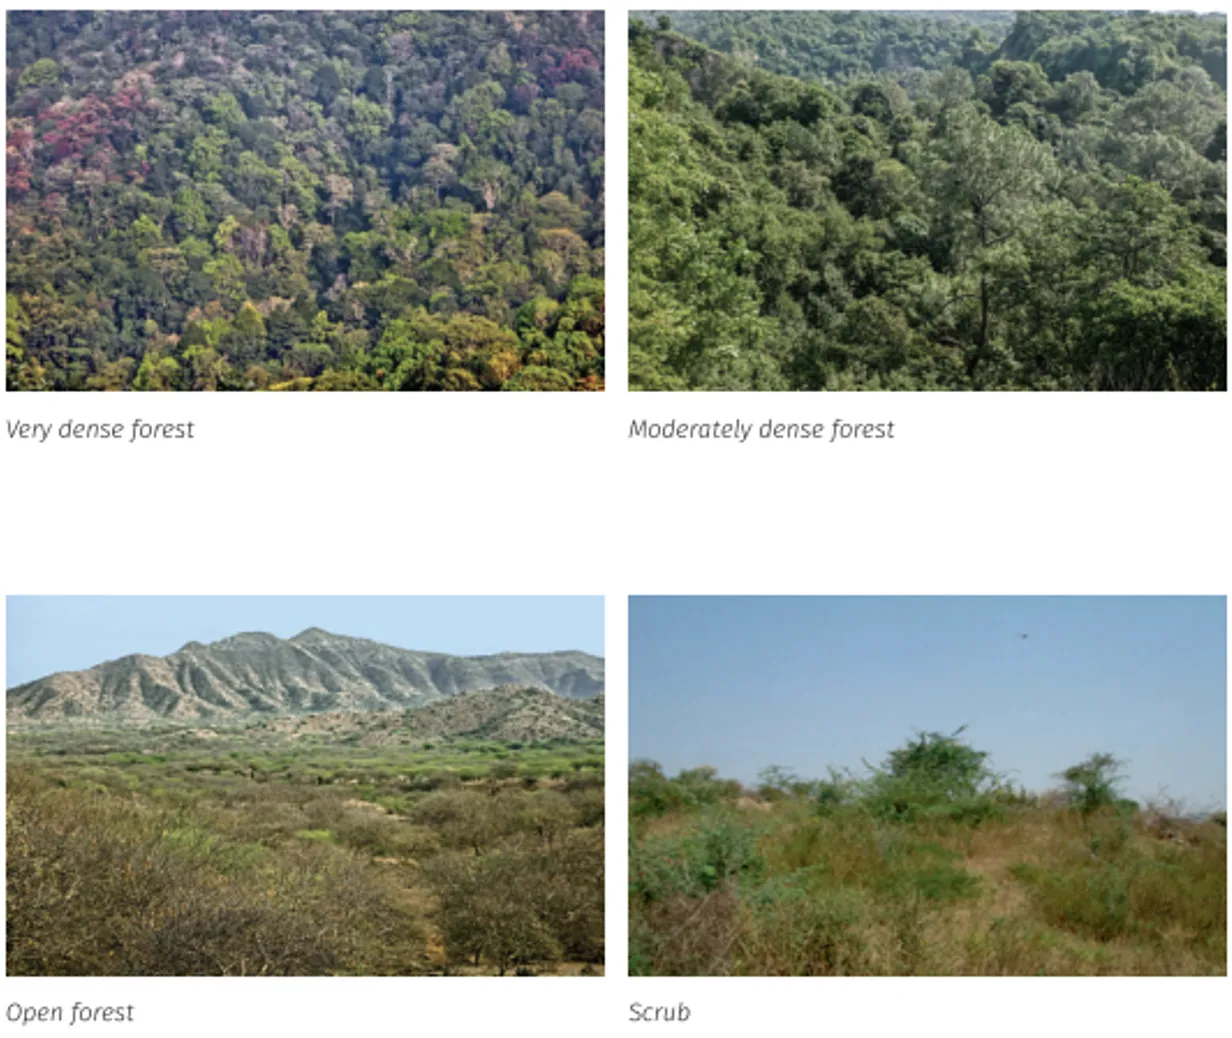
| Class | Canopy Density | Ecological Value |
|---|---|---|
| Very Dense Forest (VDF) | 70% and above | Most pristine, highest biodiversity |
| Moderately Dense Forest (MDF) | 40-70% | Good ecological health |
| Open Forest (OF) | 10-40% | Degraded or transitional |
| Scrub | <10% | Highly degraded |
| Non-forest | No tree cover | Agricultural land, settlements, water |
Key Findings of ISFR 2021
| Parameter | Value (ISFR 2021) | Change from 2019 |
|---|---|---|
| Total forest cover | 7,13,789 sq km (21.71%) | +1,540 sq km |
| Total tree cover | 95,748 sq km (2.91%) | +721 sq km |
| Total forest + tree cover | 8,09,537 sq km (24.62%) | +2,261 sq km |
| States/UTs above 33% forest cover | 17 | — |
| States/UTs above 75% forest cover | 5 | — |
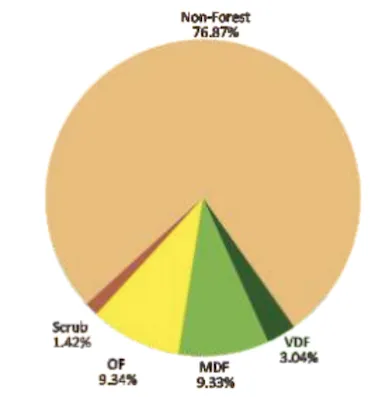
| Class | Area (Sq Km) | Percentage of Geographical Area |
|---|---|---|
| Very Dense Forest | 99,779 | 3.04 |
| Moderately Dense Forest | 3,06,890 | 9.33 |
| Open Forest | 3,07,120 | 9.34 |
| Total Forest Cover* | 7,13,789 | 21.71 |
| Tree Cover | 95,748 | 2.91 |
| Total Forest and Tree Cover | 8,09,537 | 24.62 |
| Scrub | 46,539 | 1.42 |
| Non-Forest | 25,27,141 | 76.87 |
| Total Geographic Area | 32,87,469 | 100.00 |
*Includes 4,992 sq km under Mangrove Cover
IMPORTANT
India’s total forest + tree cover is 24.62% — still short of the NFP 1988 target of 33%. The gap is nearly 8-9 percentage points.
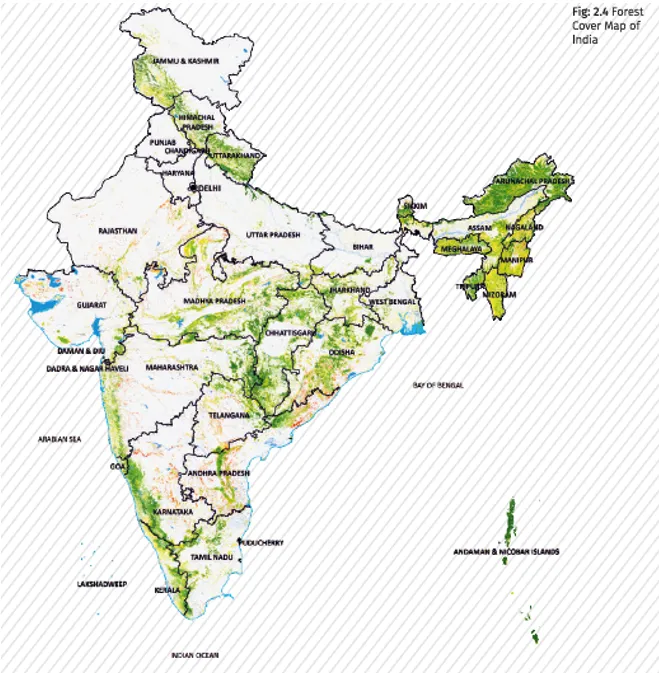
State-wise Rankings
State-wise rankings are among the most frequently tested ISFR facts in competitive exams. Note the difference between area-wise and percentage-wise leaders — exams often test this distinction to trip candidates.
Maximum Forest Cover (Area-wise)
| Rank | State | Area (sq km) |
|---|---|---|
| 1 | Madhya Pradesh | 77,493 |
| 2 | Arunachal Pradesh | 66,431 |
| 3 | Chhattisgarh | 55,717 |
Maximum Forest Cover (Percentage-wise)
| Rank | State/UT | Percentage |
|---|---|---|
| 1 | Lakshadweep (UT) | 90.33% |
| 2 | Mizoram (State) | 84.53% |
| 3 | Andaman & Nicobar (UT) | 81.75% |
TIP
Mnemonic for area-wise ranking: “MAC” — Madhya Pradesh, Arunachal Pradesh, Chhattisgarh. For percentage among states: Mizoram leads.
Category-wise Top States
| Category | Top State |
|---|---|
| Highest Very Dense Forests (VDF) | Arunachal Pradesh (followed by Maharashtra) |
| Highest Moderately Dense Forests (MDF) | Madhya Pradesh |
| Highest Open Forests | Madhya Pradesh |
| Largest Trees Outside Forest (TOF) — area | Maharashtra (followed by Odisha, Karnataka) |
| Highest TOF — percentage | Kerala (followed by Goa, Nagaland) |
| Highest fuelwood dependence | Maharashtra |
| Highest fodder/timber/bamboo dependence | Madhya Pradesh |
Forest Cover Changes
States with Maximum Increase
| Rank | State | Increase (sq km) |
|---|---|---|
| 1 | Andhra Pradesh | 647 |
| 2 | Telangana | 632 |
| 3 | Odisha | 537 |
States with Decrease
- Five North-Eastern states showed loss: Arunachal Pradesh > Manipur > Nagaland > Mizoram > Meghalaya
- Total NE forest cover: 1,70,541 sq km (65.05% of NE’s area)
- Overall decrease in NE: 1,020 sq km
Main reasons for forest loss:
- Shifting cultivation (Jhum) — the biggest driver in NE India
- Anthropogenic pressures
- Rotational felling
- Diversion for development
- Submergence of forest cover
- Agricultural expansion
- Natural disasters
Hill Districts
- Forest cover in hill districts: 2,83,104 sq km (40.17% of their area)
- Decrease of 902 sq km — concerning for fragile mountain ecosystems
- Hill/district definition: altitude above 500 m from mean sea level
- NFP 1988 target for hills: 66% forest cover
Tribal Districts
- Total forest cover: 4,22,351 sq km (37.54% of tribal district area)
- Overall decrease of 55 sq km
- 218 tribal districts in 27 States/UTs
Mangroves
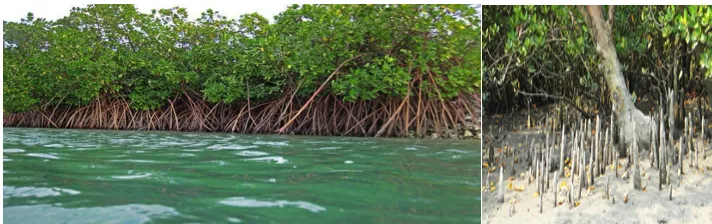
Mangroves are a unique coastal forest type assessed separately in the ISFR. They play a critical role in coastal protection, fisheries, and carbon sequestration — and their statistics are frequently tested in exams.
| Feature | Detail |
|---|---|
| Definition | Salt-tolerant plant communities in tropical/subtropical intertidal regions |
| Rainfall range | 1,000-3,000 mm |
| Temperature range | 26-35 degree C |
| Latitude range | 24 N to 38.5 S |
| India’s share of world mangroves | ~3% |
| India’s mangrove cover (ISFR 2021) | 4,992 sq km |
| Change from 2019 | +17 sq km |
| Largest mangrove area | Sundarbans, West Bengal (42.45%) of India’s total mangroves |
| Mangroves as % of India’s area | 0.15% |
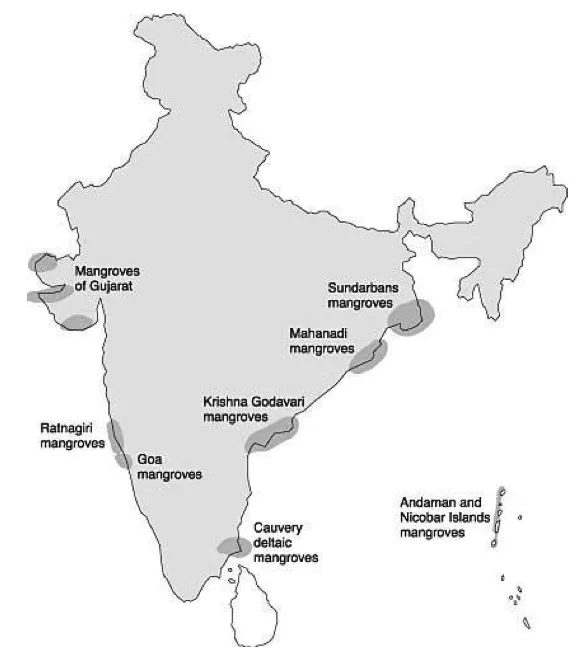
Top three gainers in mangrove cover:
- Odisha (+8 sq km)
- Maharashtra (+4 sq km)
- Karnataka (+3 sq km)
NOTE
Mangroves serve as nurseries for fish, buffer zones against cyclones and tsunamis, and support rich coastal biodiversity. The Sundarbans is the world’s largest contiguous mangrove forest.
Bamboo Cover
| Feature | Detail |
|---|---|
| Total bamboo-bearing area | 1,49,443 sq km |
| Change from 2019 | Decrease of 10,594 sq km |
| Top states (area) | Madhya Pradesh > Arunachal Pradesh > Maharashtra |
The decline in bamboo area is a concern and may be due to overexploitation, habitat loss, and developmental activities.
Carbon Stock
Carbon stock estimation has become increasingly important as India pursues its climate commitments under the Paris Agreement. The ISFR provides crucial data on how much carbon India’s forests store — a figure directly tied to international negotiations and carbon credit markets.
| Feature | Detail |
|---|---|
| India’s NDC target | Additional carbon sink of 2.5-3.0 billion tonnes CO2 equivalent by 2030 |
| Total carbon stock in forests | 7,204 million tonnes |
| Increase from previous assessment | +79.4 million tonnes |
| Top states (carbon stock) | Arunachal Pradesh > Madhya Pradesh > Chhattisgarh > Maharashtra |
Carbon stock includes carbon stored in living biomass, soil, dead wood, and litter. This data is essential for carbon trading, REDD+ programmes, and meeting international climate commitments under the Paris Agreement.
Role in Sustainable Development Goals (SDGs)
| SDG | How Forests Contribute |
|---|---|
| SDG 1 (No Poverty) | Forest-based livelihoods for 300 million Indians |
| SDG 6 (Clean Water) | Watershed protection and groundwater recharge |
| SDG 13 (Climate Action) | Carbon sequestration (7,204 million tonnes) |
| SDG 15 (Life on Land) | Biodiversity conservation, habitat protection |
Exam Tips
TIP
High-frequency ISFR facts:
- ISFR edition — 17th (2021)
- Published by — FSI (under MoEFCC), biennial since 1987
- Total forest + tree cover — 24.62% (target: 33%)
- Forest cover — 21.71%, Tree cover — 2.91%
- Max forest cover (area) — Madhya Pradesh
- Max forest cover (%) among states — Mizoram (84.53%)
- Max increase — Andhra Pradesh (+647 sq km)
- Decrease mainly in — North-Eastern states (shifting cultivation)
- Sundarbans = 42.45% of India’s mangroves
- Total carbon stock — 7,204 million tonnes
- NDC target — 2.5-3.0 billion tonnes CO2 sink by 2030
- Forest cover definition — >1 ha, >10% canopy density
Summary Table
| Topic | Key Fact |
|---|---|
| ISFR edition | 17th (2021) |
| Assessment body | Forest Survey of India (FSI) |
| Frequency | Biennial (since 1987) |
| Total forest cover | 7,13,789 sq km (21.71%) |
| Total tree cover | 95,748 sq km (2.91%) |
| Total forest + tree cover | 8,09,537 sq km (24.62%) |
| NFP 1988 target | 33% (plains), 66% (hills) |
| Max forest area (state) | Madhya Pradesh (77,493 sq km) |
| Max forest % (state) | Mizoram (84.53%) |
| Max increase | Andhra Pradesh (+647 sq km) |
| Max decrease region | North-East (-1,020 sq km) |
| Mangrove cover | 4,992 sq km (Sundarbans = 42.45%) |
| Bamboo area | 1,49,443 sq km (declined) |
| Carbon stock | 7,204 million tonnes (+79.4 MT) |
| NDC carbon sink target | 2.5-3.0 billion tonnes CO2 by 2030 |
Summary Cheat Sheet
| Concept / Topic | Key Details |
|---|---|
| ISFR 2021 | India State of Forest Report; published by FSI (Forest Survey of India) |
| FSI headquarters | Dehradun |
| Total forest cover | 7,13,789 sq km (21.71% of geographic area) |
| Tree cover | 95,748 sq km (2.91%) |
| Forest + Tree cover | 24.62% of geographic area |
| Very Dense Forest | >70% canopy; 99,779 sq km |
| Moderately Dense Forest | 40–70% canopy; 3,06,890 sq km |
| Open Forest | 10–40% canopy; 3,07,120 sq km |
| Max forest cover (area) | Madhya Pradesh > Arunachal Pradesh > Chhattisgarh |
| Max forest cover (% wise) | Mizoram (84.53%) among states; Lakshadweep (90.33%) among UTs |
| Max forest cover increase | Andhra Pradesh > Telangana > Odisha |
| Bamboo area | 1,49,443 sq km (declined) |
| Carbon stock | 7,204 million tonnes (+79.4 MT over previous assessment) |
| NDC target | 2.5–3.0 billion tonnes CO₂ equivalent carbon sink by 2030 |
| Mangrove cover | 4,992 sq km; Sundarbans is largest |
| National Forest Policy target | 33% of total geographical area |
TIP
Section complete: This concludes Section 1 — Forestry Foundations. You have covered forest definitions, classification, forestry as a discipline, silviculture, tree species, social forestry, mensuration, legislation, and ISFR data. These form the foundation for the agroforestry and applied forestry sections ahead.
Pro Content Locked
Upgrade to Pro to access this lesson and all other premium content.
₹2388 billed yearly
- All Agriculture & Banking Courses
- AI Lesson Questions (100/day)
- AI Doubt Solver (50/day)
- Glows & Grows Feedback (30/day)
- AI Section Quiz (20/day)
- 22-Language Translation (30/day)
- Recall Questions (20/day)
- AI Quiz (15/day)
- AI Quiz Paper Analysis
- AI Step-by-Step Explanations
- Spaced Repetition Recall (FSRS)
- AI Tutor
- Immersive Text Questions
- Audio Lessons — Hindi & English
- Mock Tests & Previous Year Papers
- Summary & Mind Maps
- XP, Levels, Leaderboard & Badges
- Generate New Classrooms
- Voice AI Teacher (AgriDots Live)
- AI Revision Assistant
- Knowledge Gap Analysis
- Interactive Revision (LangGraph)
🔒 Secure via Razorpay · Cancel anytime · No hidden fees
Measuring India’s Green Cover from Space
The previous lesson covered Forest Legislation — the laws that protect India’s forests. But how do we know whether those laws are working? The answer lies in data. Every two years, satellites scan India’s 328 million hectares of land to measure exactly how much is covered by forests.
The resulting India State of Forest Report (ISFR) is one of the most important environmental documents produced by the government. For competitive exams, the ISFR is a goldmine of statistics — from state-wise rankings to carbon stock figures.
This lesson covers:
- What is ISFR? — published by FSI, biennial since 1987
- Forest cover vs tree cover — the critical distinction
- Classification by canopy density — VDF, MDF, Open Forest, Scrub
- State-wise rankings — area-wise and percentage-wise leaders
- Mangroves, bamboo, and carbon stock — special focus areas
What is ISFR?
| Feature | Detail |
|---|---|
| Full form | India State of Forest Report |
| Edition covered | 17th (ISFR 2021) |
| Published by | Forest Survey of India (FSI) under MoEFCC |
| Assessment frequency | Biennial (every 2 years) since 1987 |
| Technology used | Remote sensing (satellite imagery) + ground-truthing |
| Policy target | National Forest Policy 1988 — 33% forest and tree cover |
| Purpose | Monitor progress toward 33% target; guide policy and planning |
NOTE
FSI uses satellite data combined with field verification to produce these reports. The ISFR covers forest cover, tree cover, mangroves, bamboo, and carbon stock.
Forest Cover vs Tree Cover — The Distinction
| Parameter | Forest Cover | Tree Cover |
|---|---|---|
| Minimum area | >1 hectare | <1 hectare |
| Canopy density | 10% or above | Any |
| Location | Inside or outside recorded forest | Outside recorded forest only |
| Includes | Bamboos, orchards, coconut, palm | Scattered trees, roadside trees, bund trees |
| Ownership | Irrespective (government, private, community) | Irrespective |
Total tree resources = Forest Cover + Tree Cover
TIP
Exam distinction: Forest cover requires >1 ha AND >10% canopy density. Tree cover = patches <1 ha outside recorded forest. Together they give the complete picture.
Classification of Forest Cover by Canopy Density
| Class | Canopy Density | Ecological Value |
|---|---|---|
| Very Dense Forest (VDF) | 70% and above | Most pristine, highest biodiversity |
| Moderately Dense Forest (MDF) | 40-70% | Good ecological health |
| Open Forest (OF) | 10-40% | Degraded or transitional |
| Scrub | <10% | Highly degraded |
| Non-forest | No tree cover | Agricultural land, settlements, water |
Key Findings of ISFR 2021
| Parameter | Value (ISFR 2021) | Change from 2019 |
|---|---|---|
| Total forest cover | 7,13,789 sq km (21.71%) | +1,540 sq km |
| Total tree cover | 95,748 sq km (2.91%) | +721 sq km |
| Total forest + tree cover | 8,09,537 sq km (24.62%) | +2,261 sq km |
| States/UTs above 33% forest cover | 17 | — |
| States/UTs above 75% forest cover | 5 | — |
| Class | Area (Sq Km) | Percentage of Geographical Area |
|---|---|---|
| Very Dense Forest | 99,779 | 3.04 |
| Moderately Dense Forest | 3,06,890 | 9.33 |
| Open Forest | 3,07,120 | 9.34 |
| Total Forest Cover* | 7,13,789 | 21.71 |
| Tree Cover | 95,748 | 2.91 |
| Total Forest and Tree Cover | 8,09,537 | 24.62 |
| Scrub | 46,539 | 1.42 |
| Non-Forest | 25,27,141 | 76.87 |
| Total Geographic Area | 32,87,469 | 100.00 |
*Includes 4,992 sq km under Mangrove Cover
IMPORTANT
India’s total forest + tree cover is 24.62% — still short of the NFP 1988 target of 33%. The gap is nearly 8-9 percentage points.
State-wise Rankings
State-wise rankings are among the most frequently tested ISFR facts in competitive exams. Note the difference between area-wise and percentage-wise leaders — exams often test this distinction to trip candidates.
Maximum Forest Cover (Area-wise)
| Rank | State | Area (sq km) |
|---|---|---|
| 1 | Madhya Pradesh | 77,493 |
| 2 | Arunachal Pradesh | 66,431 |
| 3 | Chhattisgarh | 55,717 |
Maximum Forest Cover (Percentage-wise)
| Rank | State/UT | Percentage |
|---|---|---|
| 1 | Lakshadweep (UT) | 90.33% |
| 2 | Mizoram (State) | 84.53% |
| 3 | Andaman & Nicobar (UT) | 81.75% |
TIP
Mnemonic for area-wise ranking: “MAC” — Madhya Pradesh, Arunachal Pradesh, Chhattisgarh. For percentage among states: Mizoram leads.
Category-wise Top States
| Category | Top State |
|---|---|
| Highest Very Dense Forests (VDF) | Arunachal Pradesh (followed by Maharashtra) |
| Highest Moderately Dense Forests (MDF) | Madhya Pradesh |
| Highest Open Forests | Madhya Pradesh |
| Largest Trees Outside Forest (TOF) — area | Maharashtra (followed by Odisha, Karnataka) |
| Highest TOF — percentage | Kerala (followed by Goa, Nagaland) |
| Highest fuelwood dependence | Maharashtra |
| Highest fodder/timber/bamboo dependence | Madhya Pradesh |
Forest Cover Changes
States with Maximum Increase
| Rank | State | Increase (sq km) |
|---|---|---|
| 1 | Andhra Pradesh | 647 |
| 2 | Telangana | 632 |
| 3 | Odisha | 537 |
States with Decrease
- Five North-Eastern states showed loss: Arunachal Pradesh > Manipur > Nagaland > Mizoram > Meghalaya
- Total NE forest cover: 1,70,541 sq km (65.05% of NE’s area)
- Overall decrease in NE: 1,020 sq km
Main reasons for forest loss:
- Shifting cultivation (Jhum) — the biggest driver in NE India
- Anthropogenic pressures
- Rotational felling
- Diversion for development
- Submergence of forest cover
- Agricultural expansion
- Natural disasters
Hill Districts
- Forest cover in hill districts: 2,83,104 sq km (40.17% of their area)
- Decrease of 902 sq km — concerning for fragile mountain ecosystems
- Hill/district definition: altitude above 500 m from mean sea level
- NFP 1988 target for hills: 66% forest cover
Tribal Districts
- Total forest cover: 4,22,351 sq km (37.54% of tribal district area)
- Overall decrease of 55 sq km
- 218 tribal districts in 27 States/UTs
Mangroves
Mangroves are a unique coastal forest type assessed separately in the ISFR. They play a critical role in coastal protection, fisheries, and carbon sequestration — and their statistics are frequently tested in exams.
| Feature | Detail |
|---|---|
| Definition | Salt-tolerant plant communities in tropical/subtropical intertidal regions |
| Rainfall range | 1,000-3,000 mm |
| Temperature range | 26-35 degree C |
| Latitude range | 24 N to 38.5 S |
| India’s share of world mangroves | ~3% |
| India’s mangrove cover (ISFR 2021) | 4,992 sq km |
| Change from 2019 | +17 sq km |
| Largest mangrove area | Sundarbans, West Bengal (42.45%) of India’s total mangroves |
| Mangroves as % of India’s area | 0.15% |
Top three gainers in mangrove cover:
- Odisha (+8 sq km)
- Maharashtra (+4 sq km)
- Karnataka (+3 sq km)
NOTE
Mangroves serve as nurseries for fish, buffer zones against cyclones and tsunamis, and support rich coastal biodiversity. The Sundarbans is the world’s largest contiguous mangrove forest.
Bamboo Cover
| Feature | Detail |
|---|---|
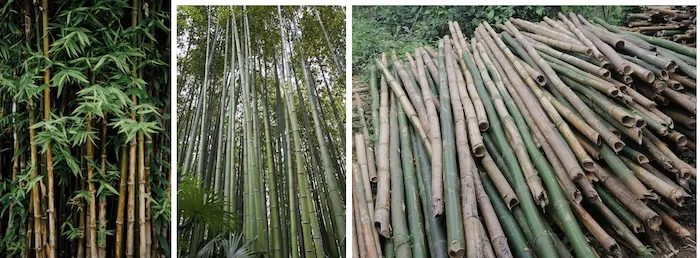
| Total bamboo-bearing area | 1,49,443 sq km |
| Change from 2019 | Decrease of 10,594 sq km |
| Top states (area) | Madhya Pradesh > Arunachal Pradesh > Maharashtra |
The decline in bamboo area is a concern and may be due to overexploitation, habitat loss, and developmental activities.
Carbon Stock
Carbon stock estimation has become increasingly important as India pursues its climate commitments under the Paris Agreement. The ISFR provides crucial data on how much carbon India’s forests store — a figure directly tied to international negotiations and carbon credit markets.
| Feature | Detail |
|---|---|
| India’s NDC target | Additional carbon sink of 2.5-3.0 billion tonnes CO2 equivalent by 2030 |
| Total carbon stock in forests | 7,204 million tonnes |
| Increase from previous assessment | +79.4 million tonnes |
| Top states (carbon stock) | Arunachal Pradesh > Madhya Pradesh > Chhattisgarh > Maharashtra |
Carbon stock includes carbon stored in living biomass, soil, dead wood, and litter. This data is essential for carbon trading, REDD+ programmes, and meeting international climate commitments under the Paris Agreement.
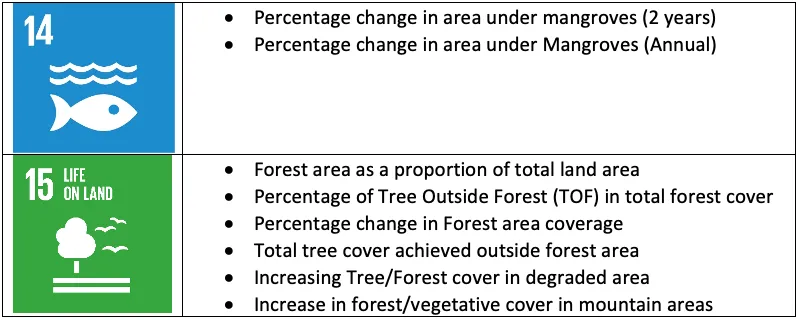
Role in Sustainable Development Goals (SDGs)
| SDG | How Forests Contribute |
|---|---|
| SDG 1 (No Poverty) | Forest-based livelihoods for 300 million Indians |
| SDG 6 (Clean Water) | Watershed protection and groundwater recharge |
| SDG 13 (Climate Action) | Carbon sequestration (7,204 million tonnes) |
| SDG 15 (Life on Land) | Biodiversity conservation, habitat protection |
Exam Tips
TIP
High-frequency ISFR facts:
- ISFR edition — 17th (2021)
- Published by — FSI (under MoEFCC), biennial since 1987
- Total forest + tree cover — 24.62% (target: 33%)
- Forest cover — 21.71%, Tree cover — 2.91%
- Max forest cover (area) — Madhya Pradesh
- Max forest cover (%) among states — Mizoram (84.53%)
- Max increase — Andhra Pradesh (+647 sq km)
- Decrease mainly in — North-Eastern states (shifting cultivation)
- Sundarbans = 42.45% of India’s mangroves
- Total carbon stock — 7,204 million tonnes
- NDC target — 2.5-3.0 billion tonnes CO2 sink by 2030
- Forest cover definition — >1 ha, >10% canopy density
Summary Table
| Topic | Key Fact |
|---|---|
| ISFR edition | 17th (2021) |
| Assessment body | Forest Survey of India (FSI) |
| Frequency | Biennial (since 1987) |
| Total forest cover | 7,13,789 sq km (21.71%) |
| Total tree cover | 95,748 sq km (2.91%) |
| Total forest + tree cover | 8,09,537 sq km (24.62%) |
| NFP 1988 target | 33% (plains), 66% (hills) |
| Max forest area (state) | Madhya Pradesh (77,493 sq km) |
| Max forest % (state) | Mizoram (84.53%) |
| Max increase | Andhra Pradesh (+647 sq km) |
| Max decrease region | North-East (-1,020 sq km) |
| Mangrove cover | 4,992 sq km (Sundarbans = 42.45%) |
| Bamboo area | 1,49,443 sq km (declined) |
| Carbon stock | 7,204 million tonnes (+79.4 MT) |
| NDC carbon sink target | 2.5-3.0 billion tonnes CO2 by 2030 |
Summary Cheat Sheet
| Concept / Topic | Key Details |
|---|---|
| ISFR 2021 | India State of Forest Report; published by FSI (Forest Survey of India) |
| FSI headquarters | Dehradun |
| Total forest cover | 7,13,789 sq km (21.71% of geographic area) |
| Tree cover | 95,748 sq km (2.91%) |
| Forest + Tree cover | 24.62% of geographic area |
| Very Dense Forest | >70% canopy; 99,779 sq km |
| Moderately Dense Forest | 40–70% canopy; 3,06,890 sq km |
| Open Forest | 10–40% canopy; 3,07,120 sq km |
| Max forest cover (area) | Madhya Pradesh > Arunachal Pradesh > Chhattisgarh |
| Max forest cover (% wise) | Mizoram (84.53%) among states; Lakshadweep (90.33%) among UTs |
| Max forest cover increase | Andhra Pradesh > Telangana > Odisha |
| Bamboo area | 1,49,443 sq km (declined) |
| Carbon stock | 7,204 million tonnes (+79.4 MT over previous assessment) |
| NDC target | 2.5–3.0 billion tonnes CO₂ equivalent carbon sink by 2030 |
| Mangrove cover | 4,992 sq km; Sundarbans is largest |
| National Forest Policy target | 33% of total geographical area |
TIP
Section complete: This concludes Section 1 — Forestry Foundations. You have covered forest definitions, classification, forestry as a discipline, silviculture, tree species, social forestry, mensuration, legislation, and ISFR data. These form the foundation for the agroforestry and applied forestry sections ahead.
Knowledge Check
Take a dynamically generated quiz based on the material you just read to test your understanding and get personalized feedback.
Lesson Doubts
Ask questions, get expert answers