🧖🏼 Movement of Water — Diffusion, Osmosis, and Absorption
Diffusion, osmosis, osmotic pressure, water potential, DPD, imbibition, plasmolysis, active vs passive absorption, ascent of sap theories, and transpiration with comparison tables and exam tips
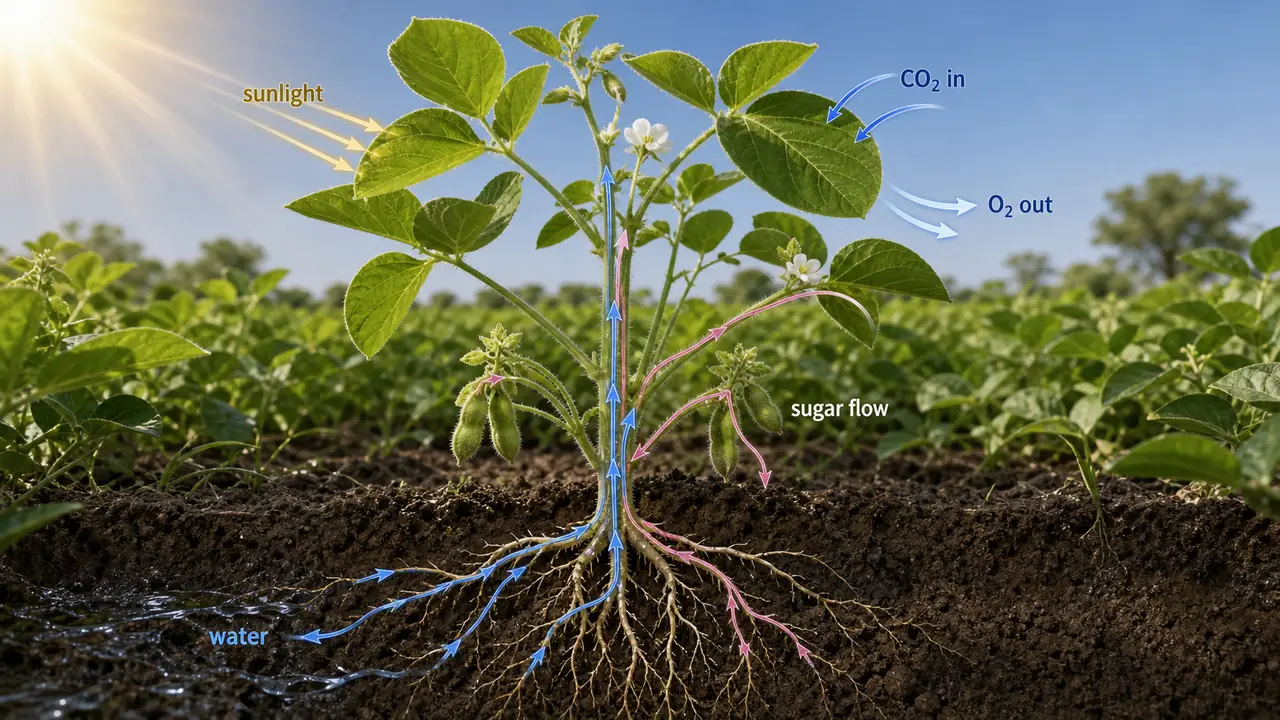
From Field to Lab — Water's Journey Through the Plant
In the previous lesson, we identified the three key questions of water relations: how water enters the plant, how it moves upward, and how it is lost. This lesson answers all three in detail.
Stand in a sugarcane field on a hot May afternoon. The roots are pulling water from soil two metres deep. That water travels upward through the stem — sometimes 5–6 metres tall — against gravity, and finally escapes as invisible vapour from the leaves. A single maize plant can transpire 200 litres of water during its growing season. How does water enter the roots? How does it defy gravity? How is it lost from the leaves? The answers lie in three interconnected processes: diffusion, osmosis, and transpiration.
This lesson covers:
- Diffusion — the basic principle of molecular movement
- Osmosis — water movement through semi-permeable membranes
- DPD and Water Potential — the equations that predict water flow direction
- Imbibition and Plasmolysis — practical consequences of osmotic forces
- Absorption of Water — active vs passive, root hairs, and measurement instruments
- Ascent of Sap — theories explaining upward water movement
- Transpiration — water loss from living aerial parts
All topics are high-yield for exams, NABARD, and FCI exams.
Diffusion
Diffusion is the simplest form of molecular transport and the foundation on which osmosis is built. Before understanding how water crosses membranes, we must understand how molecules move in free space.
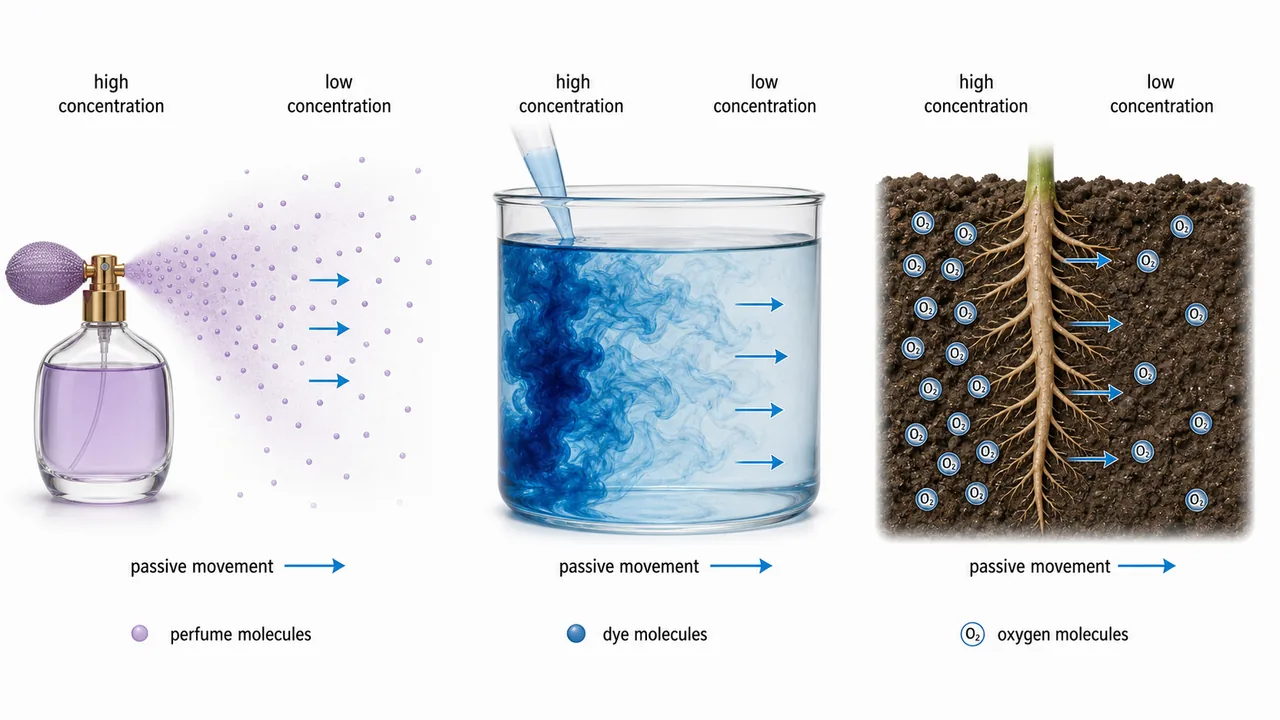
The movement of molecules of gases, liquids, or solutes from regions of higher concentration to regions of lower concentration until evenly distributed is called Diffusion. This is a passive process requiring no energy input.
- Gases diffuse faster than liquids because gas molecules have more kinetic energy and greater intermolecular spacing
TIP
Types of diffusion by state of matter:
- Liquid into Gas = Cloud
- Gas into Liquid = Foam
- Solid into Gas = Smoke
Osmosis
Diffusion describes free movement in open space, but plant cells are enclosed by membranes. When a membrane is present, a special form of diffusion occurs — osmosis — which is the primary mechanism by which roots absorb water from soil.
Osmosis is the diffusion of solvent (water) through a semi-permeable membrane from a region of lower solute concentration to a region of higher solute concentration.
- The term 'Osmosis' was given by Abbe Nollel
- Example: Plant roots absorb water from soil by osmosis
| Movement of solvent (Standard Definition) | Movement of solute | |
|---|---|---|
| From | A region of lower concentration of solution | A region of higher concentration of solution |
| To | A region of higher concentration of solution | A region of lower concentration of solution |
| Through | Semi-permeable membrane (SPM) | Semi-permeable membrane (SPM) |
Key Membrane Types
| Membrane Type | What Passes Through | Example |
|---|---|---|
| Semi-permeable | Solvent only (not solutes) | Plasma membrane |
| Selectively permeable | Some particles pass, others do not | Lipo-protein cell membrane |
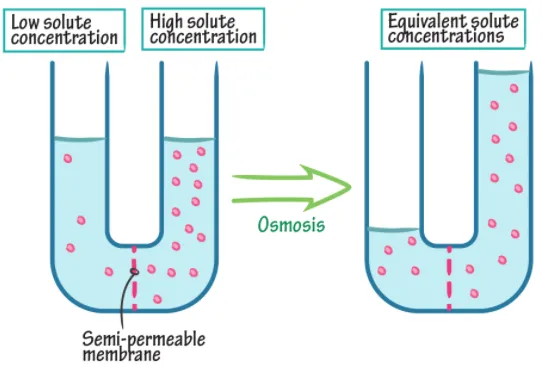
When the barrier between two solutions of different concentration is a semi-permeable membrane, water flows from the lower concentration to the higher concentration side. This continues until equilibrium is reached or until pressure counterbalances the osmotic drive.
- Plasma or cell membrane is a semi-permeable membrane. At higher temperature, it becomes permeable (which can damage cells)
- In living cells, water movement across membranes is further facilitated by aquaporins — integral membrane proteins that act as selective water channels and help regulate rapid water transport into and out of cells.
Osmotic Pressure and Osmotic Potential
To quantify how strongly a solution "pulls" water through a membrane, plant physiologists use two related but sign-opposite measures: osmotic pressure (positive convention) and osmotic potential (negative convention). Modern textbooks prefer osmotic potential, but both appear in exams.
| Concept | Definition | Value |
|---|---|---|
| Osmotic Pressure (O.P.) | Pressure required to prevent osmotic entry of water | Positive |
| Osmotic Potential (ψs) | Decrease in water potential due to solute addition | Negative |
- O.P. of pure water is zero
- Osmotic Potential is the modern term preferred over Osmotic Pressure
- Adding solutes makes osmotic potential more negative
- 1 atm = 1.01 bars (or 1 bar = 0.987 atm)
IMPORTANT
Osmotic Pressure and Osmotic Potential are numerically equal but opposite in sign. O.P. = positive; Osmotic Potential = negative.
Diffusion Pressure Deficit (DPD) / Water Potential
Understanding osmotic pressure tells us about a solution in isolation, but inside a plant cell there is also turgor pressure pushing outward against the cell wall. DPD and water potential combine both forces into a single value that predicts the direction of water movement — this is the most exam-critical equation in plant physiology.
DPD (also called Suction Pressure) is the ability of a cell to draw water. It is the force by which water enters a cell.
- DPD was introduced by Meyer in 1938
- Water potential concept was formulated by Otto Renner in 1915
The Master Equation
IMPORTANT
DPD = OP − TP (also written as WP = ψs + ψp)
This equation is the foundation of all water movement problems in exams.
| Term | Full Name | What It Represents | Sign |
|---|---|---|---|
| DPD | Diffusion Pressure Deficit | Ability to absorb water | Positive |
| WP (ψw) | Water Potential | Free energy of water | Negative |
| OP (ψs) | Osmotic Potential | Effect of solutes | Negative |
| TP / PP (ψp) | Turgor / Pressure Potential | Outward pressure on cell wall | Positive |
| ψm | Matric Potential | Water binding to matrix | Negative (usually negligible) |
Key facts:
- When a cell is fully turgid, DPD = zero (turgor pressure equals osmotic pressure)
- Water potential is always negative; maximum value is zero (pure water)
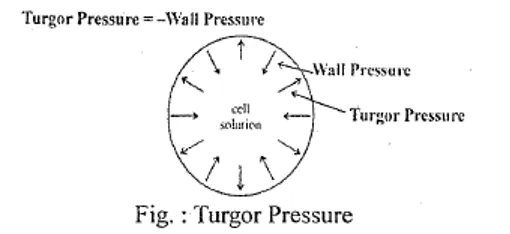
- Turgor Pressure (T.P.) is the outward pressure exerted by cell solution on the cell wall
- Equal and opposite inward pressure by cell wall = Wall Pressure (Hydrostatic Pressure)
Water Potential Equation
IMPORTANT
ψw = ψs + ψp + ψm
Since ψm is negligible: ψw = ψs + ψp (or WP = OP + PP)
-
The underlying water-potential concept is classically linked with Otto Renner (1915), while the term water potential itself is commonly associated in exam-oriented plant physiology with Slatyer and Taylor (1960).
-
In whole-plant and soil-profile discussions, textbooks may expand this to ψw = ψs + ψp + ψm + ψg, where ψg is gravitational potential
-
Gravitational potential (ψg) becomes important mainly in tall trees or when comparing water movement across large vertical distances; at the cellular level it is usually negligible
-
Common water-potential measurement recalls from plant-physiology exams include:
- Thermocouple psychrometer
- Pressure chamber / Pressure bomb (the classical Scholander type apparatus)
Direction of Water Movement
Water always moves:
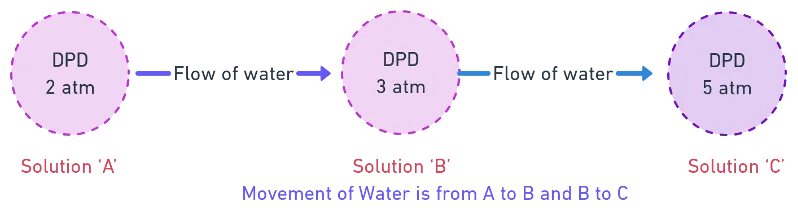
- From higher water potential to lower water potential
- From lower concentration to higher concentration of solution
- From lower DPD to higher DPD
TIP
Quick Rule: Water flows from less negative water potential to more negative water potential. In DPD terms: from lower DPD to higher DPD.
Solved Example
Question: Cell A has O.P. = 10 atm, TP = 4 atm. Surrounding cell B has O.P. = 18 atm, TP = 6 atm. Which way does water move?
Solution:
- Cell A: WP = −10 + 4 = −6 atm (DPD = 10 − 4 = 6)
- Cell B: WP = −18 + 6 = −12 atm (DPD = 18 − 6 = 12)
Water moves from A → B (higher WP to lower WP, or lower DPD to higher DPD). Answer: (a)
Endo-osmosis, Exo-osmosis, and Tonicity
The DPD equation tells us the magnitude of water movement, but the direction depends on the relative concentration of the surrounding solution. When a cell is placed in solutions of different strengths, three distinct outcomes are possible — each with direct agricultural consequences.
| Process | Direction | Solution Type | Cell Becomes | Example |
|---|---|---|---|---|
| Endo-osmosis | Water enters cell | Hypotonic (weak) | Turgid (deplasmolysis) | Raisins swell in water |
| Exo-osmosis | Water leaves cell | Hypertonic (strong) | Flaccid (plasmolysis) | Raisins shrink in salt |
| No net movement | — | Isotonic (equal) | Unchanged | Eye drops are isotonic |
- When T.P. increases, the corresponding DPD decreases (inverse relationship)
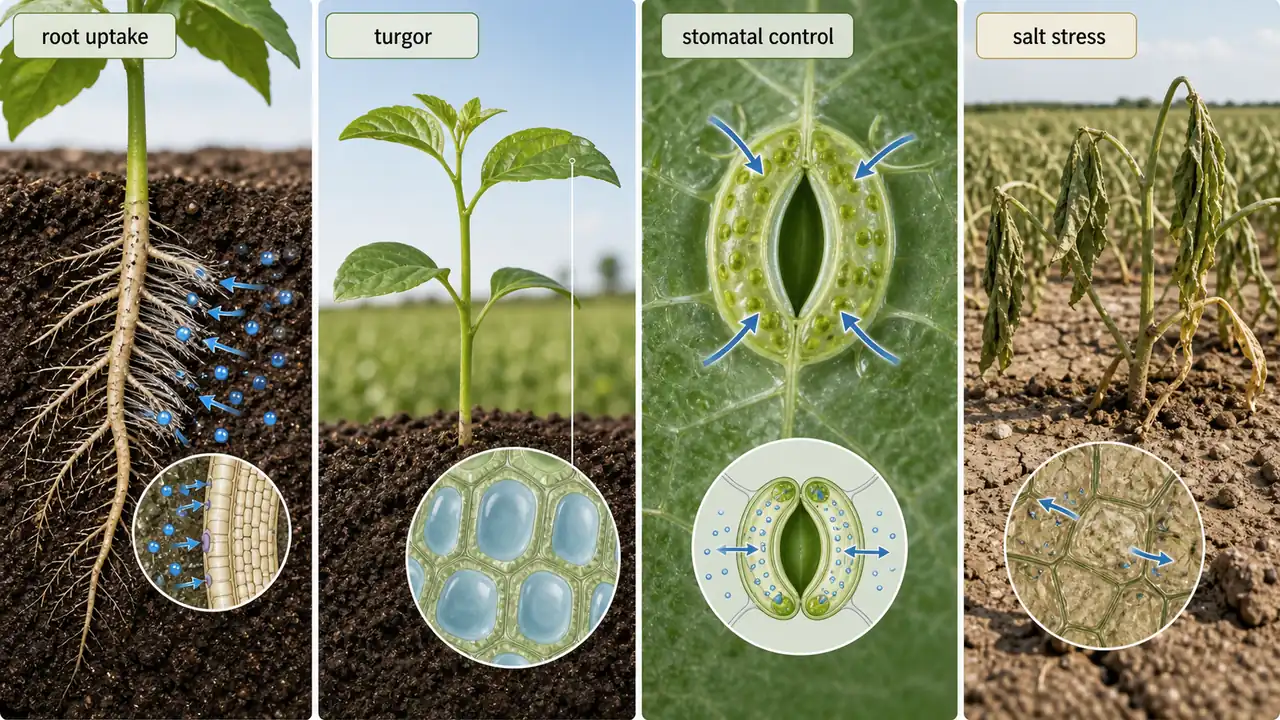
Role of Osmosis in Agriculture
Osmosis is not just a laboratory concept — it directly governs how crops absorb water, maintain structural support, and resist environmental stress. The table below maps each osmotic process to its real-world agricultural impact.
| Role | Agricultural Example |
|---|---|
| Water absorption from soil | Roots absorb water through root hairs by osmosis |
| Cell-to-cell water distribution | Water moves along osmotic gradient between cells |
| Maintaining turgidity | Leaves, flowers, and stem tips need turgor for form |
| Guard cell function | Turgor controls stomatal opening/closing |
| Cell growth | Cell expansion during growth is driven by water uptake |
| Frost/drought resistance | High osmotic concentration protects against freezing and desiccation |
| Root pressure | Turgor in root xylem helps push water upward |
Factors Affecting Osmotic Pressure
Several environmental and chemical factors modify osmotic pressure, which in turn affects how readily plant cells can absorb or lose water. Understanding these factors explains practical phenomena like salt stress and frost tolerance.
| Factor | Effect |
|---|---|
| Solute concentration | More solute → higher O.P. |
| Ionisation | Ionised solutes (NaCl → Na⁺ + Cl⁻) double the particles → higher O.P. |
| Hydration | Hydrated solutes reduce effective solvent → higher O.P. |
| Temperature | Higher temperature → higher O.P. |
Imbibition
Before osmosis can begin, dry plant tissues must first absorb water by a simpler physical process — imbibition. This is especially important during seed germination, where it is the very first step in water uptake.
- The term 'imbibition' was coined by Sachs
- Soaking up of water by dry substances due to hydrophilic colloids is called Imbibition
- It is the first step in water absorption (before osmosis can occur)
- Rate of imbibition increases with temperature
- Imbibition in oily seeds is more than in starchy seeds (oily seeds have more protein, a stronger imbibant)

- Imbibition pressure = Matric Potential (ψm)
- Matric potential is maximum (most negative) in dry material
- Seeds rich in colloidal materials are excellent imbibants — they can exert enough pressure to crack rocks
Plasmolysis
Plasmolysis is the visible, damaging consequence of exo-osmosis — and one of the most frequently tested concepts in plant physiology. It also explains the agricultural disaster of fertiliser burn.
Plasmolysis is the shrinkage of protoplasm due to outward flow of water in a hypertonic solution.
- The point where plasmolysis just starts = Incipient plasmolysis (turgor pressure drops to zero)
- Reverse process = Deplasmolysis (cell placed in hypotonic solution regains shape)
WARNING
Excessive fertiliser kills plants by plasmolysis — high salt concentration in soil creates a hypertonic environment, causing exo-osmosis from root cells. This is commonly called fertiliser burn.
Practical examples:
- Raisins swell in water = imbibition + endo-osmosis
- Excess fertiliser kills plants = plasmolysis (exo-osmosis)
- Salted pickle preserves food = plasmolysis kills bacteria
Absorption of Water
With the principles of osmosis, DPD, and imbibition established, we can now answer the first key question of water relations: how does water enter the plant? The answer centres on root hairs and the osmotic gradient between soil solution and root cells.
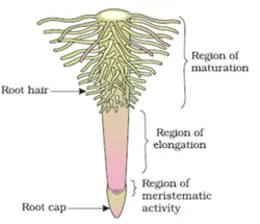
- Water is absorbed by root hairs (tubular extensions of epidermal cells)
- Root hairs are more developed in xerophytes and absent in hydrophytes
- First step in absorption = imbibition
- Maximum water absorption occurs in the zone of root hairs (1–10 cm behind root tip)
- Maximum inorganic salt absorption occurs through the zone of cell division
Soil Moisture Extraction Pattern by Roots
Older agronomy-style exam books often summarise water uptake from the root zone in a fixed extraction pattern:
| Root-zone quarter | Usual share of extracted soil moisture |
|---|---|
| Upper quarter | 40% |
| Second quarter | 30% |
| Third quarter | 20% |
| Bottom quarter | 10% |
-
This pattern is a rule-of-thumb for exam recall, not an absolute law for every crop-soil situation
-
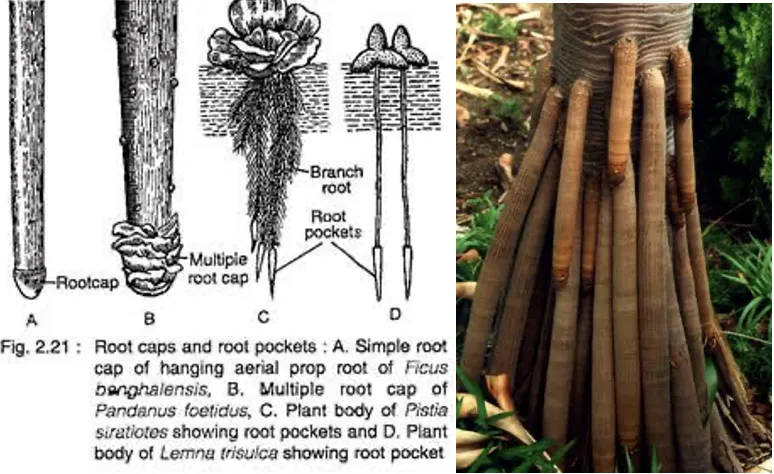
Root cap is formed by calyptrogen; multiple root cap found in Pandanus (Screw pine)
-
Roots of hydrophytes contain root pockets instead of root cap
Active vs Passive Absorption
Renner (1912, 1915) first classified water uptake into active and passive absorption.
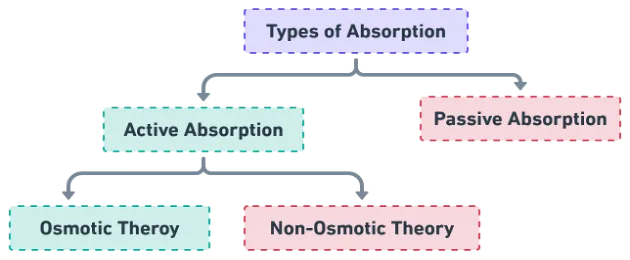
| Active absorption | Passive absorption |
|---|---|
| Occurs against conc. gradient. | Along conc. gradient. |
| Metabolic energy (i.e. ATP) is required. | Spontaneous |
| Involves primary active transport using ATP and secondary active transport using proton motive force. | No |
| Always selective uptake. E.g. ion uptake (NO₃⁻) | Non-selective. E.g. water |
| Feature | Active Absorption | Passive Absorption |
|---|---|---|
| Role of root hairs | Active role | Passive role |
| Energy | Metabolic energy consumed | No energy required |
| Driving force | Osmotic gradient (DPD of root hairs) | Transpiration pull |
| Concentration gradient | Against gradient | Along gradient |
| Occurs in | Slowly transpiring plants | Rapidly transpiring plants |
| Highest DPD | Root hairs | Leaf cells |
| Theories | Osmotic (Atkins), Non-osmotic | Dixon & Jolly (Transpiration Pull) |
- Older exam books often summarise the practical contribution as:
- Active absorption = roughly 10% of total water uptake
- Passive absorption = roughly 90% of total water uptake under normal transpiring conditions
- A classic one-liner is that the governing force of active absorption originates mainly in the root, whereas the governing force of passive absorption originates in the shoot.
- In older plant-physiology exam keys, the osmotic theory of active water absorption is commonly linked with Atkins (1916) and Priestley (1920–22).
- The corresponding non-osmotic theory of active absorption is often keyed with Thimann & Kramer in older objective-question books.
TIP
Exam shortcut: In most plants under normal conditions, passive absorption (driven by transpiration pull) accounts for the majority of water uptake. Active absorption is significant only in slowly transpiring plants.
Apoplast and Symplast
- In plant water movement, the terms apoplast and symplast are classical transport-pathway recall points.
- Older exam books often link the formal use of the terms apoplast and symplast with Munch.
| Pathway | Route |
|---|---|
| Apoplast | Movement through cell walls and intercellular spaces without crossing cell membranes |
| Symplast | Movement from one cell to another through the cytoplasmic continuum via plasmodesmata |
- These terms are especially useful when revising how water and solutes move through root tissues before entering the xylem.
T/A Experiment (Transpiration/Absorption Ratio)
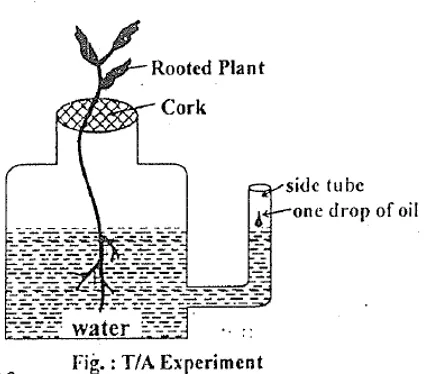
Under normal conditions, T/A ratio = 1 (water lost = water absorbed), maintaining the plant's water balance.
Instruments for Measuring Plant Water Relations
| Instrument | What It Measures | Key Detail |
|---|---|---|
| Potometer | Transpiration rate (water loss from leaves) | Measures water uptake as proxy for transpiration |
| Porometer (Knight's) | Stomatal behaviour — opening/closing | Measures resistance to airflow through leaf |
| Osmometer | Osmotic pressure of solutions | Used to study osmosis and cell sap concentration |
| Manometer | Root pressure | Measures upward pressure exerted by roots |
Factors Affecting Water Absorption
| Factor | Effect |
|---|---|
| Available soil water | Uniform absorption between field capacity and wilting point; below wilting point, absorption drops sharply |
| Soil solution concentration | High salinity = physiological dryness (water present but plant cannot absorb) |
| Soil aeration | Well-aerated soils → rapid absorption; waterlogging = physiological dryness |
Ascent of Sap
Once water enters the root, it must travel upward — sometimes tens of metres in tall trees — against gravity. This section addresses the second key question of water relations: how does water move up inside the plant? Multiple theories have been proposed, but only one stands accepted today.
Ascent of sap = movement of water and inorganic solutes from root to leaves through xylem vessels against gravity.
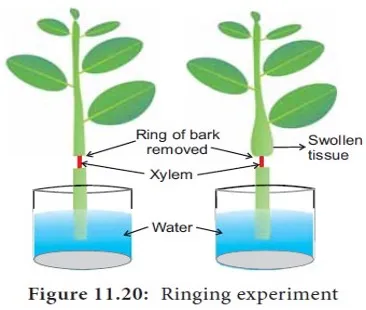
- Malpighi's ringing/girdling experiment confirmed sap ascends through xylem
- Competitive-exam histories sometimes note that the classical ringing/girdling experiment is associated with both Malpighi (1672) and a later restatement by Hartig (1837).
- Mass Flow / Pressure Flow theory for food movement was given by Munch
Ascent of Sap Theories — Complete Comparison
| Theory | Proposed by | Status | Why Rejected/Accepted |
|---|---|---|---|
| Relay Pump Theory | Godlewski (1884) | Rejected | Strasburger proved sap moves even after killing living cells |
| Pulsation Theory | J.C. Bose (1923) | Rejected | Benedict showed actual sap velocity 8,000–30,000x faster than theory predicts |
| Root Pressure Theory | Priestly | Insufficient | Cannot drive water to 400 ft in tall trees |
| Atmospheric Pressure | Boehm (1809) | Insufficient | Only 34 ft maximum |
| Imbibition Theory | Sachs (1878) | Not accepted | — |
| Capillary Force | — | Insufficient | Only 4 ft maximum |
| Transpiration Pull & Cohesion | Dixon & Jolly (1894) | Most widely accepted | Three features: cohesion, continuity, transpiration pull |

IMPORTANT
Dixon & Jolly's Transpiration Pull and Cohesion Theory is the most accepted explanation. Three key features:
- Strong cohesive force of water molecules (hydrogen bonds)
- Continuity of water column (must remain unbroken)
- Transpiration pull creates tension that pulls water upward
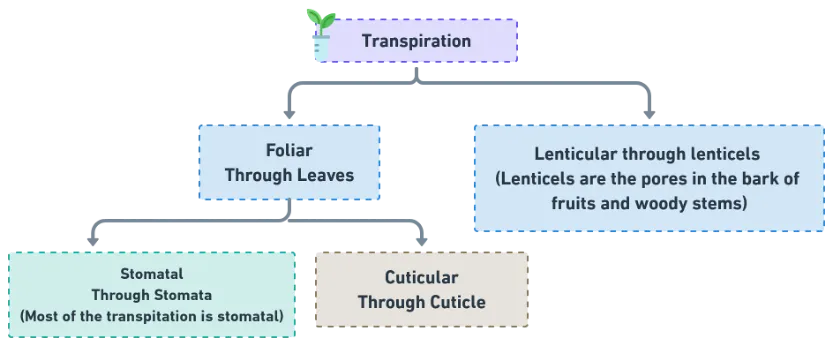
Transpiration
The third and final key question of water relations: how is water lost from the plant? Transpiration is the driving force behind the entire upward water column — without it, the cohesion-tension mechanism would have nothing to pull against.
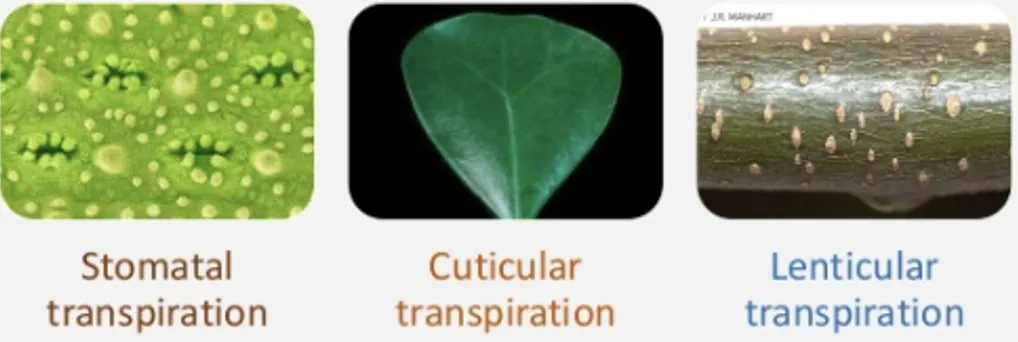
The loss of water in vapour form from living aerial parts of the plant is called transpiration.
- Principal organ of transpiration = leaf
- Stomatal transpiration accounts for 80–90% of total water loss
Transpiration vs Evaporation
| Transpiration | Evaporation |
|---|---|
| It is a vital and physiological phenomenon. | It is simply a physical phenomenon. |
| Water loss occurs in the form of vapour from living cells. | It occurs in the form of vapour from non-living surfaces. |
| It is regulated by guard cells. | There is no such regulation. |
| It prevents dryness of the cell surface. | Evaporation results in dryness. |
| Several mechanisms and driving forces are involved. | No such biological mechanisms or forces are involved. |
Factors increasing transpiration: Hot, dry, windy days — high temperature increases evaporation, low humidity increases vapour pressure gradient, wind removes the humid boundary layer near leaves.
Summary Cheat Sheet
| Fact | Answer |
|---|---|
| Term 'Osmosis' given by | Abbe Nollel |
| O.P. of pure water | Zero |
| DPD formula | DPD = OP − TP |
| Water potential formula | ψw = ψs + ψp |
| DPD introduced by | Meyer (1938) |
| Water potential by | Otto Renner (1915) |
| DPD of fully turgid cell | Zero |
| Water potential maximum | Zero (pure water) |
| Water flows from | Higher WP → Lower WP (Lower DPD → Higher DPD) |
| Imbibition coined by | Sachs |
| Oily vs starchy seed imbibition | Oily seed imbibes more |
| Plasmolysis = | Shrinkage in hypertonic solution |
| Deplasmolysis = | Recovery in hypotonic solution |
| Root hairs absent in | Hydrophytes |
| Active vs passive absorption | Renner (1912, 1915) |
| Major water uptake under normal conditions | Passive absorption (driven mainly by transpiration pull) |
| Apoplast pathway | Through cell walls and intercellular spaces |
| Symplast pathway | Through cytoplasm via plasmodesmata |
| Most accepted ascent of sap theory | Dixon & Jolly (1894) — Transpiration Pull |
| Stomatal transpiration | 80–90% of total |
| Ringing experiment | Malpighi — confirmed xylem transport |
| Mass flow theory | Munch |
| Root pressure term coined by | Stephan Hales |
| Potometer measures | Transpiration rate |
| Porometer measures | Stomatal opening |
| Osmometer measures | Osmotic pressure |
| Manometer measures | Root pressure |
| Physiological dryness | High salinity or waterlogging prevents absorption |
TIP
Next: Lesson 03 covers Stomata — the gatekeepers that control transpiration, their structure, classification, and the K⁺ transport mechanism of opening and closing.