🔬 Soil Testing: Methods, Sampling & Permanent Manurial Experiments
Complete guide to soil testing procedures, fertility grouping, soil sampling techniques, chemical extractants, and long-term fertilizer experiments for competitive exams
Why Soil Testing Matters: A Farmer's Perspective
A paddy farmer in Tamil Nadu applies the same 120-60-40 kg NPK/ha dose every season because "that is what everyone does." After soil testing, he discovers his soil has high K but critically low P and Zn. By adjusting his fertilizer strategy, he reduces cost by 20% and increases yield by 15%. This is the power of soil testing — replacing guesswork with science.
What is Soil Testing?
- Soil testing is defined as a 'programme for procedural evaluation of soil fertility by rapid chemical analysis, particularly to assess the available nutrient status and reaction of a soil'
- A soil test is a chemical method for estimating the nutrient-supplying power of a soil
- The primary advantage over plant analysis: soil testing determines nutrient status before the crop is planted, allowing proactive fertilizer planning
- The result of a soil test is called a soil test value — it measures only a part of total nutrient supply and serves as an index of nutrient availability, not an exact measurement
Objectives of Soil Testing
| Objective | What It Means for the Farmer |
|---|---|
| Provide an index of nutrient availability | Know which nutrients are low, medium, or high |
| Predict probability of profitable response to fertilizer | Will applying fertilizer actually pay off? |
| Provide a basis for fertilizer recommendation | How much of which fertilizer to apply |
| Evaluate soil fertility status across regions | State-level soil fertility mapping |
Four Phases of Soil Testing
The soil testing programme follows a systematic sequence from field to recommendation.
Pro Content Locked
Upgrade to Pro to access this lesson and all other premium content.
₹99 charged monthly · Cancel anytime
- All Agriculture & Banking Courses
- AI Lesson Questions (100/day)
- AI Doubt Solver (50/day)
- Glows & Grows Feedback (30/day)
- AI Section Quiz (20/day)
- 22-Language Translation (100/day)
- Recall Questions (20/day)
- AI Quiz (15/day)
- AI Quiz Paper Analysis (100/day)
- AI Step-by-Step Explanations (100/day)
- Spaced Repetition Recall (FSRS)
- AI Tutor
- Immersive Text Questions
- Audio Lessons — Hindi & English
- Mock Tests & Previous Year Papers
- Summary & Mind Maps
- XP, Levels, Leaderboard & Badges
- Generate New Classrooms
- Voice AI Teacher (AgriDots Live)
- AI Revision Assistant
- Knowledge Gap Analysis
- Interactive Revision (LangGraph)
🔒 Secure via Razorpay · Cancel anytime · No hidden fees
Why Soil Testing Matters: A Farmer's Perspective
A paddy farmer in Tamil Nadu applies the same 120-60-40 kg NPK/ha dose every season because "that is what everyone does." After soil testing, he discovers his soil has high K but critically low P and Zn. By adjusting his fertilizer strategy, he reduces cost by 20% and increases yield by 15%. This is the power of soil testing — replacing guesswork with science.
What is Soil Testing?
- Soil testing is defined as a 'programme for procedural evaluation of soil fertility by rapid chemical analysis, particularly to assess the available nutrient status and reaction of a soil'
- A soil test is a chemical method for estimating the nutrient-supplying power of a soil
- The primary advantage over plant analysis: soil testing determines nutrient status before the crop is planted, allowing proactive fertilizer planning
- The result of a soil test is called a soil test value — it measures only a part of total nutrient supply and serves as an index of nutrient availability, not an exact measurement
Objectives of Soil Testing
| Objective | What It Means for the Farmer |
|---|---|
| Provide an index of nutrient availability | Know which nutrients are low, medium, or high |
| Predict probability of profitable response to fertilizer | Will applying fertilizer actually pay off? |
| Provide a basis for fertilizer recommendation | How much of which fertilizer to apply |
| Evaluate soil fertility status across regions | State-level soil fertility mapping |
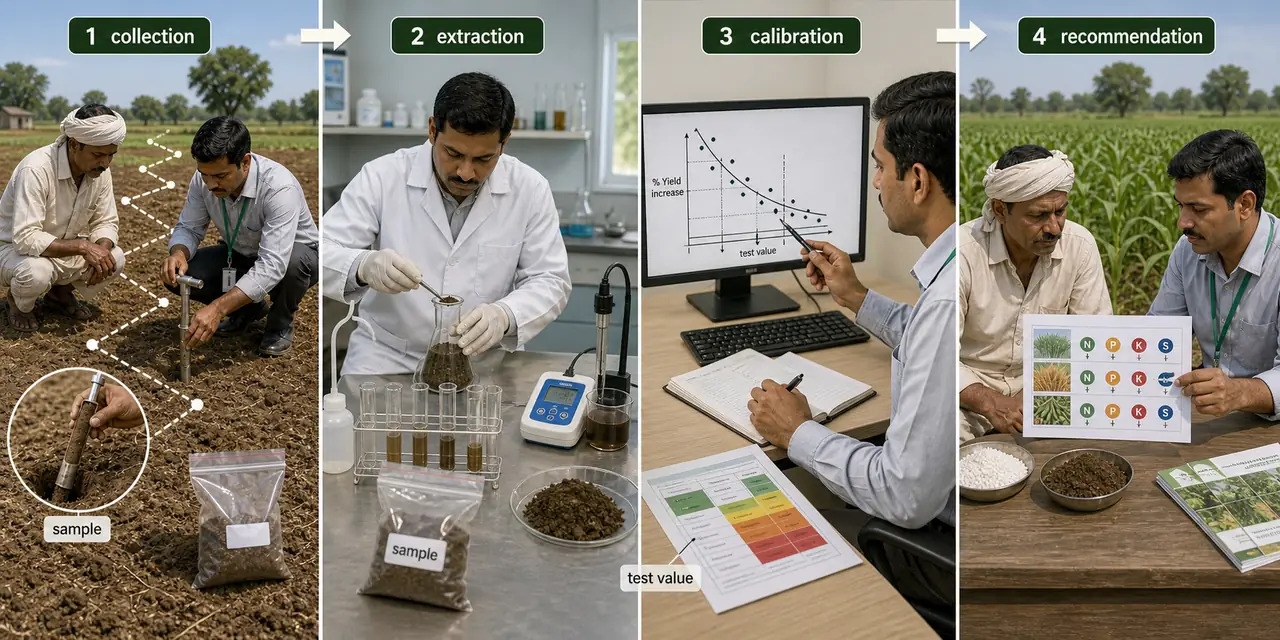
Four Phases of Soil Testing
The soil testing programme follows a systematic sequence from field to recommendation.
| Phase | Activity | Key Details |
|---|---|---|
| 1. Collection | Collecting soil samples | Representative sampling from the field |
| 2. Extraction | Extracting and determining available nutrients | Using standardized chemical extractants |
| 3. Calibration | Calibrating and interpreting results | Correlating lab values with crop response data |
| 4. Recommendation | Making fertilizer recommendations | Translating test values into actionable doses |
Agricultural example: For a wheat field in Haryana — (1) collect composite sample from 15 cm depth, (2) extract available N using alkaline KMnO4, (3) if N < 280 kg/ha it is "low," (4) recommend 25% more N than the standard dose.
Soil Testing and Correlation
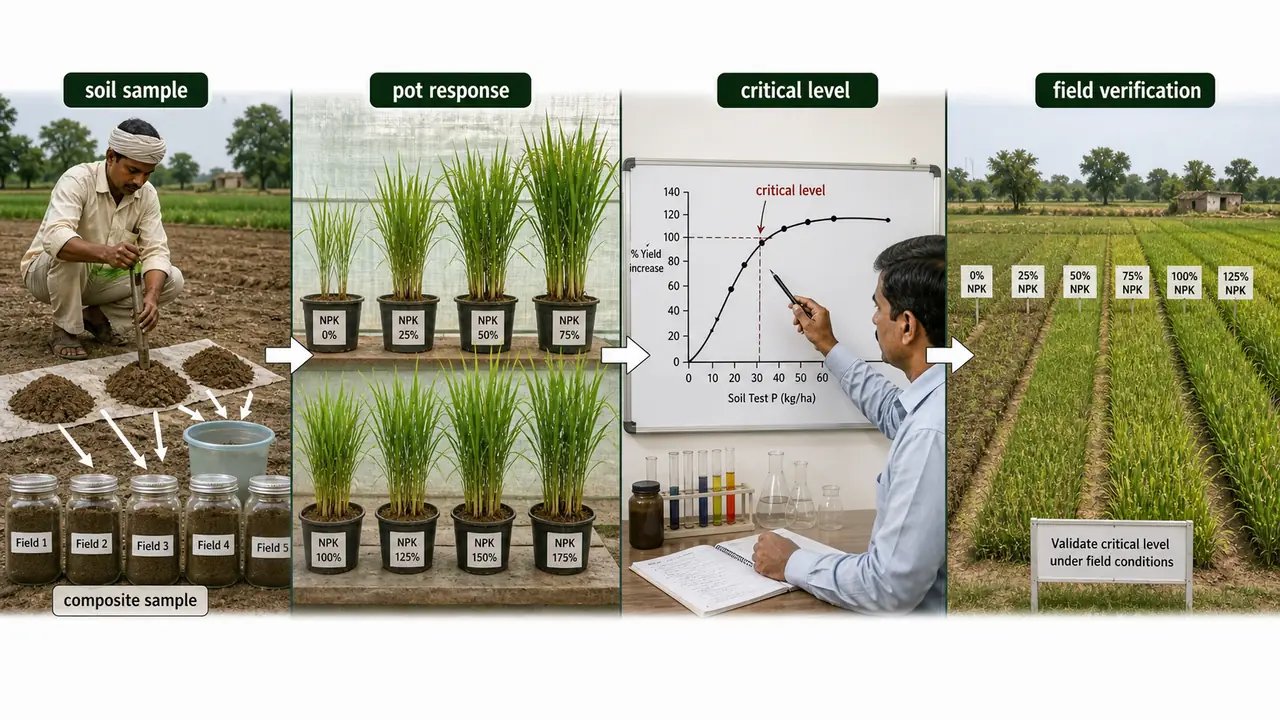
- Composite samples from fields are used in pot culture studies to assess crop responses to added fertilizers
- Fixation studies determine the soil's capacity to fix applied nutrients
- Results are interpreted to confirm deficiencies, index soil fertility, and establish the critical level for each nutrient
- Results are verified through field experiments
This multi-step process — from lab to pot to field — ensures recommendations are scientifically sound and practically applicable.
Fertility Grouping
Low-Medium-High Classification
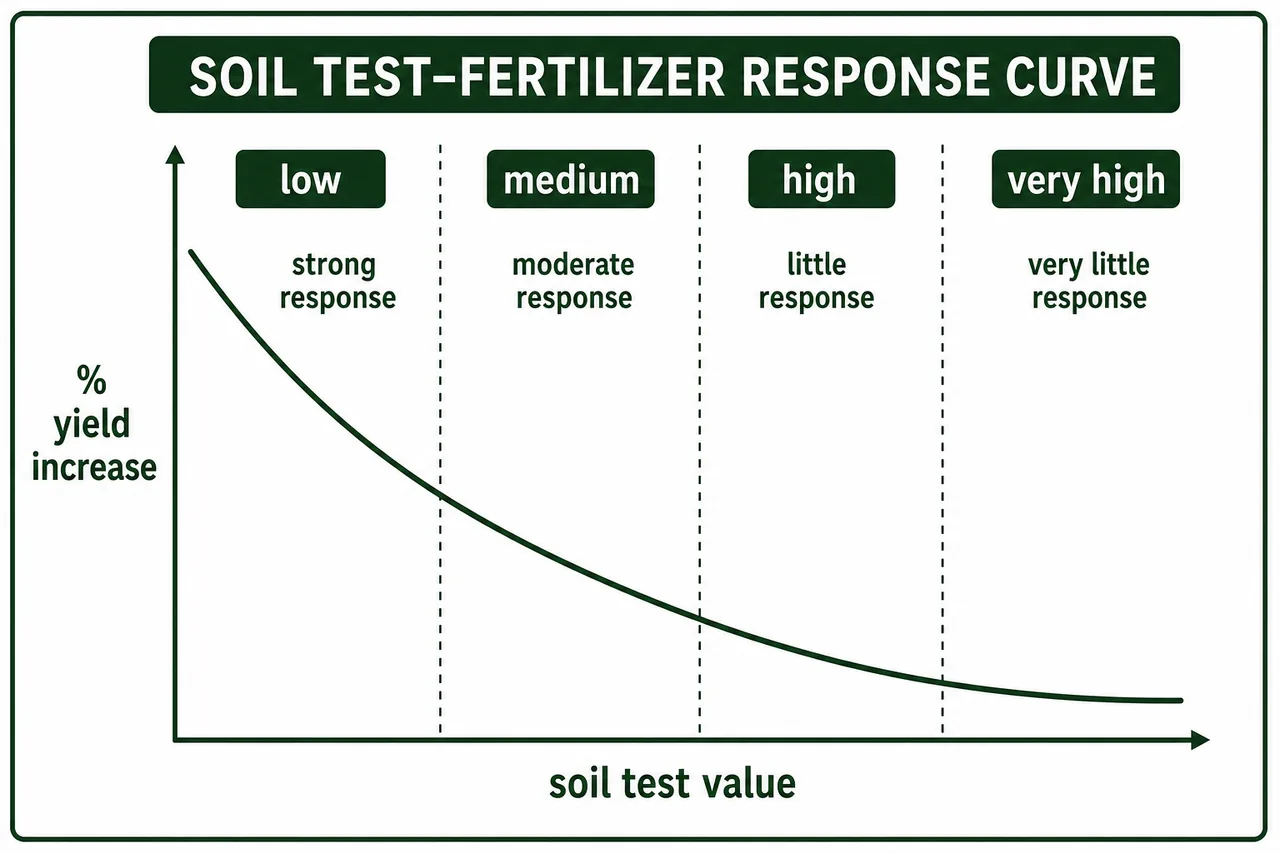
- The International Soil Fertility Evaluation and Improvement Programme (Waugh and Fitts, 1965) advocated grouping soils into low-medium-high categories
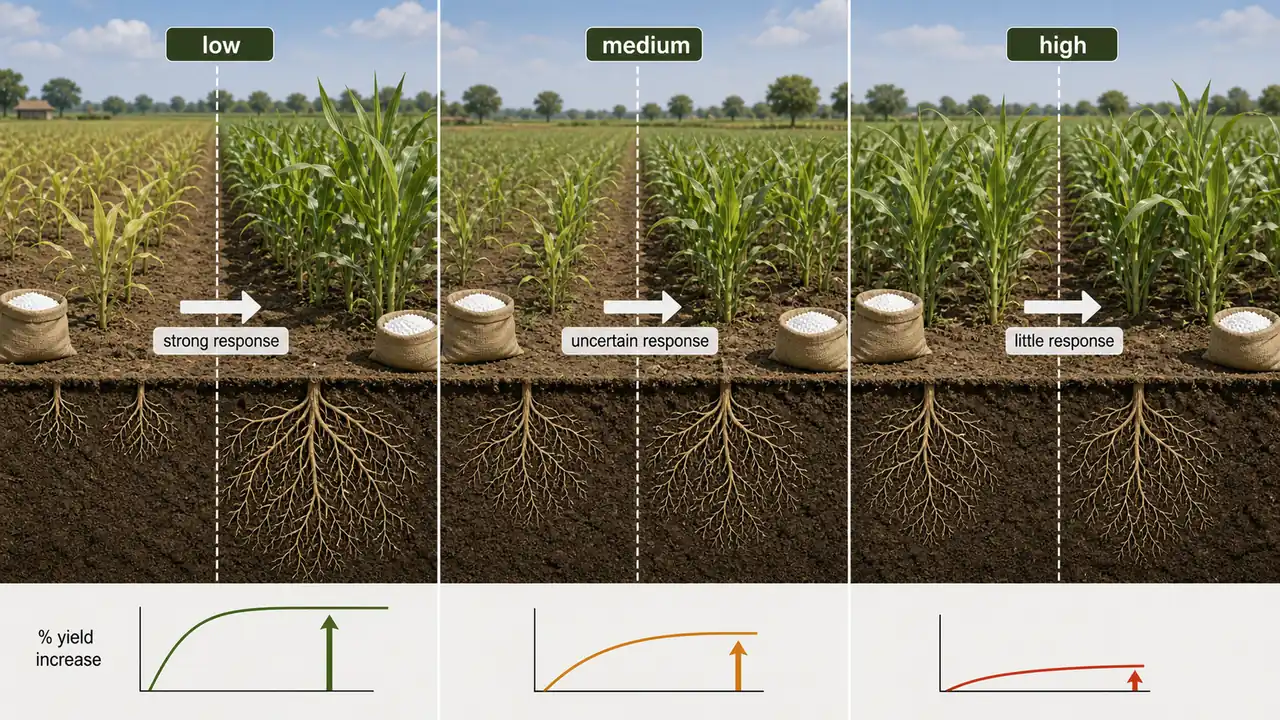
- The scatter diagram between soil test values and percent yield response is generally curvilinear — response decreases as soil test value increases (law of diminishing returns)
| Fertility Group | Expected Response to Fertilizer | Dose Adjustment |
|---|---|---|
| Low | Will markedly respond to added fertilizer | Increase recommended dose by 25% |
| Medium | Response is unpredictable | Apply the standard recommended dose |
| High | Will not significantly respond | Reduce recommended dose by 25% |
| Fertility group | KMnO₄-N | NaHCO₃-P | NH₄OAc-K |
|---|---|---|---|
| Low | <280 | <11 | <118 |
| Medium | 280-450 | 11-22 | 118-280 |
| High | >450 | >22 | >280 |
TIP
Exam Tip: This grouping is qualitative, not quantitative — it cannot tell you exactly how much fertilizer to add. For precise recommendations, use the STCR targeted yield approach.
Fertility Index
- Fertility index expresses the relative sufficiency as a percentage of soil nutrient amount adequate for optimum yields
- Probability of response to fertilizer increases with decreasing soil test level
| Soil Test Rating | Probability of Response |
|---|---|
| Very low | > 85% of soils give greater response and profit |
| Medium | 60-85% of soils give little profit |
| Very high | ~15% of soils show little response |
| Soil Test Rating | Fertility Index | Probability of Crop Response (% Yield increase) |
|---|---|---|
| Very low | 0-10 | 95-100 |
| Low | 10-25 | 70-95 |
| Medium | 25-50 | 40-70 |
| High | 50-100 | 10-40 |
| Very High | 100+ | 0-10 |
Soil Sampling: The Most Critical Step
IMPORTANT
The most critical aspect of soil testing is obtaining a representative sample. A poorly collected sample gives misleading results no matter how accurate the laboratory analysis. The sampling error is generally greater than the laboratory error.
Key Principles
| Aspect | Guidelines |
|---|---|
| Soil unit | Area represented by a composite sample |
| Number of sub-samples | 5-20 samples per acre, combined into one composite |
| Composite sample weight | 1 kg of soil |
| Depth for field crops | 15 cm |
| Depth for deep-rooted/tree crops | 1-2 m |
| Separate sampling needed | Areas varying in appearance, slope, drainage, soil type, or past treatment |
Agricultural example: In a 5-acre mango orchard with uneven terrain, sample the hilltop, midslope, and low-lying areas separately. Each zone may have drastically different nutrient levels.
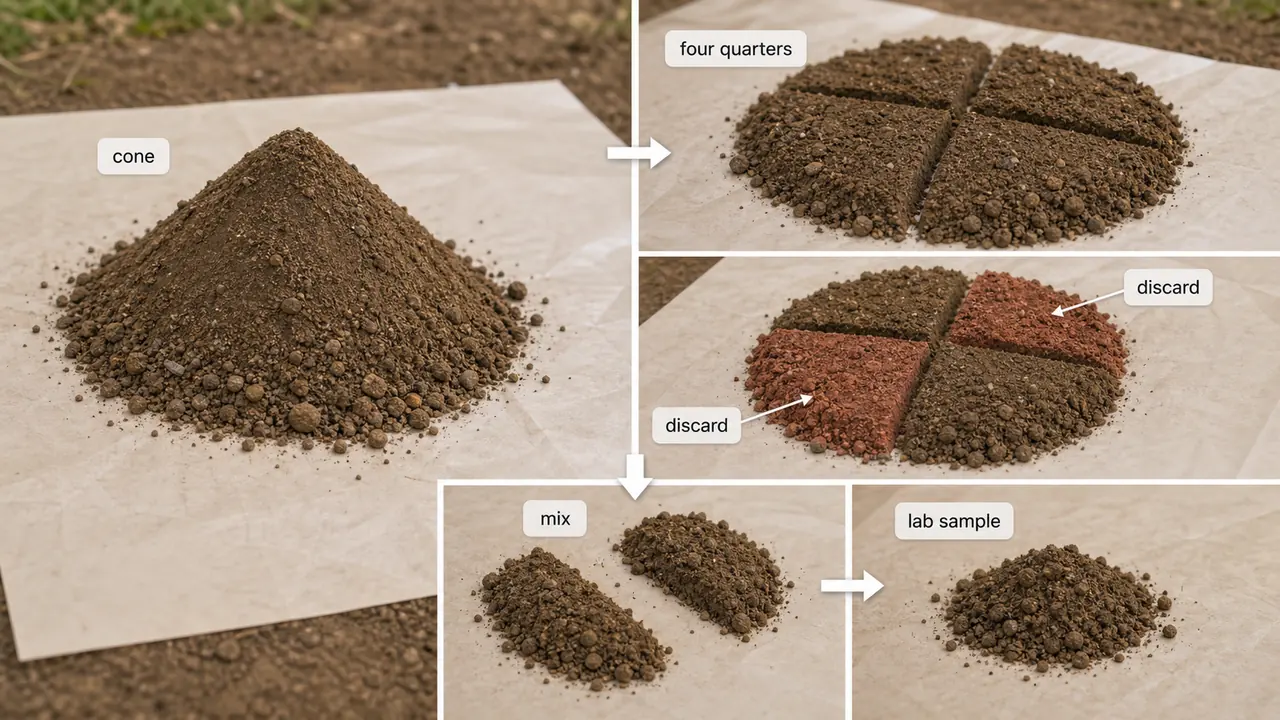
Quartering Technique for Composite Sample Preparation
- Cone the soil sample on a mixing sheet
- Flatten the cone and divide through the center with a flat wooden sheet
- Divide each half into half — creating four quarters
- Discard two diagonally opposite quarters
- Mix the remaining two by rolling
- Repeat until 250-500 g composite material is obtained
WARNING
For micronutrient analysis, use only stainless steel, plastic, or wood tools. Brass, galvanized, or painted tools can introduce trace metals and invalidate the analysis.
Chemical Extractants for Soil Testing
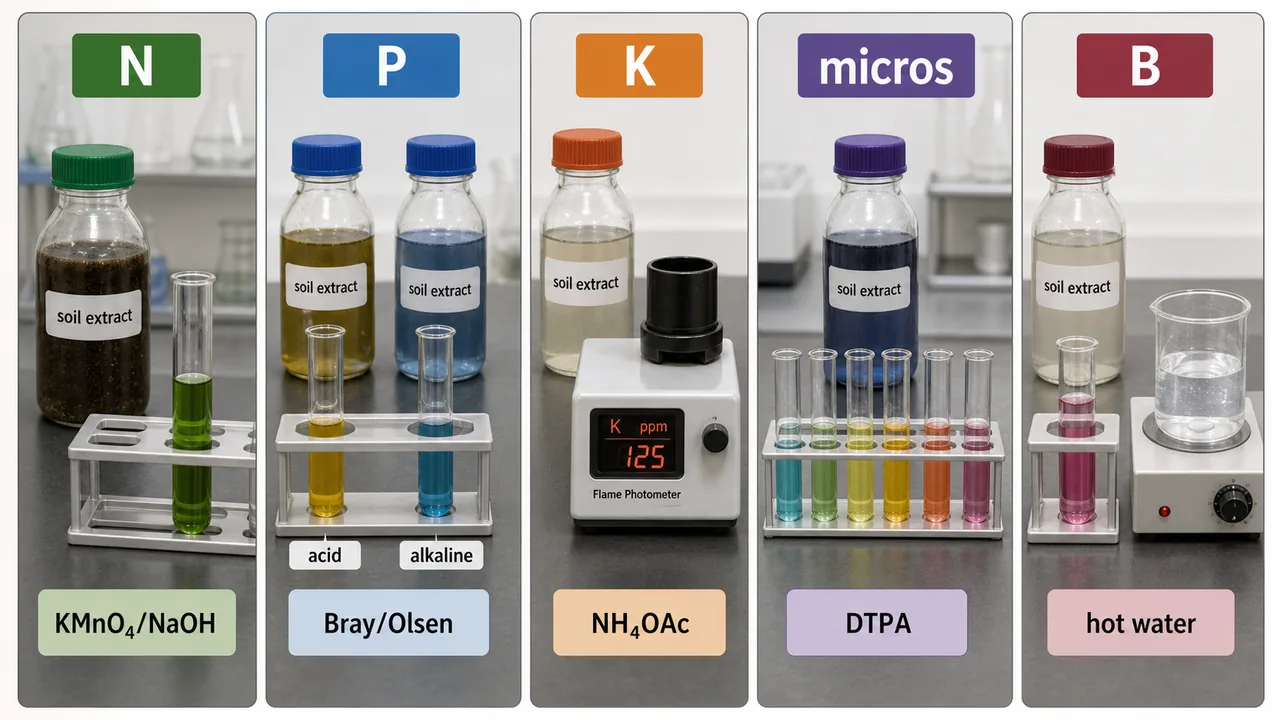
| Plant nutrient | Common Extractant | Nutrient Source Extracted |
|---|---|---|
| Available N | KMnO₄ - NaOH | Mineralizable Organic N |
| H₂PO₄⁻ / HPO₄²⁻ (Available P) | NH₄F - HCl (Bray-p); NaHCO₃ - P (Olsen-P) | Fe/Al mineral solubility; Ca mineral solubility |
| K⁺ (Available K) | NH₄OAC-K | Exchangeable |
| Ca²⁺, Mg²⁺ | EDTA | Exchangeable |
| SO₄²⁻ | CaCl₂ | Solution AEC |
| NO₃ | KCl, CaCl₂ | Solution |
| NH₄ | KCl | Solution - Exchangeable |
| Zn²⁺, Fe³⁺, Mn²⁺, Cu²⁺ | DTPA | Chelation |
| H₃BO₃ | Hot water | Solution |
| Organic C | Chromic acid | Oxidizable C |
After extraction, available nutrients are determined by colorimetric method — color intensity is proportional to nutrient concentration.
Soil Testing Laboratories
Functions of State Soil Testing Laboratories
| Function | Details |
|---|---|
| Soil analysis | Texture (feel method), lime status, EC, pH, available N, P, K; micronutrients on request |
| Irrigation water analysis | EC, pH, cations, anions; quality assessment and ameliorative measures |
| Village adoption | Each lab adopts two villages — free soil and water analysis with recommendations |
| Benchmark water mapping | Collecting and analyzing water samples from marked wells; preparing water quality maps |
| Fertility index preparation | Rating soils as low/medium/high; preparing village fertility indices |
| Site-specific trials | Conducting trials to solve local soil fertility problems |
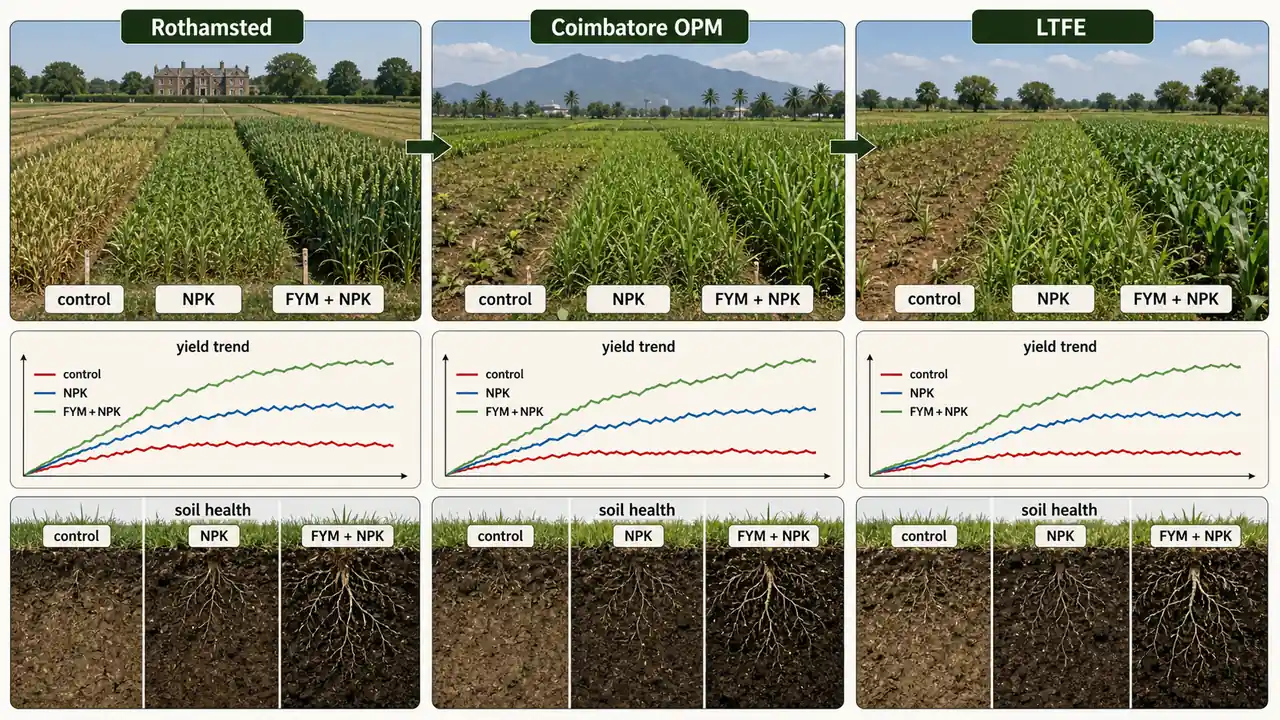
Permanent Manurial Experiments (PME)
Key PMEs in History
| Experiment | Location | Year | Key Details |
|---|---|---|---|
| Classical field experiment | Rothamsted, England | 1854 | By Lawes & Gilbert; running for 170+ years |
| Old Permanent Manurial (OPM) | Coimbatore, India | 1909 | First PME in India; red soil (Alfisol); cereal-cotton rotation; rainfed |
| New Permanent Manurial (NPM) | Coimbatore | 1925 | Same treatments as OPM but under irrigated conditions |
| Long Term Fertilizer Experiment (LTFE) | 11 centres across India | 1972 | By ICAR; Coimbatore site in medium black soil (Inceptisol); ragi-maize system |
- OPM and NPM use a uniform dose of 25-60-75 kg N, P2O5 and K2O/ha
- LTFEs were designed with modern statistical methods to study intensive cropping and manuring
Major Findings from PMEs
| Finding | Significance for Farmers |
|---|---|
| Single nutrient (N or P or K alone) gives lower yield; NP and NPK give higher yield | Balanced fertilization is essential |
| P not applied → becomes limiting → yield drops 50-60% | Never skip phosphorus |
| K depleted even with continuous application | K management is critical in intensive systems |
| Continuous N alone reduces soil productivity | N alone is destructive long-term |
| FYM + NPK increases yield by 15-20% over NPK alone | Organic + inorganic integration is the best strategy |
| FYM improves pore space, water holding capacity | Soil physical properties improve with organics |
| Microbial populations (bacteria, fungi, Actinomycetes, Azotobacter) increase with FYM | Soil biology needs organic inputs to thrive |
| Enzymes (urease, dehydrogenase, cellulase, amylase) favored by organic manure | Enzyme activity indicates soil health |
TIP
Exam Tip: Remember: "First PME in the world = Rothamsted (1854), First PME in India = Coimbatore (1909)." The key lesson from all PMEs: FYM + NPK > NPK alone.
TIP
Mnemonic for soil testing phases: "Collect, Extract, Calibrate, Recommend" — CECR (think: "Careful Exam Candidates Rank high")
References
- Tisdale, S.L., Nelson, W.L., Beaton, J.D., Havlin, J.L. 1997. Soil Fertility and Fertilizers. 5th ed. Prentice Hall of India, New Delhi.
- Singh, S.S. 1995. Soil Fertility and Nutrient Management. Kalyani Publishers, Ludhiana.
- Maliwal, G.L. and Somani, L.L. 2011. Soil Technology. Agrotech.
- IARI Toppers Soil Science Part-9 (6th Edition 2025).
Summary Cheat Sheet
| Concept / Topic | Key Details |
|---|---|
| Soil testing defined | Rapid chemical analysis to assess available nutrient status and soil reaction |
| Advantage over plant analysis | Determines nutrient status before planting (proactive) |
| 4 phases of soil testing | Collect → Extract → Calibrate → Recommend (CECR) |
| Sampling error vs lab error | Sampling error is generally greater than laboratory error |
| Sub-samples per acre | 5–20 samples combined into one composite |
| Composite sample weight | 1 kg of soil; quartered to 250–500 g |
| Sampling depth — field crops | 15 cm |
| Sampling depth — tree crops | 1–2 m |
| Quartering technique | Flatten cone → divide into 4 → discard 2 opposite → repeat |
| Micronutrient sampling tools | Only stainless steel, plastic, or wood (no brass/galvanized) |
| Fertility grouping | Waugh & Fitts (1965) — Low, Medium, High |
| Low status dose adjustment | Increase recommended dose by 25% |
| High status dose adjustment | Reduce recommended dose by 25% |
| Medium status | Apply standard recommended dose |
| Fertility index | Relative sufficiency as % of adequate nutrient amount |
| Colorimetric method | Color intensity proportional to nutrient concentration |
| First PME (World) | Rothamsted, England (1854) — Lawes & Gilbert |
| First PME (India) | Coimbatore (1909) — OPM; red soil (Alfisol); rainfed |
| NPM Coimbatore | 1925; same treatments as OPM but irrigated |
| LTFE | 1972, 11 centres across India (ICAR) |
| OPM/NPM dose | 25–60–75 kg N, P₂O₅, K₂O/ha |
| Key PME finding | FYM + NPK gives 15–20% more yield than NPK alone |
| P not applied → yield drop | 50–60% decline |
| FYM benefits | Improves pore space, WHC, increases microbial populations and enzyme activity |