🧪 Soil Fertility Evaluation: Methods, Approaches & Land Classification
Complete guide to soil fertility evaluation methods — STCR, DRIS, crop response data, biological tests, plant analysis, and Land Capability Classification for competitive exams
Why Fertility Evaluation Matters: A Farmer's Perspective
A sugarcane farmer in Uttar Pradesh wants to achieve a target yield of 100 tonnes/ha. Simply applying a blanket dose of fertilizer will not do — his soil has high K, medium N, and low P. Using the Soil Test Crop Response (STCR) targeted yield approach, the agronomist calculates the exact doses of N, P, and K needed for his specific soil and target. The result: higher yield with lower fertilizer cost. This is fertility evaluation in action.
Soil Fertility vs. Soil Productivity

| Aspect | Soil Fertility | Soil Productivity |
|---|---|---|
| Definition | Index of available nutrients to plants | Broader term indicating crop yields (kg/ha or Rs./ha) |
| Scope | One factor for crop production | Interaction of all factors (fertility + management + climate) |
| Assessment | Analysed in the laboratory | Assessed in the field under specific conditions |
| Nature | Inherent property of soil | Not an inherent property |
| Function | f (Nutrient status of soil) | f (Soil fertility + Management + Climate) |
| Climate effect | Same in all climates | Differs with climate and location |
| Key relationship | All fertile soils are not necessarily productive | All productive soils are certainly fertile |
IMPORTANT
Pro Content Locked
Upgrade to Pro to access this lesson and all other premium content.
₹99 charged monthly · Cancel anytime
- All Agriculture & Banking Courses
- AI Lesson Questions (100/day)
- AI Doubt Solver (50/day)
- Glows & Grows Feedback (30/day)
- AI Section Quiz (20/day)
- 22-Language Translation (100/day)
- Recall Questions (20/day)
- AI Quiz (15/day)
- AI Quiz Paper Analysis (100/day)
- AI Step-by-Step Explanations (100/day)
- Spaced Repetition Recall (FSRS)
- AI Tutor
- Immersive Text Questions
- Audio Lessons — Hindi & English
- Mock Tests & Previous Year Papers
- Summary & Mind Maps
- XP, Levels, Leaderboard & Badges
- Generate New Classrooms
- Voice AI Teacher (AgriDots Live)
- AI Revision Assistant
- Knowledge Gap Analysis
- Interactive Revision (LangGraph)
🔒 Secure via Razorpay · Cancel anytime · No hidden fees
Why Fertility Evaluation Matters: A Farmer's Perspective
A sugarcane farmer in Uttar Pradesh wants to achieve a target yield of 100 tonnes/ha. Simply applying a blanket dose of fertilizer will not do — his soil has high K, medium N, and low P. Using the Soil Test Crop Response (STCR) targeted yield approach, the agronomist calculates the exact doses of N, P, and K needed for his specific soil and target. The result: higher yield with lower fertilizer cost. This is fertility evaluation in action.
Soil Fertility vs. Soil Productivity
| Aspect | Soil Fertility | Soil Productivity |
|---|---|---|
| Definition | Index of available nutrients to plants | Broader term indicating crop yields (kg/ha or Rs./ha) |
| Scope | One factor for crop production | Interaction of all factors (fertility + management + climate) |
| Assessment | Analysed in the laboratory | Assessed in the field under specific conditions |
| Nature | Inherent property of soil | Not an inherent property |
| Function | f (Nutrient status of soil) | f (Soil fertility + Management + Climate) |
| Climate effect | Same in all climates | Differs with climate and location |
| Key relationship | All fertile soils are not necessarily productive | All productive soils are certainly fertile |
IMPORTANT
A soil can be fertile but not productive — for example, a waterlogged soil with abundant nutrients but poor drainage. However, a productive soil must always be fertile because without nutrients, no crop yield is possible.
Agricultural example: The coastal saline soils of Sundarbans have adequate NPK (fertile) but the high salt concentration prevents crops from growing well (unproductive). After reclamation with proper drainage and gypsum application, these soils become productive.
Soil Testing Research in India: Key Milestones
| Year | Milestone |
|---|---|
| 1840 | Liebig's work on mineral nutrition of plants |
| 1947 | Stewart's study on Indian soils |
| 1953 | Fertilizer Use Project — first systematic attempt to relate soils to judicious fertilizer use |
| 1955-56 | Establishment of soil testing laboratories in India |
| 1957 | Model Agronomic Experiments on farms and cultivators' fields |
| — | STCR correlation work at IARI, New Delhi — standardized soil test methods and low/medium/high classification |
Standard Soil Testing Methods
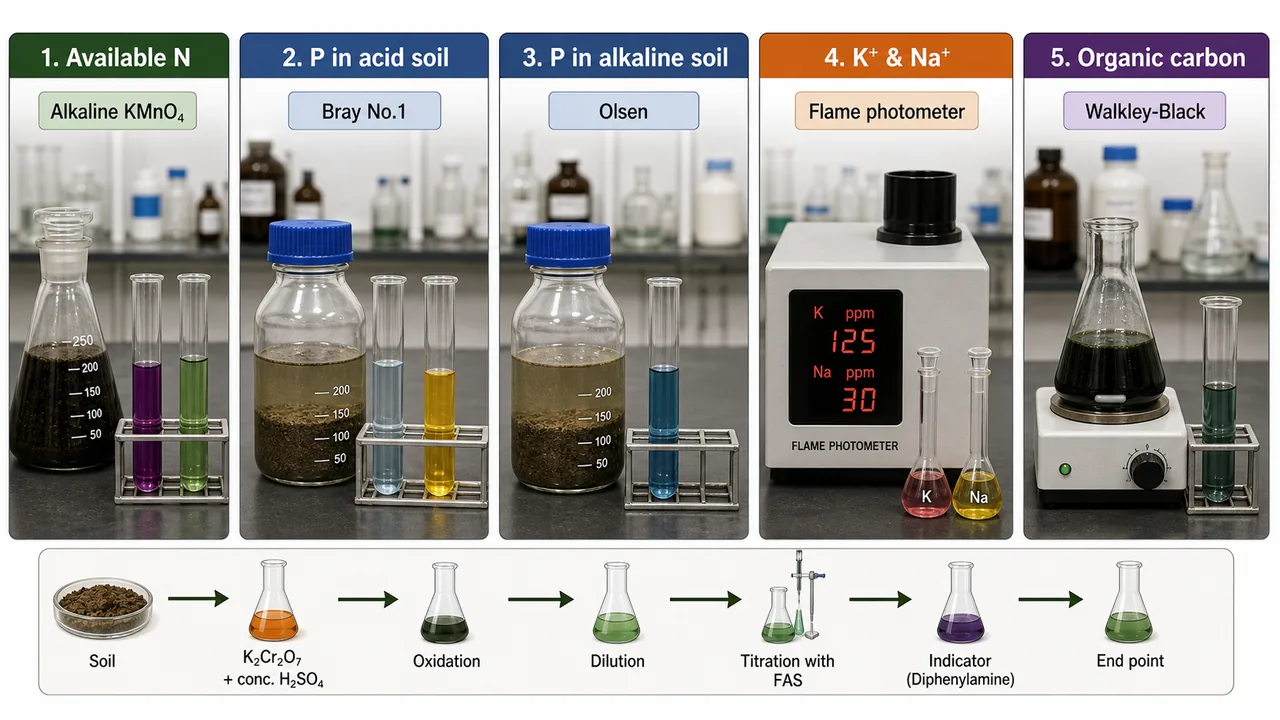
| Nutrient | Method / Extractant | Details |
|---|---|---|
| Nitrogen (N) | Alkaline KMnO4 (Subbiah & Asija) | Measures available N; reported in kg/ha |
| Phosphorus (P) — Acid soils | Bray No.1 | For soils with pH 5.5 or less |
| Phosphorus (P) — Alkaline soils | Olsen's method (0.5N NaHCO3, pH 8.5) | For soils with pH > 5.5 |
| Potassium (K) | Ammonium acetate + Flame photometer | K and Na determined by flame photometry |
| Organic Carbon | Walkley & Black method | Wet oxidation with K2Cr2O7 |
TIP
Exam Tip: Kjeldahl method = total N. Alkaline KMnO4 = available N. Flame photometer = K and Na. These are frequently tested facts.
Soil Test Rating Chart for Available Nutrients
| Nutrient | Compound (Units) | Low | Medium | High |
|---|---|---|---|---|
| Carbon | Organic carbon (%) | <0.5 | 0.5–0.75 | >0.75 |
| Nitrogen | Alkaline KMnO4 (kg/ha) | <280 | 280–560 | >560 |
| Phosphorus | Olsen's NaHCO3 at pH 8.5 (kg/ha) | <12.5 | 12.5–25 | >25 |
| Potassium | Ammonium acetate, flame photometer (kg/ha) | <135 | 135–335 | >335 |
IMPORTANT
These critical nutrient levels are very frequently asked in IBPS AFO and NABARD Grade A. Memorize: N < 280 = Low, P < 12.5 = Low, K < 135 = Low. For composite soil sampling: collect 500 g from about one acre, at depth 0-15 cm for field crops and 0-30, 30-60, 60-90 cm for plantation crops.
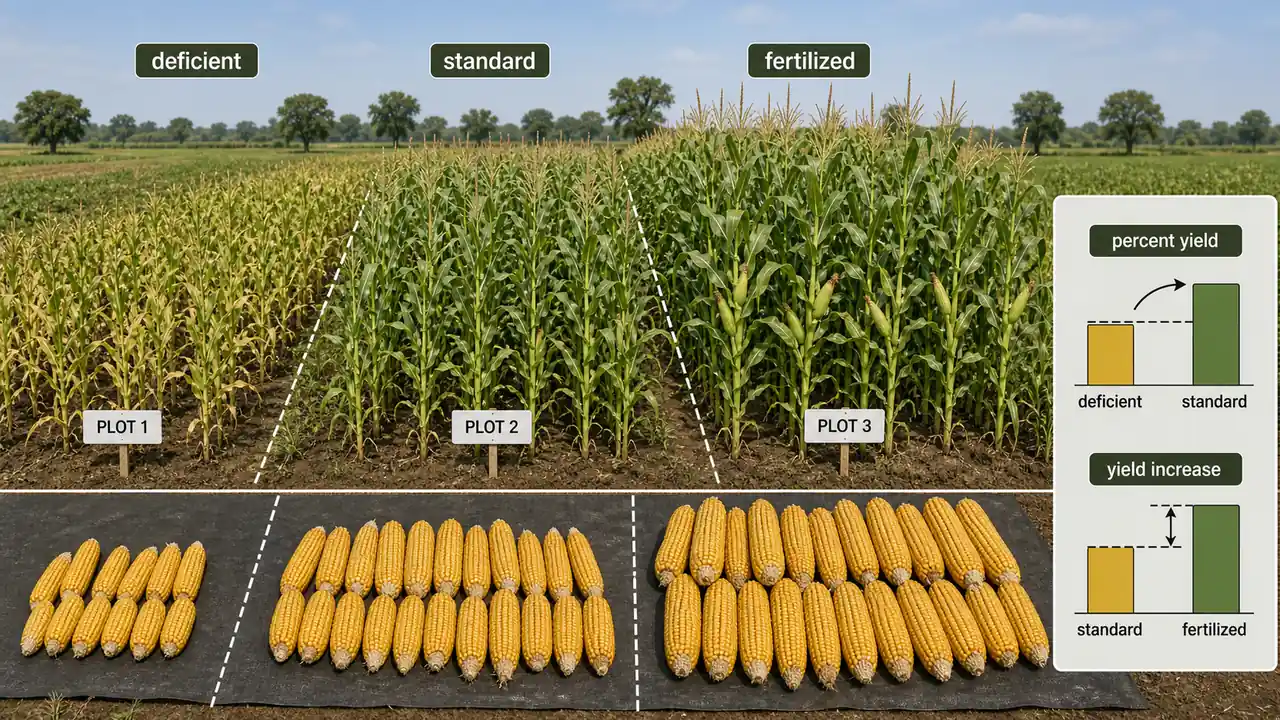
Crop Response Data
- Soil test data is correlated with crop response, measured as percent yield or percent yield increase
- These represent the ratio of yield in unfertilized (deficient) soil to yield in fertilized (sufficient) soil

- Percent yield is used when comparing native fertility across different locations
- Percent yield increase is used in multi-location trials or pot experiments with soils from different locations
- The highest yield with all fertilizer nutrients applied = Maximum attainable yield

Approaches to Fertility Evaluation
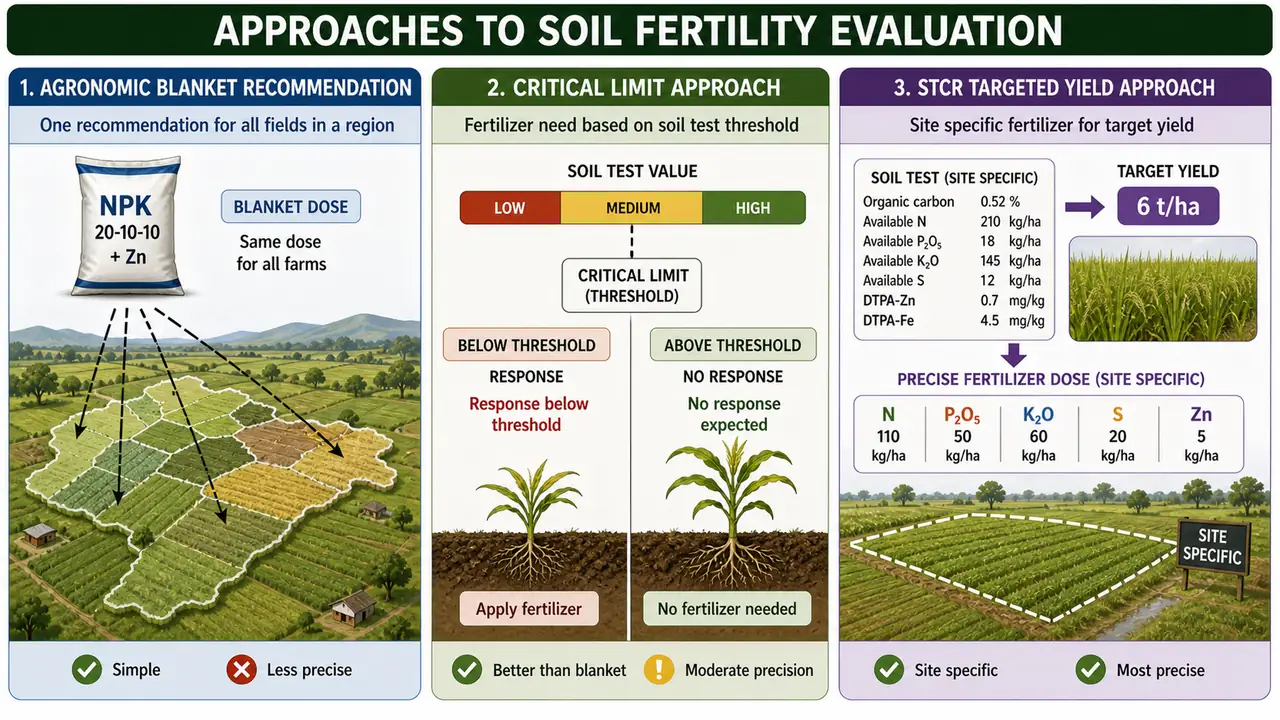
1. Agronomic Approach (Blanket Recommendation)
- Based on fertilizer rate experiments conducted at many locations
- The level producing highest yield is averaged and recommended for a crop in a given agro-climatic region
- Gives a single blanket recommendation — does not account for soil-to-soil variability
Agricultural example: A blanket dose of 120-50-50 kg/ha of N, P2O5, K2O is recommended for rice across a region. But a farmer with high-K soil wastes money on unnecessary K fertilizer.
| Advantage | Limitation |
|---|---|
| Simple and easy to follow | Does not consider individual soil variability |
| Good for regions with similar soils | May lead to over- or under-fertilization |
2. Critical Limit Approach
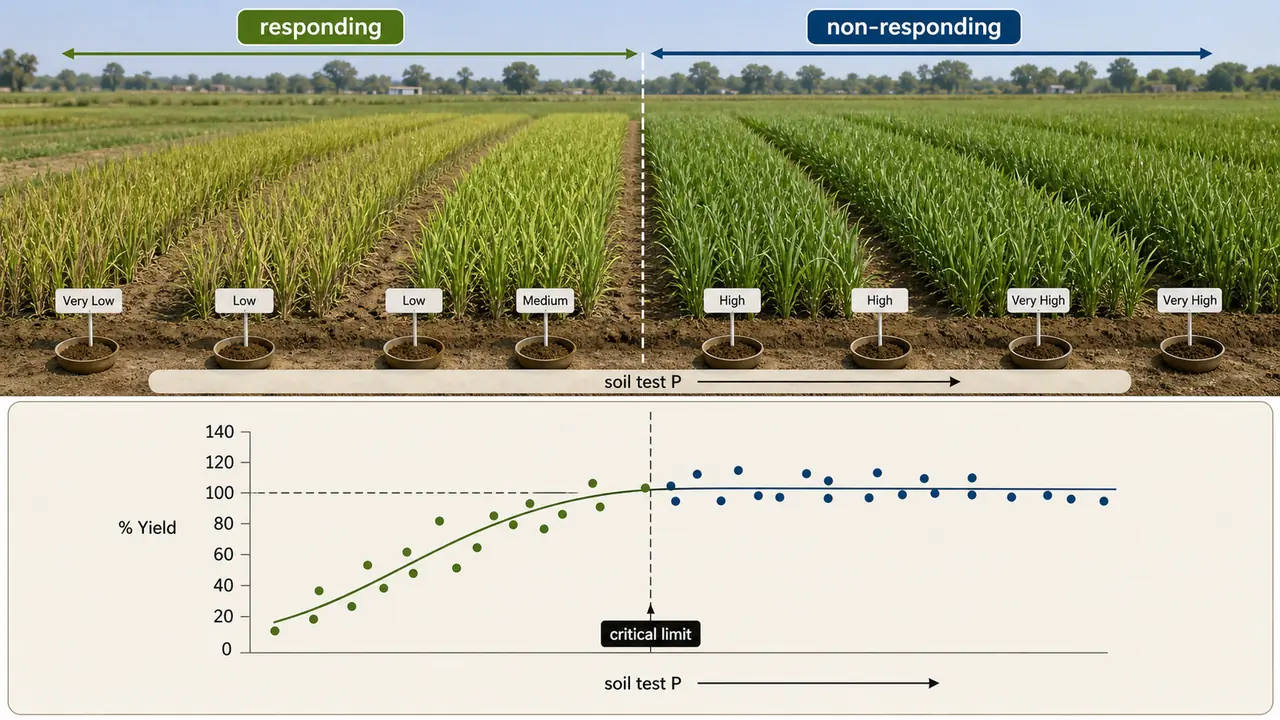
- Developed by Waugh and Fitts (1965)
- Mainly for less mobile nutrients (P, K, micronutrients) where soils vary in fixing capacities
- Critical limit = the soil test value below which an economic response to added fertilizer is expected
Steps:
- Incubation study: Soil incubated for 72 hours with graded doses of soluble P (as monocalcium phosphate)
- Extracted P vs. applied P is plotted — for high-fixing soils, more fertilizer P is needed
- The amount of P fixed is estimated as the X-value
- In pot experiments, fertilizer P is added at 0, 0.5X, X, 2X levels
- Percentage yield vs. soil test value is plotted and grouped using the Cate and Nelson (1965) method
- The soil test value where the vertical line crosses the x-axis = soil critical limit

Agricultural example: In a laterite soil of Kerala that fixes 80% of applied P, the X-value is high. The farmer needs to apply much more P than a farmer on alluvial soil of Punjab where fixation is low.
3. Targeted Yield Approach (STCR)
- The most precise approach — provides site-specific, crop-specific, and target-specific recommendations
- Based on Soil Test Crop Response Function (STCR)
- Founded on Liebig's Law of Minimum and the significant linear relationship between grain yield and nutrient uptake, first advocated by Troug (1960)
How It Works:
- For a specific yield target (T in q/ha), a definite quantity of nutrient must be taken up
- This is determined by the nutrient requirement (NR in kg) to produce one unit of target yield
| Crop | N | P₂O₅ | K₂O |
|---|---|---|---|
| Rice | 2.01 | 1.12 | 3.00 |
| Wheat | 2.45 | 0.86 | 3.28 |
| Maize | 2.63 | 1.39 | 3.58 |
| Sorghum | 2.24 | 1.33 | 3.40 |
| Finger millet | 2.98 | 1.13 | 3.90 |
| Chickpea | 4.63 | 0.84 | 4.96 |
| Soybean | 6.68 | 1.77 | 4.44 |
| Groundnut | 5.81 | 1.96 | 3.01 |
| Potato | 0.39 | 0.14 | 0.49 |
| Cotton | 4.45 | 2.83 | 7.47 |
| Feature | Agronomic Approach | Critical Limit | STCR Targeted Yield |
|---|---|---|---|
| Precision | Low (blanket) | Moderate | High (site-specific) |
| Considers soil test | No | Yes | Yes |
| Yield target | No | No | Yes |
| Best for | Uniform regions | Less mobile nutrients | All nutrients, all crops |
TIP
Exam Tip: STCR = most precise fertilizer recommendation system. It accounts for soil contribution, fertilizer efficiency, and organic manure contribution simultaneously.
Fertility Evaluation by Plant Analysis
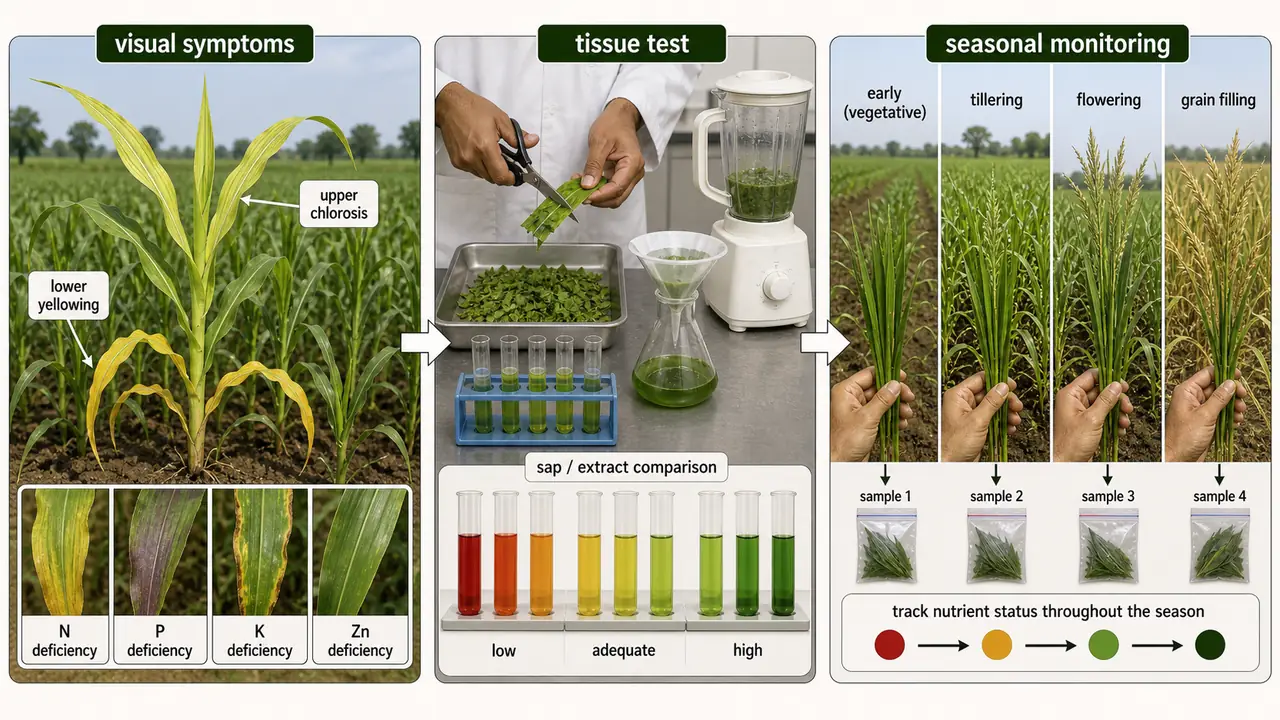
- Careful inspection of plants can identify specific nutrient stress
- Characteristic symptoms relate to the nutrient's function in the plant
- Limitation: visual symptoms may be caused by more than one nutrient deficiency
Tissue Tests (Semi-quantitative)
| Aspect | Details |
|---|---|
| What is measured | Nutrient concentration in cell sap |
| Nutrients tested | N, P, K, S, and several micronutrients |
| Method | Plant parts chopped, extracted with reagents; colour intensity compared with standards |
| Frequency | 5-6 times per season |
| Peak demand periods | Maximum vegetative growth and reproductive stage |
Agricultural example: A sugarcane farmer in Maharashtra tests the tissue sap of leaf sheaths every 5 weeks to monitor N and K levels, adjusting fertigation in real time.
DRIS: Diagnosis and Recommendation Integrated System
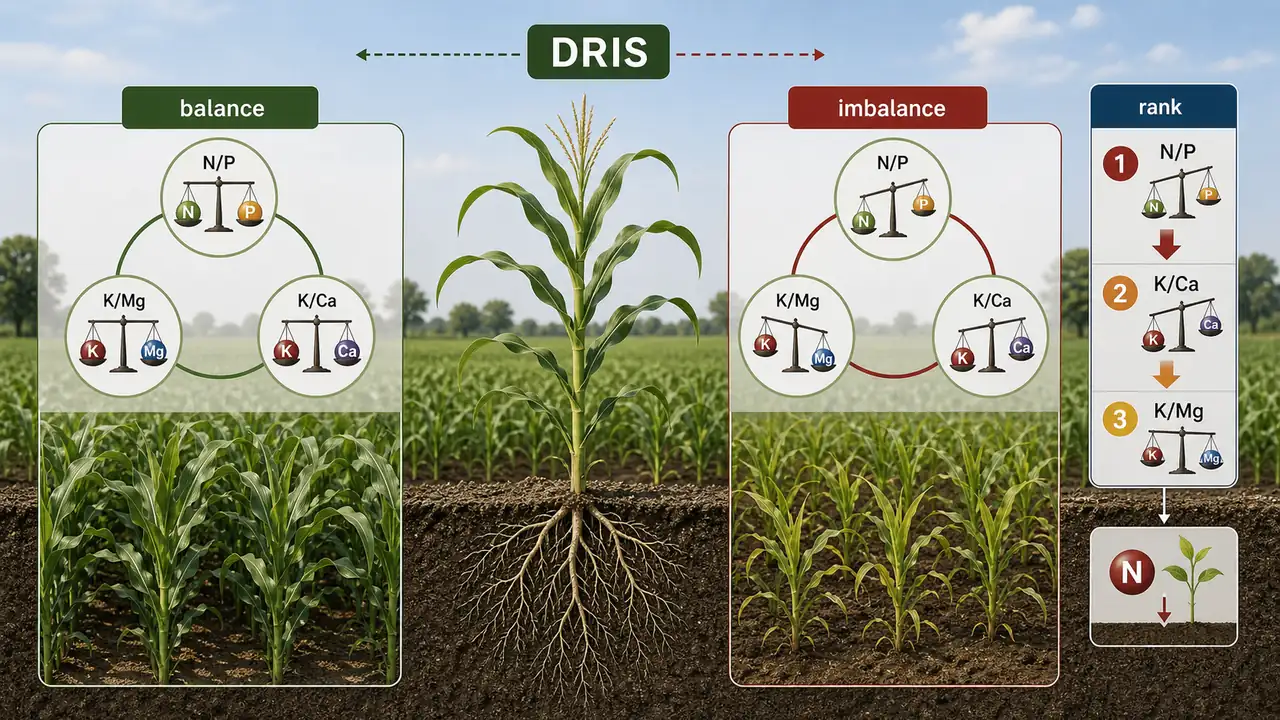
- DRIS identifies all nutritional factors limiting crop production
- More robust than critical value approaches because it considers the balance between nutrients, not just individual concentrations
- Based on nutrient ratios (e.g., N/P, N/S, K/Mg, K/Ca, Ca+Mg/K)
| Feature | Critical Value Approach | DRIS |
|---|---|---|
| Basis | Individual nutrient concentration | Nutrient ratios |
| Seasonal variation | Concentration varies with season | Ratio is more stable across seasons |
| Diagnostic power | Identifies single deficiency | Ranks all limiting factors in order |
| Suitable for | Annual crops | Grain crops and perennial fruit trees |

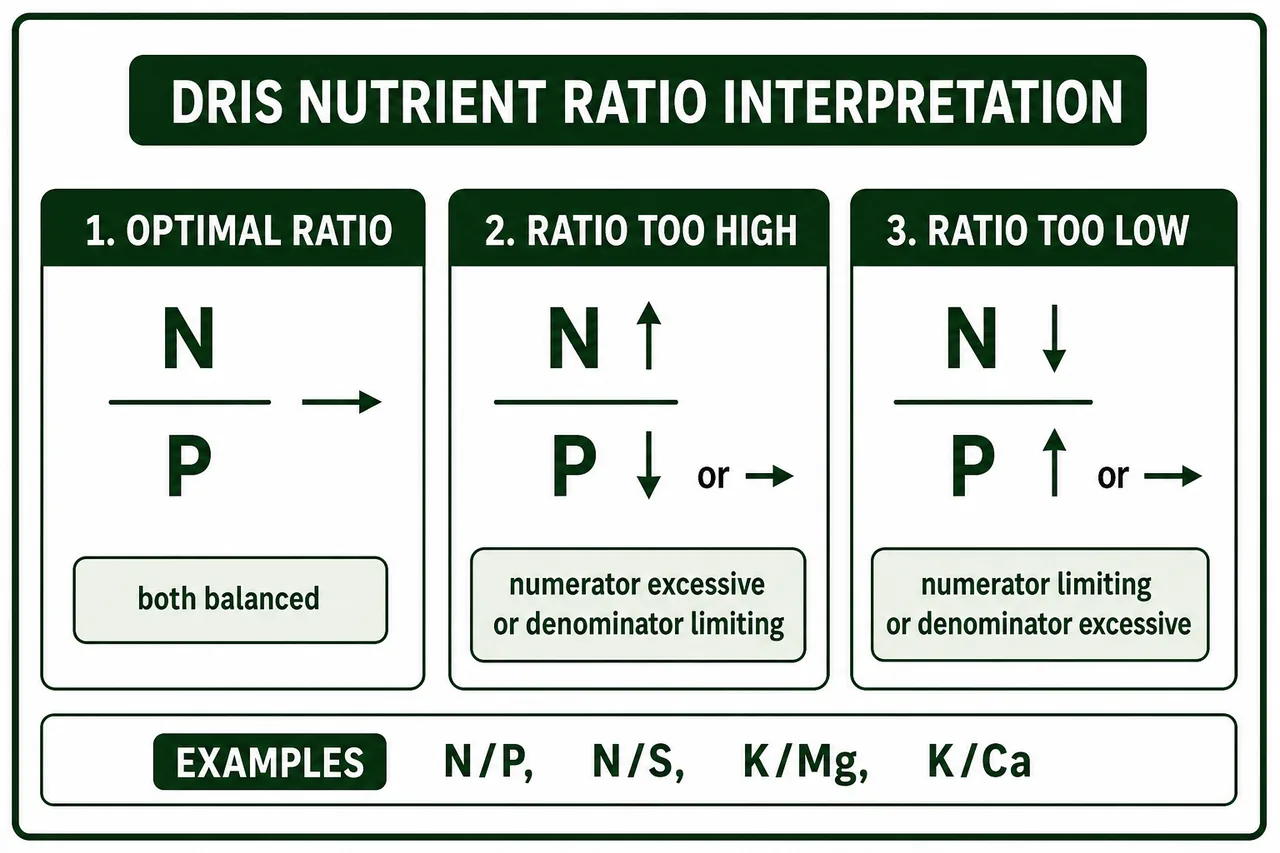
- When the ratio is too low, the nutrient in the numerator may be limiting
- When the ratio is too high, the reverse is true
- Common ratios: N/S, K/Mg, K/Ca, Ca+Mg/K, N/P
Crop Logging
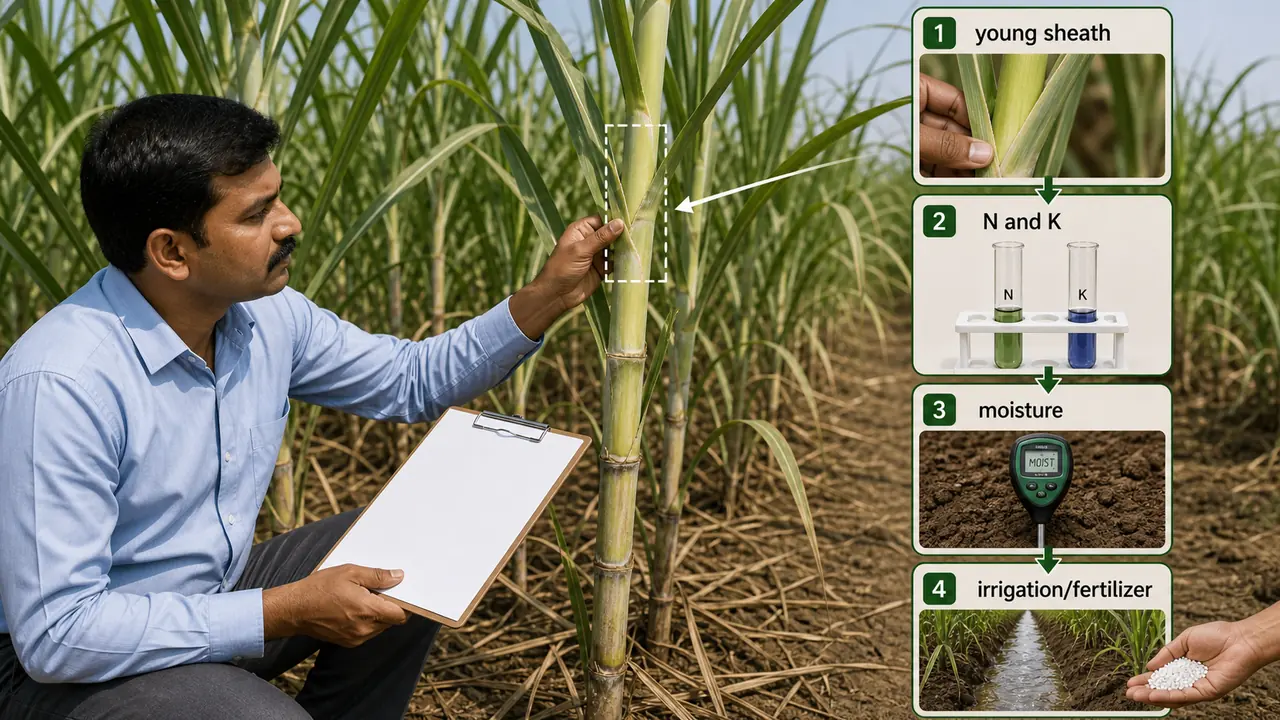
| Aspect | Details |
|---|---|
| Crop | Sugarcane |
| First used in | Hawaii |
| Parameters | N, sugar, moisture, weight of young sheath tissue; P and K at critical stages |
| Sampling | Plant sampled at 35 days |
| Approach | Critical nutrient concentration; graphic record of crop progress |
| Purpose | Real-time nutrient and irrigation management for maximum productivity |
Biological Tests for Soil Fertility
Tests Using Higher Plants
| Method | Details |
|---|---|
| Neubauer seedling method | 100 seedlings of rye or oats grown in 100 g soil mixed with 50 g sand. Roots exhaust available nutrients. Neubauer Numbers (mg/100 g soil) indicate deficiency |
| Standard & Demont technique | Modified Neubauer method. Seedlings grown in sand for 2-3 weeks, then nested in 200 g soil for 3-4 days. Nutrient uptake estimated |
| Sunflower B deficiency test | Sunflower grown with all nutrients except B. Highly sensitive to boron deficiency |
| Appearance of B deficiency symptoms of leaves | Soil will be |
|---|---|
| < 28 days | Deficient |
| 28-36 days | Moderately Deficient |
| > 36 days | Not Deficient |

Microbiological Methods
Faster, simpler, and require less space than higher-plant methods.
| Method | Organism | Nutrient Tested | Procedure |
|---|---|---|---|
| Sacket & Stewart | Azotobacter | P and K | Soil divided into 4 portions with P, K, P+K, and control. Incubated 72 hours. Colony growth indicates deficiency |
| Melich Cunninghamella plaque test | Cunninghamella | P | Soil paste on clay dish, fungus inoculated at centre. Diameter of growth after 5-6 days indicates available P |
| Mulder Aspergillus niger test | Aspergillus niger | Cu, Mg, Mo, Co, Mn, S, Zn | Mycelial and spore colours delineate specific deficiencies |
| Based on the diameter of mycelial growth | The soil is diagnosed as |
|---|---|
| <10 cm | Deficient |
| 11-21 cm | Moderately Deficient |
| >22 cm | Not Deficient |
Land Capability Classification (LCC)
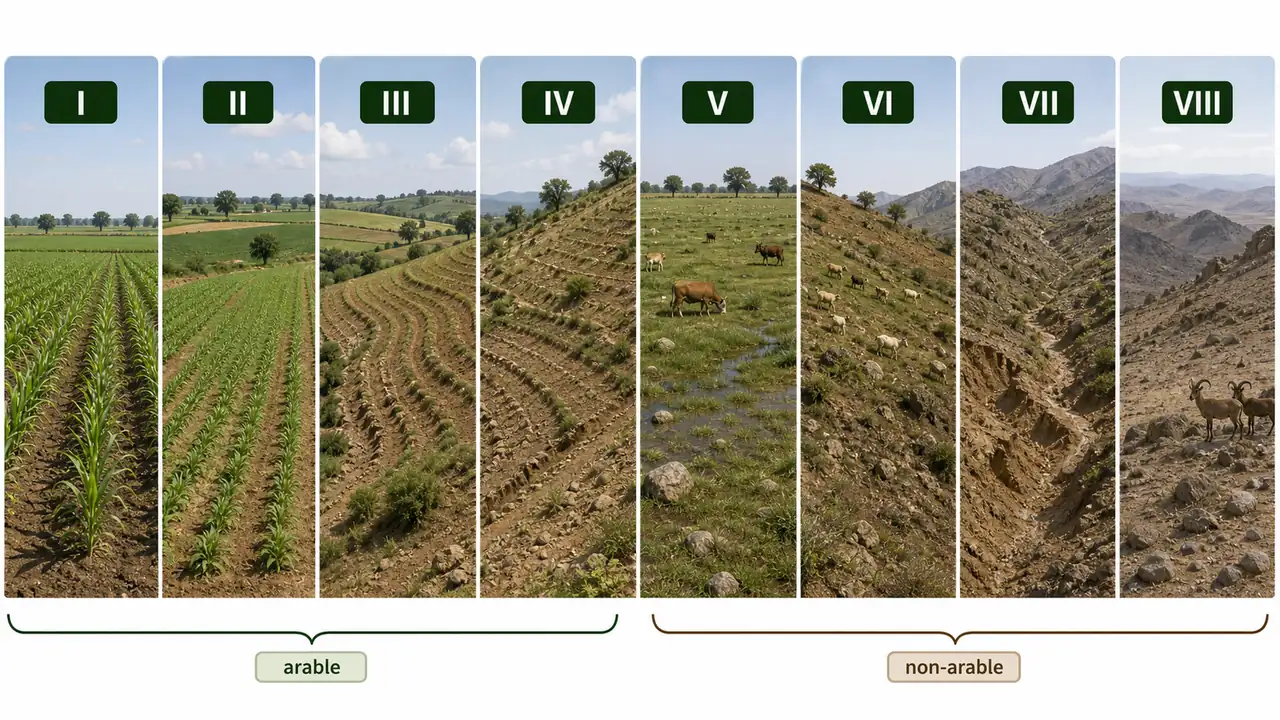
Classes I-IV: Suitable for Agriculture
| Class | Colour on Map | Characteristics | Agricultural Example |
|---|---|---|---|
| I | Green | Very good land, deep, nearly level, no limitation. Suited for wheat, cotton, maize, tomato | Indo-Gangetic alluvial soils |
| II | Yellow | Good land on gentle slopes, moderate depth. May require drainage | Deep red and black soils |
| III | Red | Moderate fertility, moderately steep slopes, severe erosion risk. Hay/sod crops preferred | Shallow red soils, slightly saline black soils |
| IV | Blue | Steep slopes, severe erosion, cultivated only occasionally (grain once in 5-6 years) | Shallow soils, saline-alkaline soils |
Classes V-VIII: Not Suitable for Cultivation
| Class | Colour on Map | Characteristics | Use |
|---|---|---|---|
| V | Dark green | Too wet or stony for cultivation. Slight erosion if managed | Pasture or forestry |
| VI | Orange | Shallow soils on steep slopes | Regulated grazing and forestry |
| VII | Brown | Steep, rough, eroded, shallow soils; includes swampy land | Strict grazing/forest management |
| VIII | Purple | Very rough land — not suitable even for woodland or grazing | Wildlife, recreation, wasteland |
IMPORTANT
Exam Tip: Classes I-IV = Arable (can grow crops). Classes V-VIII = Non-arable (only pasture/forestry/wildlife). Limitations increase from Class I to VIII. Class I = least limitations, Class VIII = most severe.
TIP
Mnemonic for LCC map colours (I-VIII): "Green Yellow Red Blue Dark-green Orange Brown Purple" — "Good Yields Require Balanced Doses Of Bio-Practices"
References
- Tisdale, S.L., Nelson, W.L., Beaton, J.D., Havlin, J.L. 1997. Soil Fertility and Fertilizers. 5th ed. Prentice Hall of India, New Delhi.
- Singh, S.S. 1995. Soil Fertility and Nutrient Management. Kalyani Publishers, Ludhiana.
- Maliwal, G.L. and Somani, L.L. 2011. Soil Technology. Agrotech.
- IARI Toppers Soil Science Part-9 (6th Edition 2025).
Summary Cheat Sheet
| Concept / Topic | Key Details |
|---|---|
| Soil Fertility vs Productivity | Fertility = available nutrients (lab); Productivity = crop yield (field, all factors) |
| Fertile but not productive | Possible (e.g., waterlogged soil); productive soil must be fertile |
| Soil testing labs in India | Established in 1955–56 |
| STCR | Soil Test Crop Response — most precise; site-specific targeted yield approach |
| STCR basis | Liebig's Law of Minimum; advocated by Troug (1960) |
| Agronomic approach | Blanket recommendation from fertilizer rate experiments; low precision |
| Critical Limit approach | Developed by Waugh & Fitts (1965); for less mobile nutrients (P, K, micro) |
| Cate & Nelson (1965) | Graphical method to determine soil critical limit |
| N test method | Alkaline KMnO₄ (Subbiah & Asija) — available N |
| P test — acid soils | Bray No. 1 (pH ≤ 5.5) |
| P test — alkaline soils | Olsen's method (0.5N NaHCO₃, pH 8.5) |
| K test method | Ammonium acetate + Flame photometer |
| Organic carbon method | Walkley & Black (wet oxidation with K₂Cr₂O₇) |
| N low/medium/high (kg/ha) | <280 / 280–560 / >560 |
| P low/medium/high (kg/ha) | <12.5 / 12.5–25 / >25 |
| K low/medium/high (kg/ha) | <135 / 135–335 / >335 |
| OC low/medium/high (%) | <0.5 / 0.5–0.75 / >0.75 |
| Composite soil sampling | 500 g from ~1 acre; depth 0–15 cm (field crops) |
| DRIS | Diagnosis & Recommendation Integrated System; uses nutrient ratios |
| Crop logging | Used for sugarcane; first used in Hawaii; sampled at 35 days |
| Neubauer method | 100 seedlings in 100 g soil + 50 g sand; measures available P & K |
| Cunninghamella plaque test | Fungal diameter after 5–6 days indicates available P |
| Aspergillus niger test | Mycelial/spore colour indicates Cu, Mg, Mo, Co, Mn, S, Zn deficiency |
| LCC Classes I–IV | Arable (can grow crops); limitations increase I → IV |
| LCC Classes V–VIII | Non-arable (pasture/forestry/wildlife only) |
| LCC map colours (I–VIII) | Green, Yellow, Red, Blue, Dark-green, Orange, Brown, Purple |
| Kjeldahl method | Measures total N (not available N) |
| Tissue tests frequency | 5–6 times per season |
| Agronomic (blanket) | Fertilizer rate experiments; Exam tip: Low |
| Microbiological tests | Microbial growth response; Exam tip: Rapid, simple |