🏜️ Land Degradation & Wastelands in India
Desertification trends, degradation processes, wasteland classification (NWDB & Atlas 2026), state-wise statistics, and per capita agricultural land
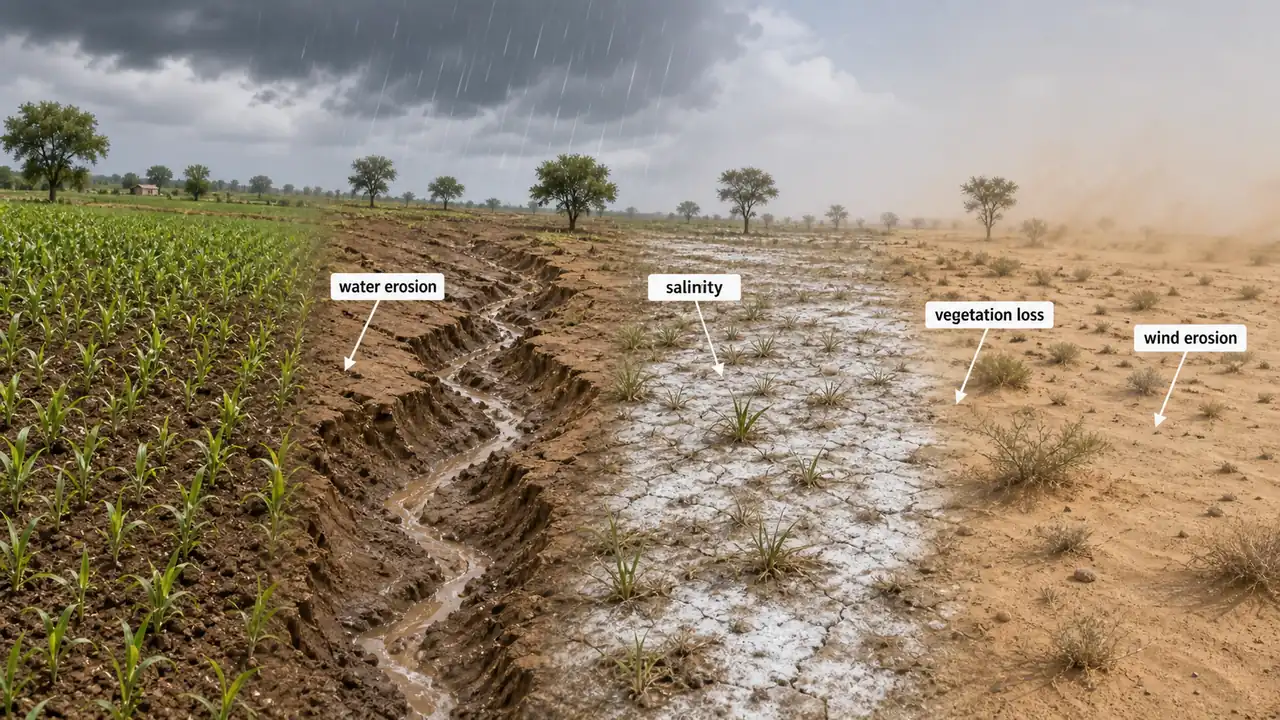
Soil erosion strips topsoil, salinity poisons root zones, and waterlogging suffocates crops — all forms of land degradation that convert productive farmland into wastelands. India lost an additional 1.45 Mha to desertification between 2011 and 2019, while nearly 56 Mha of its land sits classified as wasteland. Understanding the scale, processes, and geography of degradation is essential for soil conservation planning.
Land Degradation & Desertification
- Total area under desertification: 97.85 Mha (29.77% of Total Geographical Area) during 2018–19
- This represents an increase of 1.45 Mha from 2011–13
- Most significant process: Water Erosion (11.01%), followed by Vegetation Degradation (9.15%) and Wind Erosion (5.46%)
Dominant Degradation Processes by Region
| Region | Dominant Process |
|---|---|
| Arid regions | Wind Erosion |
| Semi-arid & Dry Sub-humid regions | Water Erosion and Vegetation Degradation |
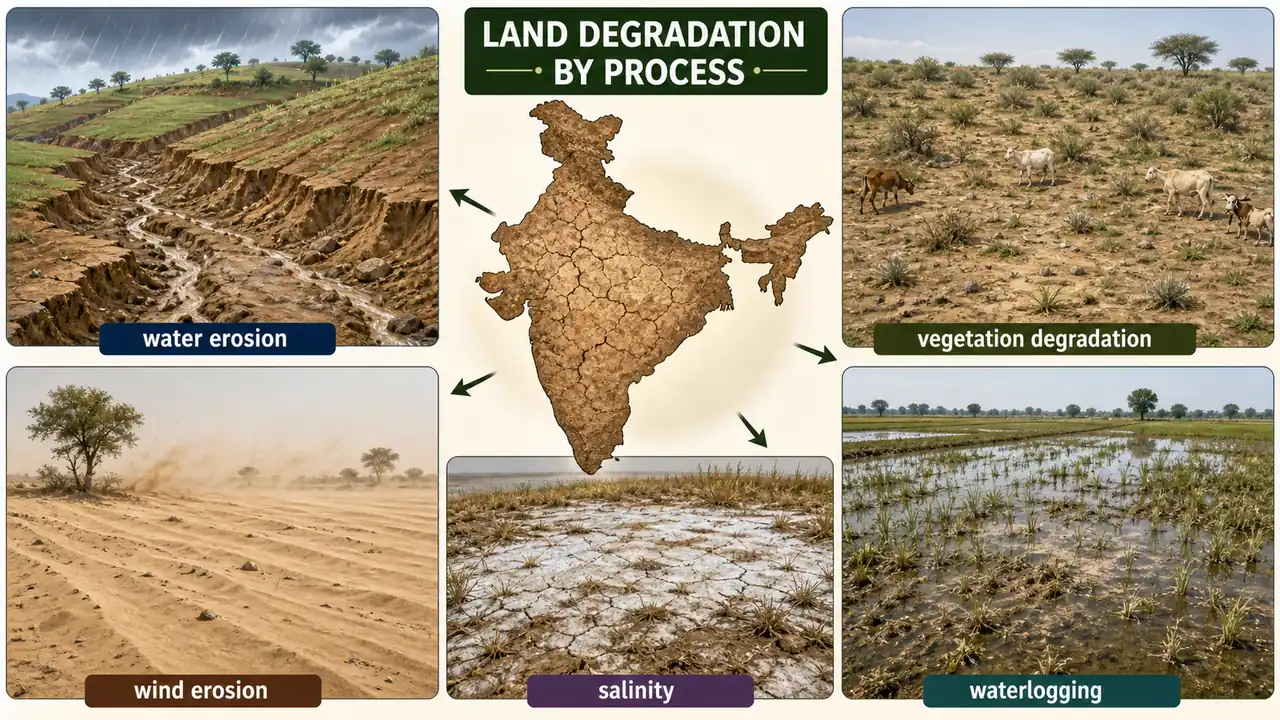
Land Degradation by Process
| Process | Area (Mha) |
|---|---|
| Water Erosion | 36.20 |
| Vegetation Degradation | 30.07 |
| Wind Erosion | 17.94 |
| Salinity | 3.64 |
| Water Logging | 0.80 |
| Total | 97.85 |
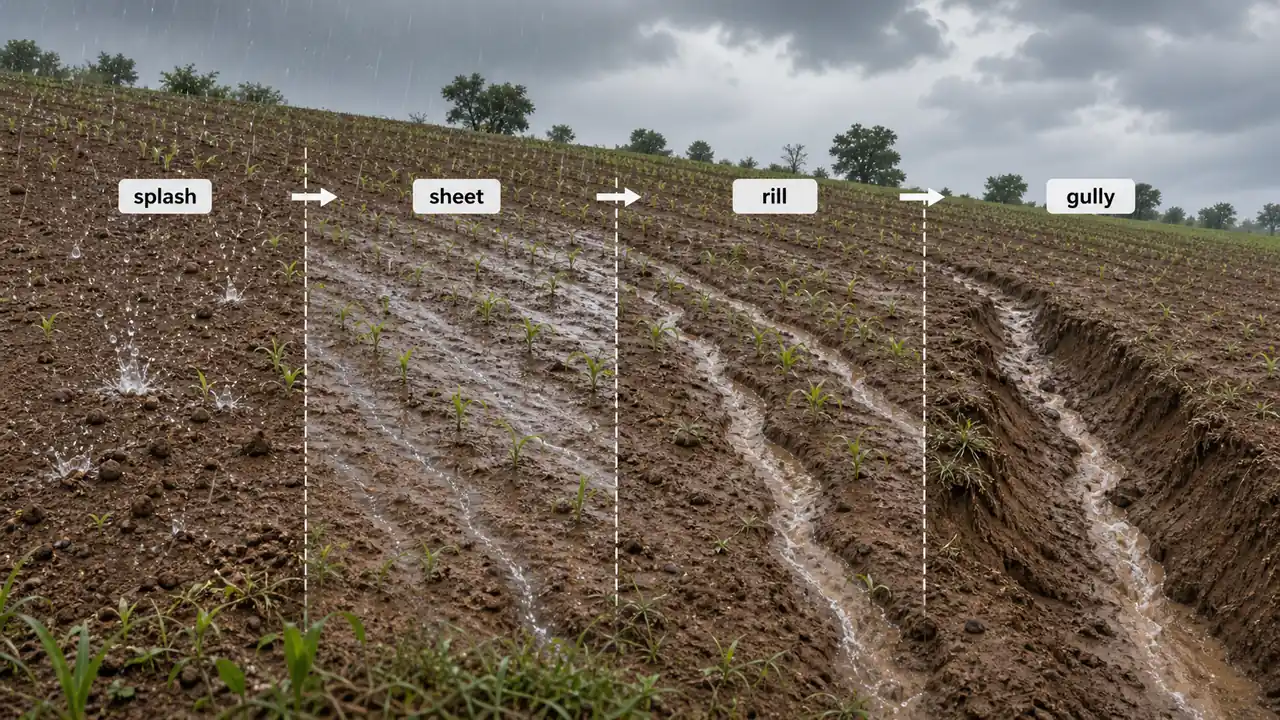
Water erosion is the single largest contributor to land degradation in India, affecting 36.20 Mha.
Pro Content Locked
Upgrade to Pro to access this lesson and all other premium content.
₹99 charged monthly · Cancel anytime
- All Agriculture & Banking Courses
- AI Lesson Questions (100/day)
- AI Doubt Solver (50/day)
- Glows & Grows Feedback (30/day)
- AI Section Quiz (20/day)
- 22-Language Translation (100/day)
- Recall Questions (20/day)
- AI Quiz (15/day)
- AI Quiz Paper Analysis (100/day)
- AI Step-by-Step Explanations (100/day)
- Spaced Repetition Recall (FSRS)
- AI Tutor
- Immersive Text Questions
- Audio Lessons — Hindi & English
- Mock Tests & Previous Year Papers
- Summary & Mind Maps
- XP, Levels, Leaderboard & Badges
- Generate New Classrooms
- Voice AI Teacher (AgriDots Live)
- AI Revision Assistant
- Knowledge Gap Analysis
- Interactive Revision (LangGraph)
🔒 Secure via Razorpay · Cancel anytime · No hidden fees
Soil erosion strips topsoil, salinity poisons root zones, and waterlogging suffocates crops — all forms of land degradation that convert productive farmland into wastelands. India lost an additional 1.45 Mha to desertification between 2011 and 2019, while nearly 56 Mha of its land sits classified as wasteland. Understanding the scale, processes, and geography of degradation is essential for soil conservation planning.
Land Degradation & Desertification
- Total area under desertification: 97.85 Mha (29.77% of Total Geographical Area) during 2018–19
- This represents an increase of 1.45 Mha from 2011–13
- Most significant process: Water Erosion (11.01%), followed by Vegetation Degradation (9.15%) and Wind Erosion (5.46%)
Dominant Degradation Processes by Region
| Region | Dominant Process |
|---|---|
| Arid regions | Wind Erosion |
| Semi-arid & Dry Sub-humid regions | Water Erosion and Vegetation Degradation |
Land Degradation by Process
| Process | Area (Mha) |
|---|---|
| Water Erosion | 36.20 |
| Vegetation Degradation | 30.07 |
| Wind Erosion | 17.94 |
| Salinity | 3.64 |
| Water Logging | 0.80 |
| Total | 97.85 |
Water erosion is the single largest contributor to land degradation in India, affecting 36.20 Mha.
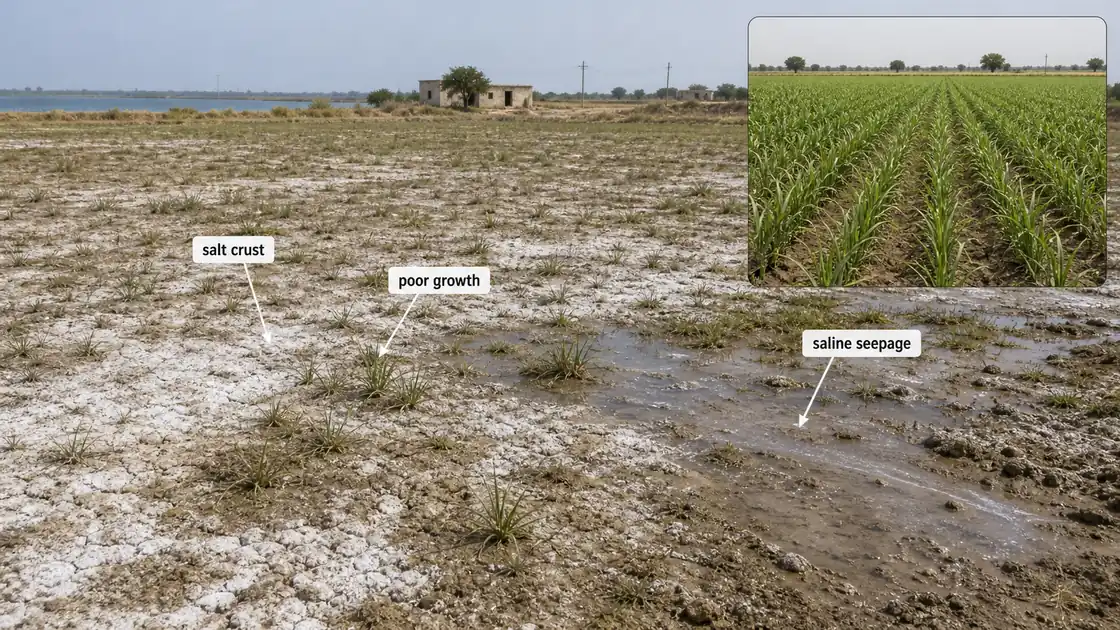
Salinity Affected Areas by State
| State | Area (Lakh ha) |
|---|---|
| Gujarat | 25.99 |
| Rajasthan | 3.66 |
| Uttar Pradesh | 2.83 |
| Andhra Pradesh | 1.19 |
| Karnataka | 0.89 |
Gujarat has the highest salt-affected area due to the Rann of Kutch and coastal salinity ingress.
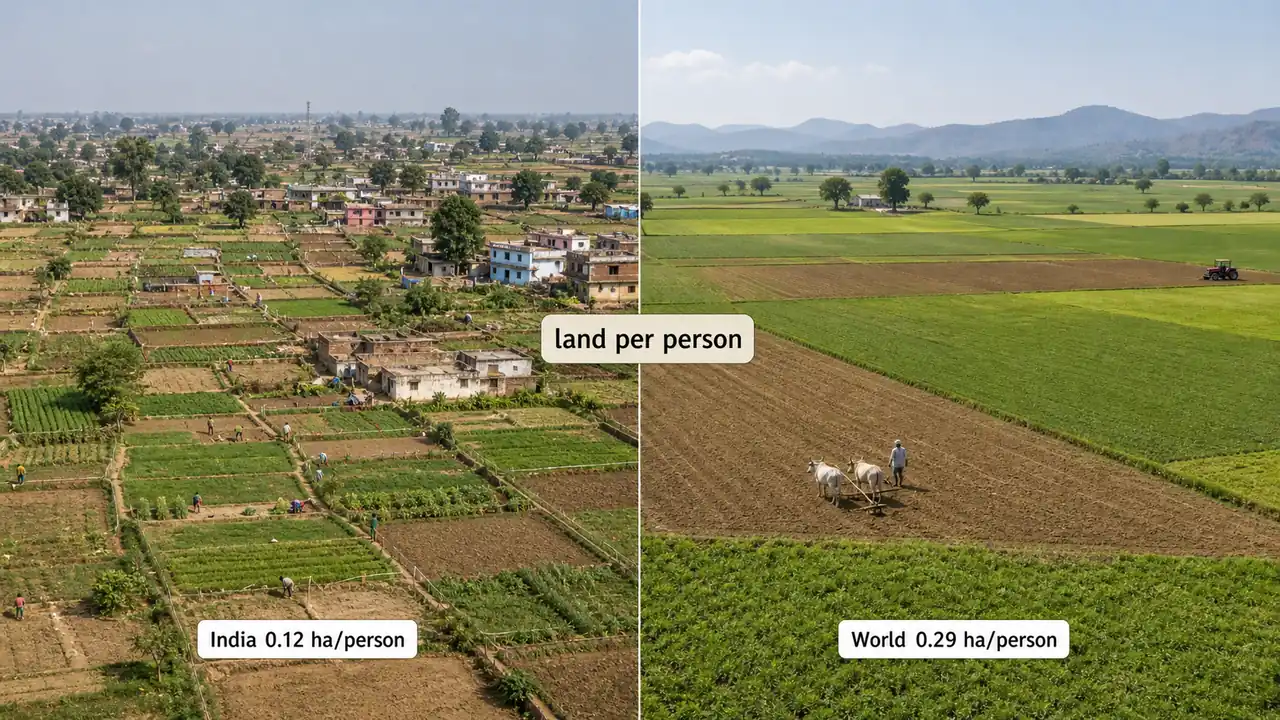
Per Capita Agricultural Land
| Region | Per Capita Agri Land |
|---|---|
| India | 0.12 ha |
| World | 0.29 ha |
India's per capita agricultural land is less than half the world average, highlighting intense pressure on land resources.
Note: Above figures are from the Wasteland Atlas 2019 and refer to total agricultural land (arable + permanent crops + pastures). Using arable land only, World Bank 2023 data shows India at 0.107 ha/person and world average at 0.172 ha/person.
Wastelands in India
The National Wastelands Development Board (NWDB) classifies wastelands into two broad categories (14-type scheme). The Wasteland Atlas 2019 (5th edition, NRSC/DoLR) uses a more detailed 23-category classification.
| Category | Number of Types |
|---|---|
| Cultivable Wastelands | 11 types |
| Uncultivable Wastelands | 3 types |
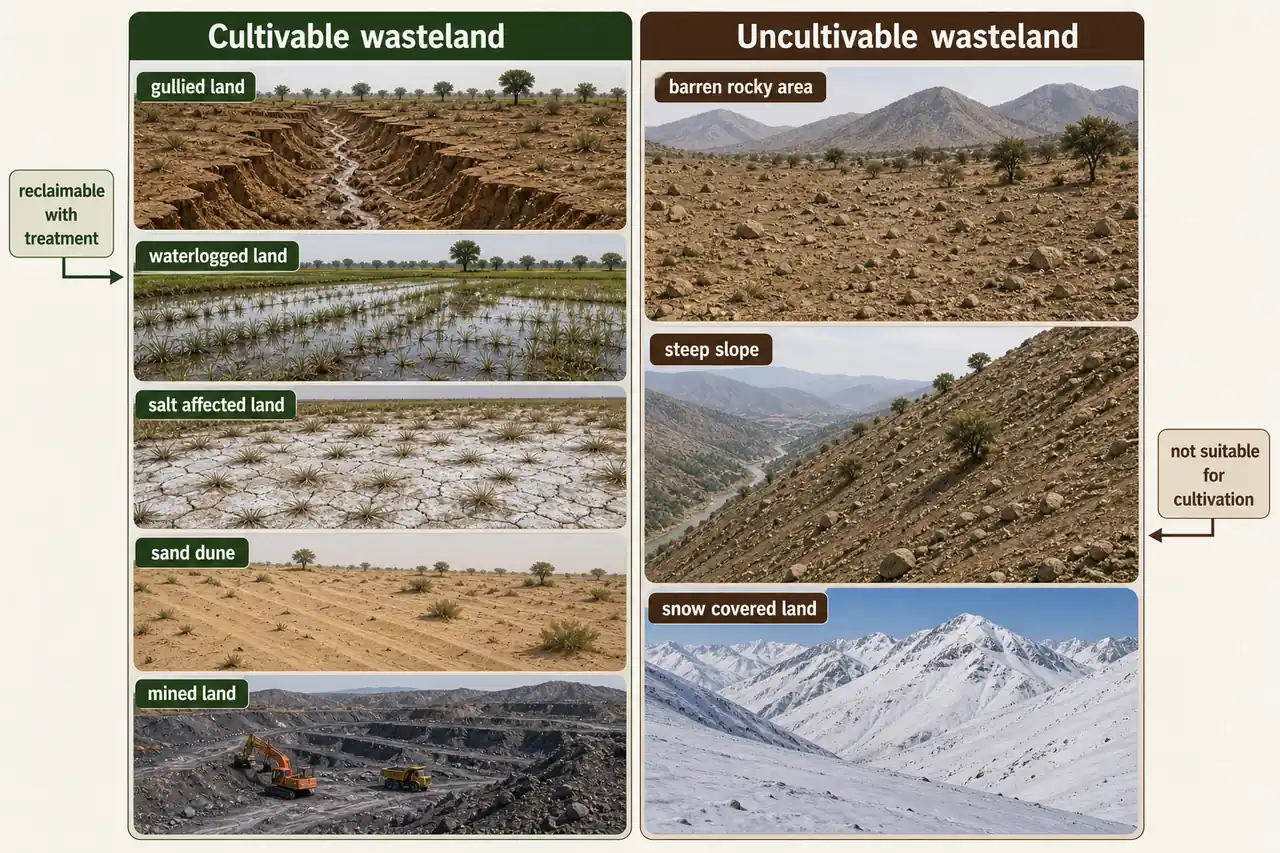
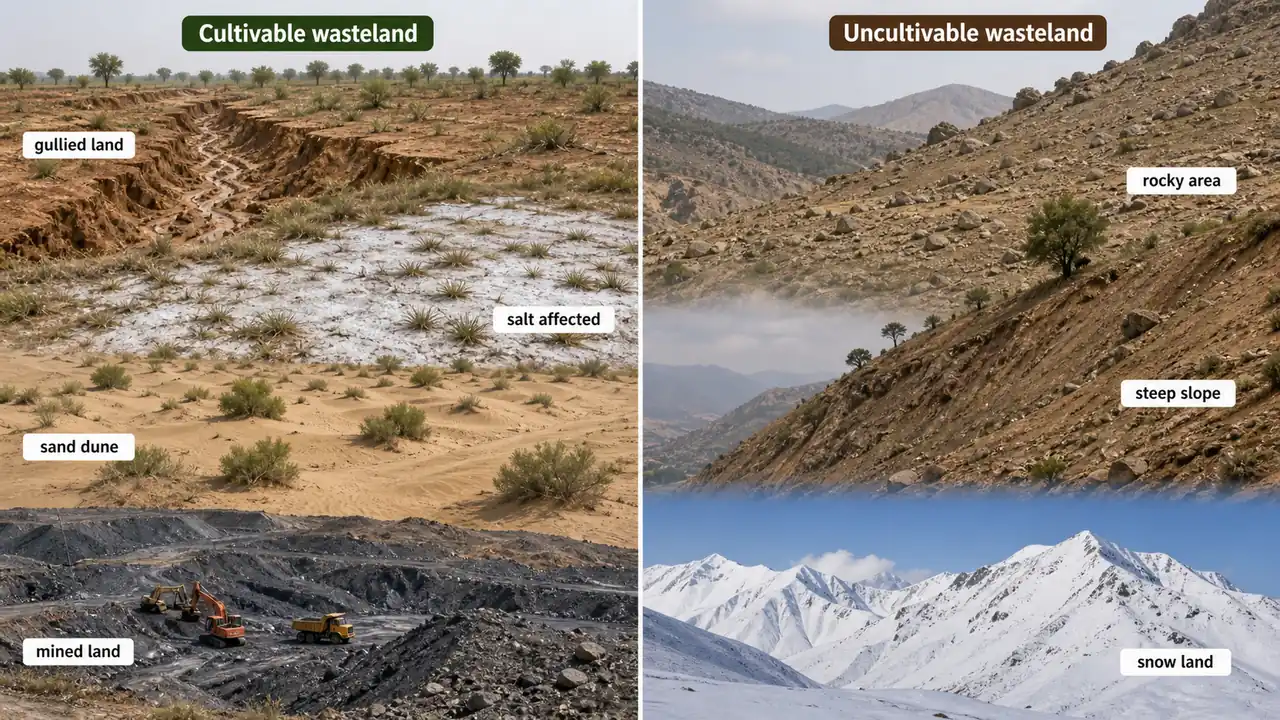
| Wasteland Group Shown | Examples in the Image | Practical Meaning |
|---|---|---|
| Cultivable wasteland | Gullied land, waterlogged land, salt-affected land, sand dune, mined land | Degraded land that may be brought back into use with reclamation and treatment |
| Uncultivable wasteland | Barren rocky area, steep slope, snow covered land | Land generally unsuitable for cultivation under normal reclamation efforts |
Cultivable Wastelands (11 Types)
- Gullied and/or ravinous land
- Undulating upland without scrub/shrubs
- Surface waterlogged land
- Salt-affected land
- Shifting cultivation areas
- Degraded forest land (open & dense)
- Degraded pastures/grazing land
- Degraded land under forest plantations
- Strip lands
- Sand dunes (coastal & desertic)
- Mining/industrial wastelands
Uncultivable Wastelands (3 Types)
- Barren rocky/stony areas
- Steep slopy areas
- Snow covered/glacier lands
Wasteland Statistics
Overall Figures
| Parameter | Value |
|---|---|
| Total wastelands (2015–16) | 55.76 Mha (16.96% of geographical area) |
| Total wastelands (2008–09) | 56.60 Mha |
| Reduction (2008–09 to 2015–16) | 8,404 sq km |
| Highest wasteland (state/UT) | Jammu & Kashmir (undivided, pre-2019) — 1,75,697 sq km |
| Lowest wasteland (state/UT) | Delhi — 81.27 sq km |
Change Across States
- Wastelands decreased in 18 states and increased in 11 states
States with Maximum Wasteland Reduction (Positive Change)
| State | Reduction |
|---|---|
| Rajasthan | 0.48 Mha |
| Bihar | 0.11 Mha |
| Uttar Pradesh | 0.10 Mha |
| Andhra Pradesh | 0.08 Mha |
States with Wasteland Increase (Negative Change)
| State | Increase (sq km) |
|---|---|
| Odisha | 465.82 |
| Assam | 406.69 |
| Telangana | 377.79 |
| Chhattisgarh | 373.54 |
Rajasthan showed the highest positive change (reduction in wastelands) of 0.48 Mha, largely due to reclamation of sand dune areas and afforestation efforts. Conversely, Odisha saw the highest increase in wastelands.
Update (Nov 2024): SAC/ISRO published a supplementary Land Degradation Vulnerability Assessment atlas — it maps vulnerability to future degradation (not current extent). No new edition of the main Desertification Atlas or Wasteland Atlas has been released as of April 2026.
References
6 sources • [1] [2] [3] [4] [5] [6]
References
Used for: Primary source for desertification figures (97.85 Mha, 2018-19 data). Latest full edition.
Used for: Primary source for wasteland statistics (55.76 Mha, 2015-16 data). Latest edition with 23-category classification.
Used for: Official press release with key figures: total wastelands, state-wise changes, and net conversion data.
Used for: Latest per capita arable land data (2023): India 0.107 ha, World 0.172 ha.
Used for: Analysis of ISRO atlas findings and trends in desertification across Indian states.
Used for: FAO's global land-use statistics covering agricultural land, arable land, and per capita trends.
Summary Cheat Sheet
| Concept / Topic | Key Details / Explanation |
|---|---|
| Total desertification area (2018-19) | 97.85 Mha — 29.77% of Total Geographical Area |
| Change from 2011-13 | Increase of 1.45 Mha |
| Largest degradation process | Water Erosion — 36.20 Mha (11.01% of TGA) |
| 2nd largest process | Vegetation Degradation — 30.07 Mha (9.15%) |
| 3rd largest process | Wind Erosion — 17.94 Mha (5.46%) |
| Salinity affected | 3.64 Mha |
| Water logging | 0.80 Mha |
| Arid regions – dominant process | Wind Erosion |
| Semi-arid/dry sub-humid regions | Water Erosion and Vegetation Degradation |
| Highest salinity affected state | Gujarat — 25.99 lakh ha (Rann of Kutch + coastal salinity) |
| India per capita agri land | 0.12 ha (vs world 0.29 ha) — total agri land (Atlas 2019). Arable only (WB 2023): 0.107 ha vs 0.172 ha |
| Wasteland classification authority | NWDB (14-type scheme); Wasteland Atlas 2019 uses 23 categories |
| Cultivable wastelands | 11 types (gullied land, salt-affected, sand dunes, mining wastelands, etc.) |
| Uncultivable wastelands | 3 types — Barren rocky areas, Steep slopy areas, Snow-covered/glacier lands |
| Total wastelands (2015-16) | 55.76 Mha (16.96% of geographical area) |
| Total wastelands (2008-09) | 56.60 Mha |
| Wasteland reduction (2008-16) | 8,404 sq km |
| Highest wasteland state/UT | J&K (undivided, pre-2019) — 1,75,697 sq km |
| Lowest wasteland state/UT | Delhi — 81.27 sq km |
| States with wasteland decrease | 18 states |
| States with wasteland increase | 11 states |
| Highest wasteland reduction | Rajasthan — 0.48 Mha (sand dune reclamation + afforestation) |
| Highest wasteland increase | Odisha — 465.82 sq km |
Lesson Doubts
Ask questions, get expert answers